
|
|||||
|
 | |
| |
| |
| |
| |
| |
|
Gene: RABL2B |
Gene summary for RABL2B |
| Gene information | Species | Human | Gene symbol | RABL2B | Gene ID | 11158 |
| Gene name | RAB, member of RAS oncogene family like 2B | |
| Gene Alias | RABL2B | |
| Cytomap | 22q13.33 | |
| Gene Type | protein-coding | GO ID | GO:0006810 | UniProtAcc | Q9UNT1 |
Top |
Malignant transformation analysis |
| Identification of the aberrant gene expression in precancerous and cancerous lesions by comparing the gene expression of stem-like cells in diseased tissues with normal stem cells |
| Entrez ID | Symbol | Replicates | Species | Organ | Tissue | Adj P-value | Log2FC | Malignancy |
| 11158 | RABL2B | LZE4T | Human | Esophagus | ESCC | 3.05e-09 | 1.77e-01 | 0.0811 |
| 11158 | RABL2B | LZE7T | Human | Esophagus | ESCC | 8.83e-04 | 3.64e-01 | 0.0667 |
| 11158 | RABL2B | LZE8T | Human | Esophagus | ESCC | 7.79e-06 | 1.97e-01 | 0.067 |
| 11158 | RABL2B | LZE24T | Human | Esophagus | ESCC | 1.91e-11 | 4.37e-01 | 0.0596 |
| 11158 | RABL2B | P1T-E | Human | Esophagus | ESCC | 2.10e-05 | 2.95e-01 | 0.0875 |
| 11158 | RABL2B | P2T-E | Human | Esophagus | ESCC | 5.90e-27 | 4.73e-01 | 0.1177 |
| 11158 | RABL2B | P4T-E | Human | Esophagus | ESCC | 9.04e-07 | 1.74e-01 | 0.1323 |
| 11158 | RABL2B | P5T-E | Human | Esophagus | ESCC | 3.89e-07 | 1.07e-01 | 0.1327 |
| 11158 | RABL2B | P8T-E | Human | Esophagus | ESCC | 1.34e-10 | 2.52e-01 | 0.0889 |
| 11158 | RABL2B | P9T-E | Human | Esophagus | ESCC | 3.95e-06 | 1.66e-01 | 0.1131 |
| 11158 | RABL2B | P10T-E | Human | Esophagus | ESCC | 1.69e-24 | 5.56e-01 | 0.116 |
| 11158 | RABL2B | P11T-E | Human | Esophagus | ESCC | 1.41e-18 | 6.70e-01 | 0.1426 |
| 11158 | RABL2B | P12T-E | Human | Esophagus | ESCC | 4.16e-19 | 3.91e-01 | 0.1122 |
| 11158 | RABL2B | P15T-E | Human | Esophagus | ESCC | 4.05e-20 | 4.59e-01 | 0.1149 |
| 11158 | RABL2B | P16T-E | Human | Esophagus | ESCC | 5.43e-31 | 5.50e-01 | 0.1153 |
| 11158 | RABL2B | P17T-E | Human | Esophagus | ESCC | 1.07e-08 | 4.73e-01 | 0.1278 |
| 11158 | RABL2B | P20T-E | Human | Esophagus | ESCC | 5.43e-21 | 4.48e-01 | 0.1124 |
| 11158 | RABL2B | P21T-E | Human | Esophagus | ESCC | 5.24e-09 | 1.66e-01 | 0.1617 |
| 11158 | RABL2B | P22T-E | Human | Esophagus | ESCC | 3.76e-30 | 4.94e-01 | 0.1236 |
| 11158 | RABL2B | P23T-E | Human | Esophagus | ESCC | 6.45e-19 | 4.38e-01 | 0.108 |
| Page: 1 2 3 4 |
| Tissue | Expression Dynamics | Abbreviation |
| Esophagus | 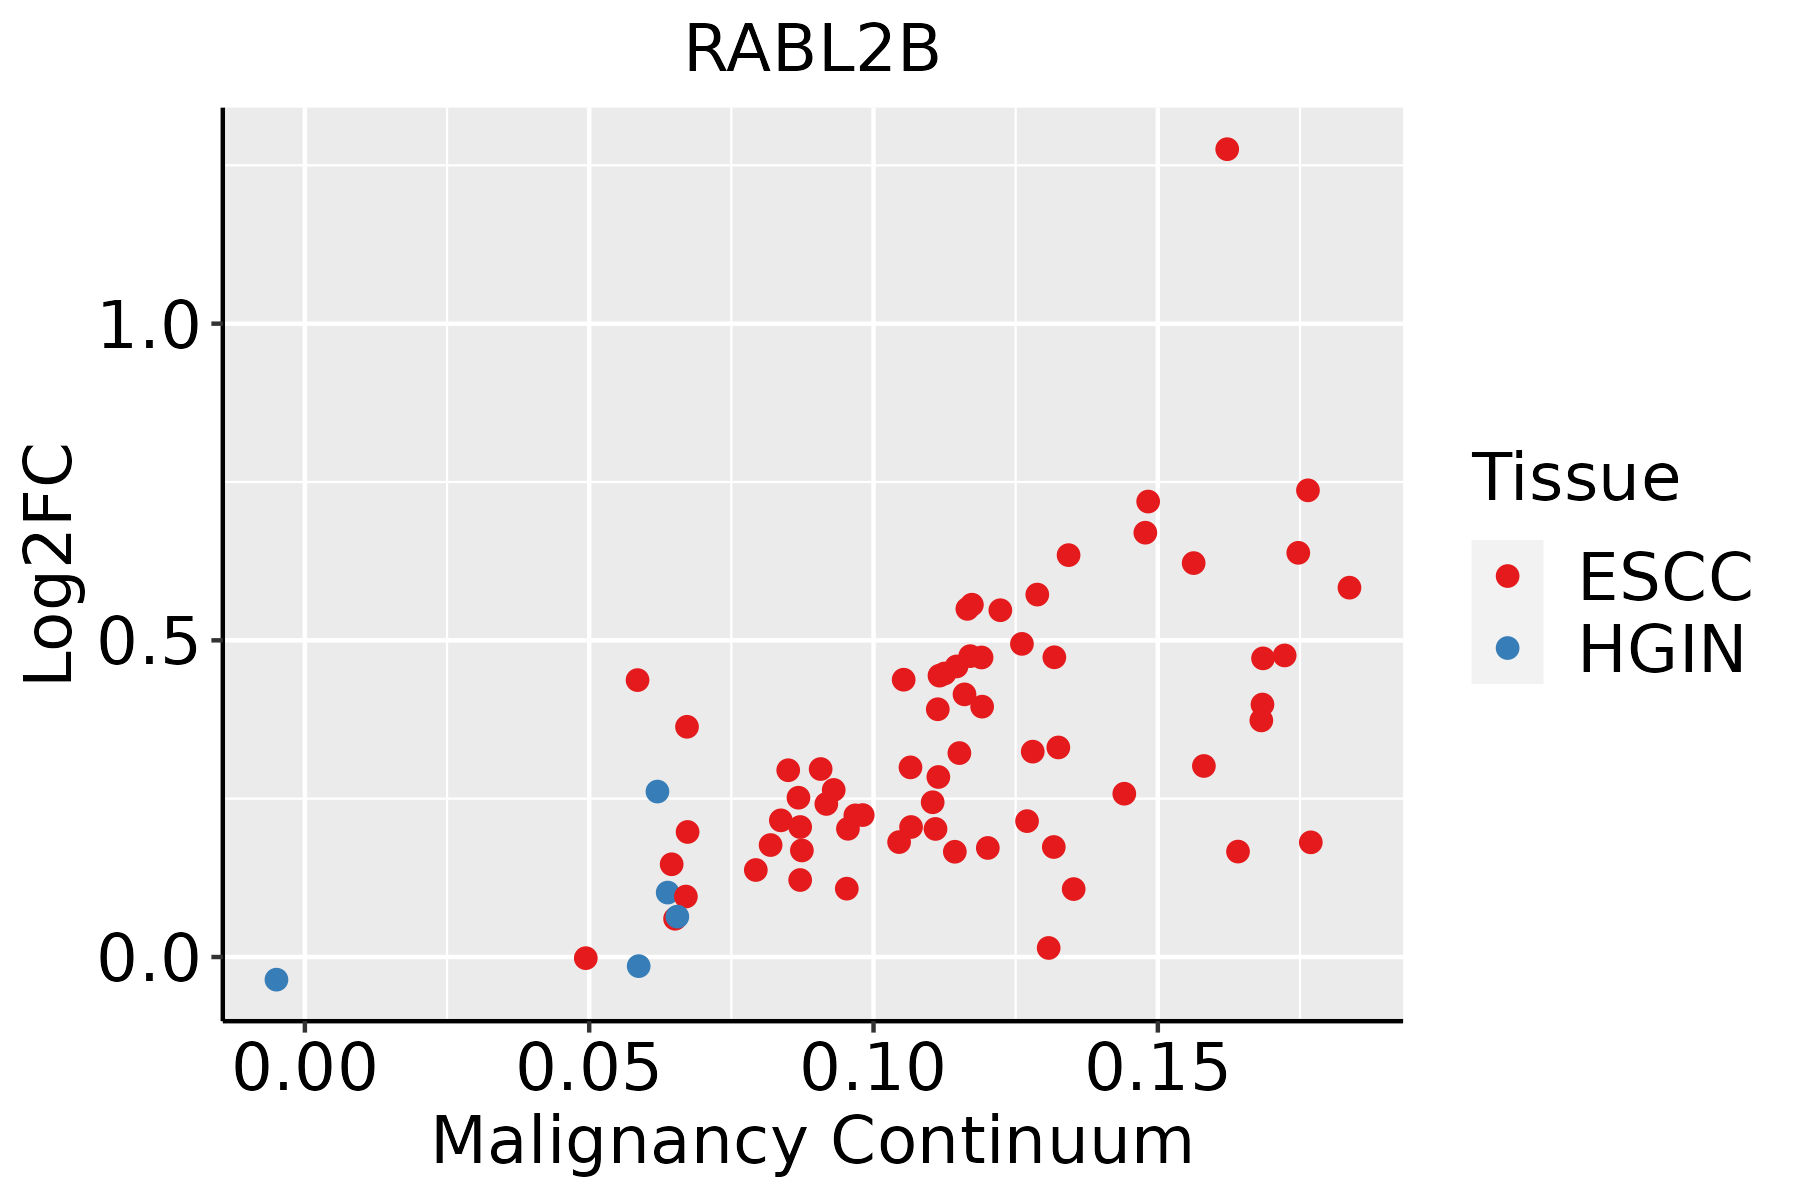 | ESCC: Esophageal squamous cell carcinoma |
| HGIN: High-grade intraepithelial neoplasias | ||
| LGIN: Low-grade intraepithelial neoplasias | ||
| Oral Cavity | 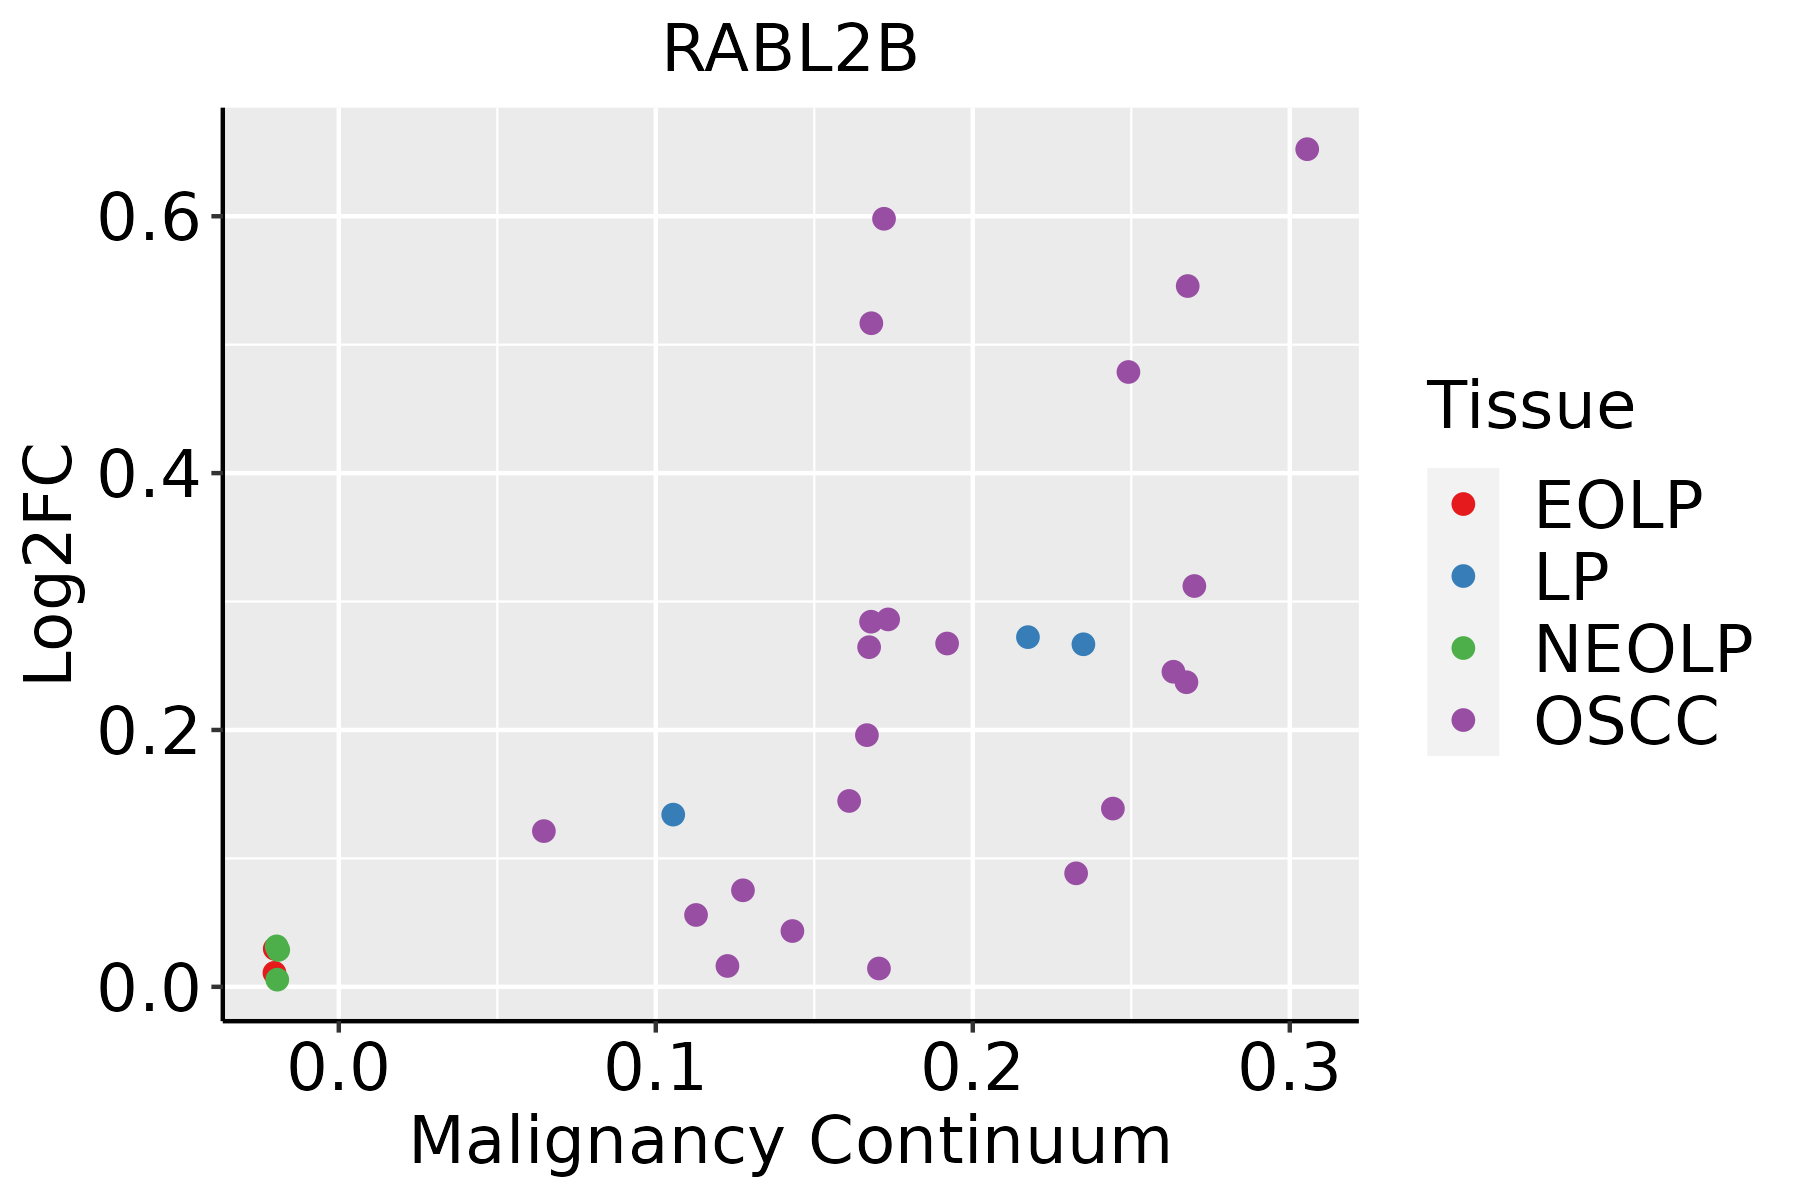 | EOLP: Erosive Oral lichen planus |
| LP: leukoplakia | ||
| NEOLP: Non-erosive oral lichen planus | ||
| OSCC: Oral squamous cell carcinoma |
| ∗log2FC in expression of this searched gene in stem-like cells from each diseased tissue sample relative to stem-like cells in normal samples in each tissue plotted against the malignancy continuum. Samples are colored based on if they are from different disease stage. |
Top |
Malignant transformation related pathway analysis |
| Find out the enriched GO biological processes and KEGG pathways involved in transition from healthy to precancer to cancer |
| Tissue | Disease Stage | Enriched GO biological Processes |
| Colorectum | AD |  |
| Colorectum | SER |  |
| Colorectum | MSS |  |
| Colorectum | MSI-H |  |
| Colorectum | FAP |  |
| ∗Top 15 enriched GO BP terms are showed in the bar plot of each disease state in each tissue. Each row represents a significant GO biological process which is colored according to the -log10(p.adjust). |
| Page: 1 2 3 4 5 6 7 8 9 |
| GO ID | Tissue | Disease Stage | Description | Gene Ratio | Bg Ratio | pvalue | p.adjust | Count |
| GO:003070518 | Esophagus | ESCC | cytoskeleton-dependent intracellular transport | 133/8552 | 195/18723 | 1.48e-10 | 4.27e-09 | 133 |
| GO:001097013 | Esophagus | ESCC | transport along microtubule | 107/8552 | 155/18723 | 3.17e-09 | 6.80e-08 | 107 |
| GO:003150314 | Esophagus | ESCC | protein-containing complex localization | 139/8552 | 220/18723 | 1.14e-07 | 1.85e-06 | 139 |
| GO:00991114 | Esophagus | ESCC | microtubule-based transport | 115/8552 | 190/18723 | 2.54e-05 | 2.15e-04 | 115 |
| GO:003070510 | Oral cavity | OSCC | cytoskeleton-dependent intracellular transport | 113/7305 | 195/18723 | 6.03e-08 | 1.09e-06 | 113 |
| GO:00315034 | Oral cavity | OSCC | protein-containing complex localization | 123/7305 | 220/18723 | 2.54e-07 | 4.00e-06 | 123 |
| GO:00109706 | Oral cavity | OSCC | transport along microtubule | 88/7305 | 155/18723 | 5.35e-06 | 6.02e-05 | 88 |
| GO:00991113 | Oral cavity | OSCC | microtubule-based transport | 96/7305 | 190/18723 | 7.92e-04 | 4.27e-03 | 96 |
| Page: 1 |
| Pathway ID | Tissue | Disease Stage | Description | Gene Ratio | Bg Ratio | pvalue | p.adjust | qvalue | Count |
| Page: 1 |
Top |
Cell-cell communication analysis |
| Identification of potential cell-cell interactions between two cell types and their ligand-receptor pairs for different disease states |
| Ligand | Receptor | LRpair | Pathway | Tissue | Disease Stage |
| Page: 1 |
Top |
Single-cell gene regulatory network inference analysis |
| Find out the significant the regulons (TFs) and the target genes of each regulon across cell types for different disease states |
| TF | Cell Type | Tissue | Disease Stage | Target Gene | RSS | Regulon Activity |
| ∗The dot plots of a searched regulon are shown for all cell subpopulations in each disease state of each tissue based on the regulon specific score inferred using pySCENIC and by calculating the average expression. |
| Page: 1 |
Top |
Somatic mutation of malignant transformation related genes |
| Annotation of somatic variants for genes involved in malignant transformation |
| Hugo Symbol | Variant Class | Variant Classification | dbSNP RS | HGVSc | HGVSp | HGVSp Short | SWISSPROT | BIOTYPE | SIFT | PolyPhen | Tumor Sample Barcode | Tissue | Histology | Sex | Age | Stage | Therapy Types | Drugs | Outcome |
| RABL2B | SNV | Missense_Mutation | c.660N>C | p.Gln220His | p.Q220H | Q9UNT1 | protein_coding | deleterious(0.05) | benign(0.192) | TCGA-BH-A0HK-01 | Breast | breast invasive carcinoma | Female | >=65 | I/II | Hormone Therapy | arimidex | SD | |
| RABL2B | SNV | Missense_Mutation | novel | c.34N>C | p.Asp12His | p.D12H | Q9UNT1 | protein_coding | deleterious(0) | possibly_damaging(0.849) | TCGA-C8-A278-01 | Breast | breast invasive carcinoma | Female | <65 | III/IV | Hormone Therapy | tamoxiphen | SD |
| RABL2B | SNV | Missense_Mutation | c.155N>A | p.Ser52Tyr | p.S52Y | Q9UNT1 | protein_coding | deleterious(0) | probably_damaging(1) | TCGA-D8-A1XU-01 | Breast | breast invasive carcinoma | Female | <65 | I/II | Unknown | Unknown | SD | |
| RABL2B | SNV | Missense_Mutation | rs782241181 | c.388N>A | p.Val130Met | p.V130M | Q9UNT1 | protein_coding | deleterious(0.04) | possibly_damaging(0.757) | TCGA-2W-A8YY-01 | Cervix | cervical & endocervical cancer | Female | <65 | I/II | Chemotherapy | cisplatin | CR |
| RABL2B | SNV | Missense_Mutation | novel | c.497N>C | p.Val166Ala | p.V166A | Q9UNT1 | protein_coding | deleterious(0) | probably_damaging(0.999) | TCGA-AZ-4315-01 | Colorectum | colon adenocarcinoma | Male | <65 | I/II | Unknown | Unknown | SD |
| RABL2B | SNV | Missense_Mutation | novel | c.320N>G | p.Val107Gly | p.V107G | Q9UNT1 | protein_coding | deleterious(0.01) | benign(0.358) | TCGA-CA-6717-01 | Colorectum | colon adenocarcinoma | Male | <65 | I/II | Chemotherapy | oxaliplatin | CR |
| RABL2B | SNV | Missense_Mutation | novel | c.401A>C | p.Lys134Thr | p.K134T | Q9UNT1 | protein_coding | deleterious(0) | probably_damaging(0.994) | TCGA-CA-6718-01 | Colorectum | colon adenocarcinoma | Male | <65 | I/II | Unknown | Unknown | PD |
| RABL2B | SNV | Missense_Mutation | novel | c.476C>T | p.Ser159Leu | p.S159L | Q9UNT1 | protein_coding | deleterious(0) | probably_damaging(0.994) | TCGA-EI-6917-01 | Colorectum | rectum adenocarcinoma | Male | <65 | III/IV | Chemotherapy | 5fluorouracil+oxaciplatina+l-folinian | SD |
| RABL2B | SNV | Missense_Mutation | novel | c.476N>T | p.Ser159Leu | p.S159L | Q9UNT1 | protein_coding | deleterious(0) | probably_damaging(0.994) | TCGA-A5-A2K3-01 | Endometrium | uterine corpus endometrioid carcinoma | Female | >=65 | I/II | Chemotherapy | carboplatin | SD |
| RABL2B | SNV | Missense_Mutation | c.554G>A | p.Arg185Gln | p.R185Q | Q9UNT1 | protein_coding | tolerated(0.2) | benign(0.024) | TCGA-AP-A0LM-01 | Endometrium | uterine corpus endometrioid carcinoma | Female | <65 | III/IV | Chemotherapy | cisplatin | SD |
| Page: 1 2 |
Top |
Related drugs of malignant transformation related genes |
| Identification of chemicals and drugs interact with genes involved in malignant transfromation |
| (DGIdb 4.0) |
| Entrez ID | Symbol | Category | Interaction Types | Drug Claim Name | Drug Name | PMIDs |
| Page: 1 |

Copyright 2023-Present -The University of Texas Health Science Center at Houston |