
|
|||||
|
 | |
| |
| |
| |
| |
| |
|
Gene: RABIF |
Gene summary for RABIF |
| Gene information | Species | Human | Gene symbol | RABIF | Gene ID | 5877 |
| Gene name | RAB interacting factor | |
| Gene Alias | MSS4 | |
| Cytomap | 1q32.1 | |
| Gene Type | protein-coding | GO ID | GO:0006810 | UniProtAcc | P47224 |
Top |
Malignant transformation analysis |
| Identification of the aberrant gene expression in precancerous and cancerous lesions by comparing the gene expression of stem-like cells in diseased tissues with normal stem cells |
| Entrez ID | Symbol | Replicates | Species | Organ | Tissue | Adj P-value | Log2FC | Malignancy |
| 5877 | RABIF | LZE4T | Human | Esophagus | ESCC | 3.42e-11 | 2.57e-01 | 0.0811 |
| 5877 | RABIF | LZE5T | Human | Esophagus | ESCC | 4.95e-03 | 4.39e-01 | 0.0514 |
| 5877 | RABIF | LZE7T | Human | Esophagus | ESCC | 7.11e-10 | 4.41e-01 | 0.0667 |
| 5877 | RABIF | LZE8T | Human | Esophagus | ESCC | 4.62e-03 | 9.64e-03 | 0.067 |
| 5877 | RABIF | LZE20T | Human | Esophagus | ESCC | 5.53e-07 | 3.50e-01 | 0.0662 |
| 5877 | RABIF | LZE22T | Human | Esophagus | ESCC | 1.56e-06 | 5.72e-01 | 0.068 |
| 5877 | RABIF | LZE24T | Human | Esophagus | ESCC | 2.08e-19 | 3.72e-01 | 0.0596 |
| 5877 | RABIF | LZE21T | Human | Esophagus | ESCC | 5.45e-04 | 3.06e-01 | 0.0655 |
| 5877 | RABIF | LZE6T | Human | Esophagus | ESCC | 7.21e-04 | 2.59e-01 | 0.0845 |
| 5877 | RABIF | P1T-E | Human | Esophagus | ESCC | 1.88e-03 | 3.56e-01 | 0.0875 |
| 5877 | RABIF | P2T-E | Human | Esophagus | ESCC | 4.52e-06 | 1.73e-01 | 0.1177 |
| 5877 | RABIF | P4T-E | Human | Esophagus | ESCC | 4.84e-33 | 8.27e-01 | 0.1323 |
| 5877 | RABIF | P5T-E | Human | Esophagus | ESCC | 7.12e-18 | 5.12e-01 | 0.1327 |
| 5877 | RABIF | P8T-E | Human | Esophagus | ESCC | 8.72e-17 | 3.32e-01 | 0.0889 |
| 5877 | RABIF | P9T-E | Human | Esophagus | ESCC | 1.59e-26 | 5.46e-01 | 0.1131 |
| 5877 | RABIF | P10T-E | Human | Esophagus | ESCC | 1.64e-18 | 3.06e-01 | 0.116 |
| 5877 | RABIF | P11T-E | Human | Esophagus | ESCC | 9.23e-19 | 6.84e-01 | 0.1426 |
| 5877 | RABIF | P12T-E | Human | Esophagus | ESCC | 1.15e-15 | 2.93e-01 | 0.1122 |
| 5877 | RABIF | P15T-E | Human | Esophagus | ESCC | 2.32e-25 | 4.60e-01 | 0.1149 |
| 5877 | RABIF | P16T-E | Human | Esophagus | ESCC | 2.12e-07 | 2.47e-01 | 0.1153 |
| Page: 1 2 3 4 5 |
| Tissue | Expression Dynamics | Abbreviation |
| Esophagus | 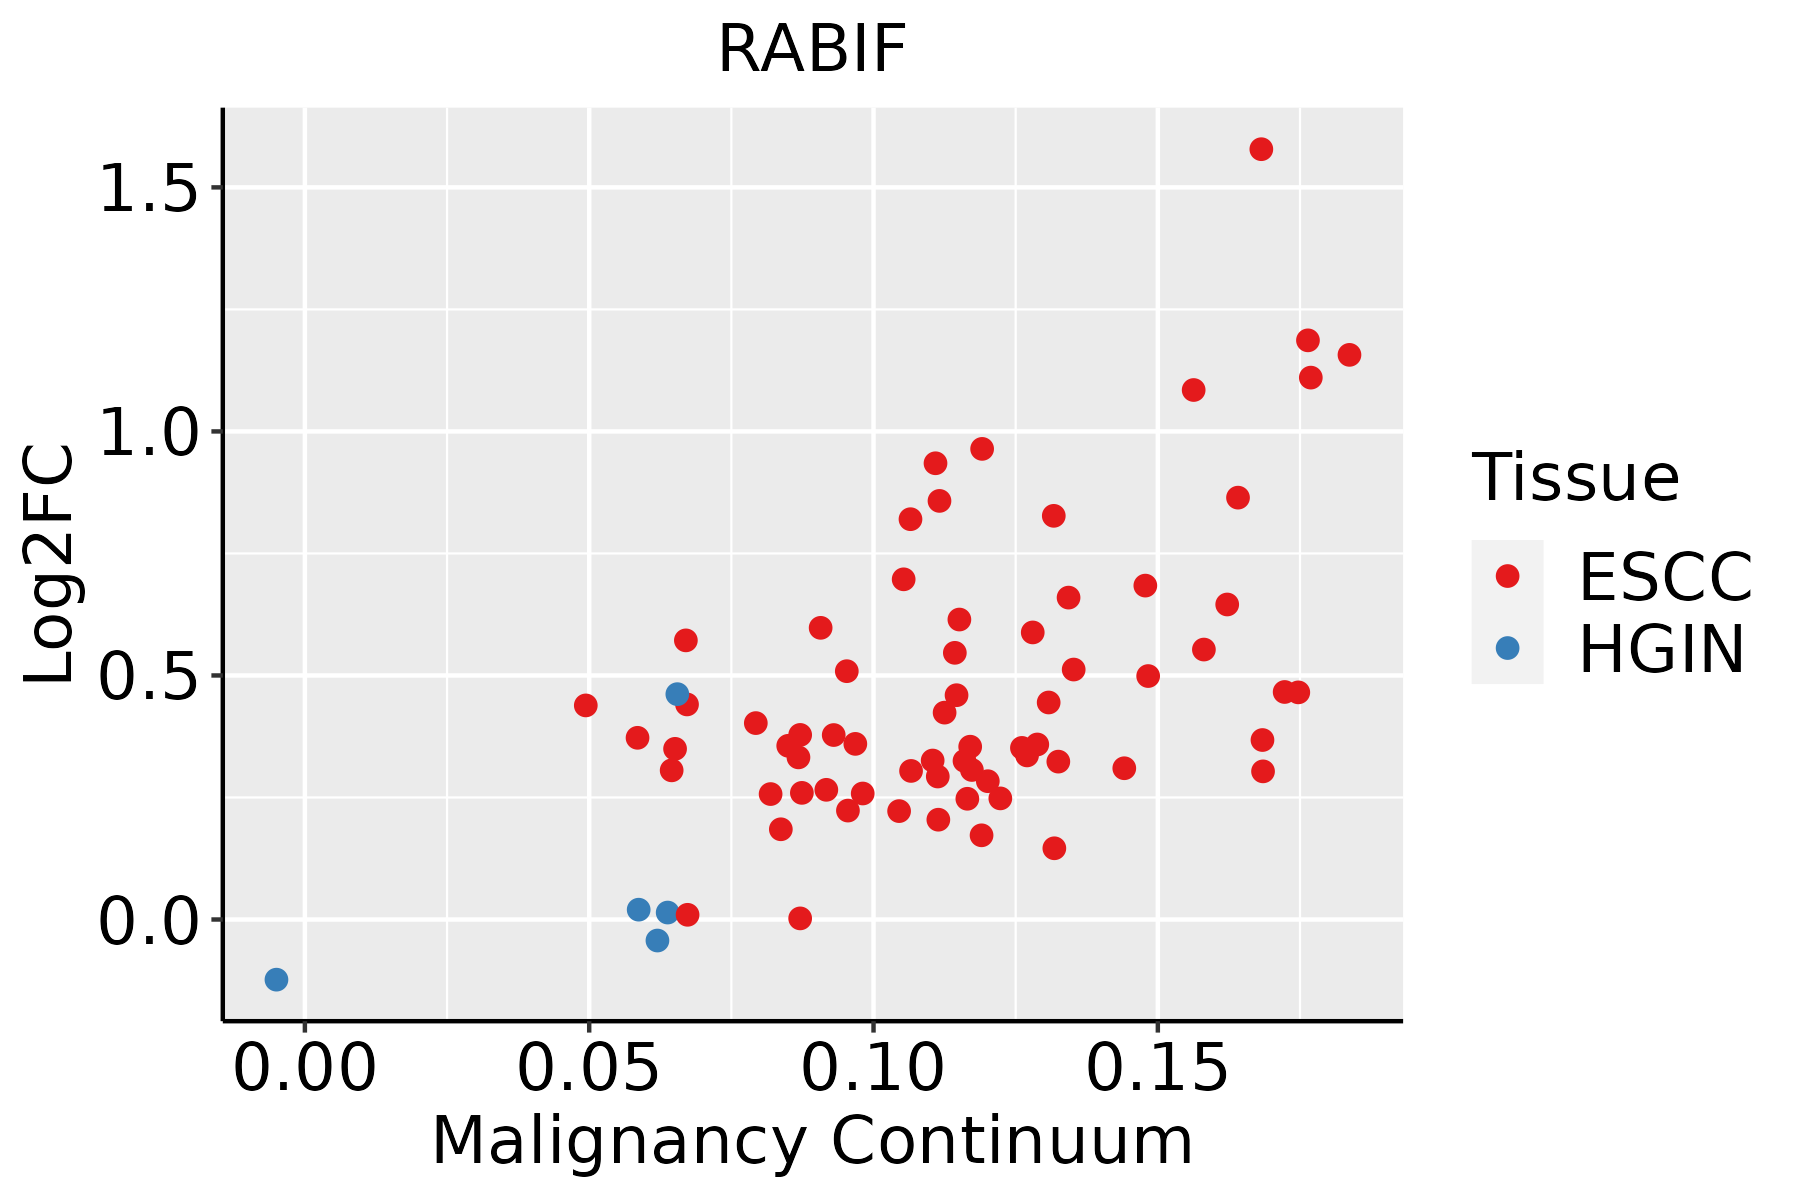 | ESCC: Esophageal squamous cell carcinoma |
| HGIN: High-grade intraepithelial neoplasias | ||
| LGIN: Low-grade intraepithelial neoplasias | ||
| Liver | 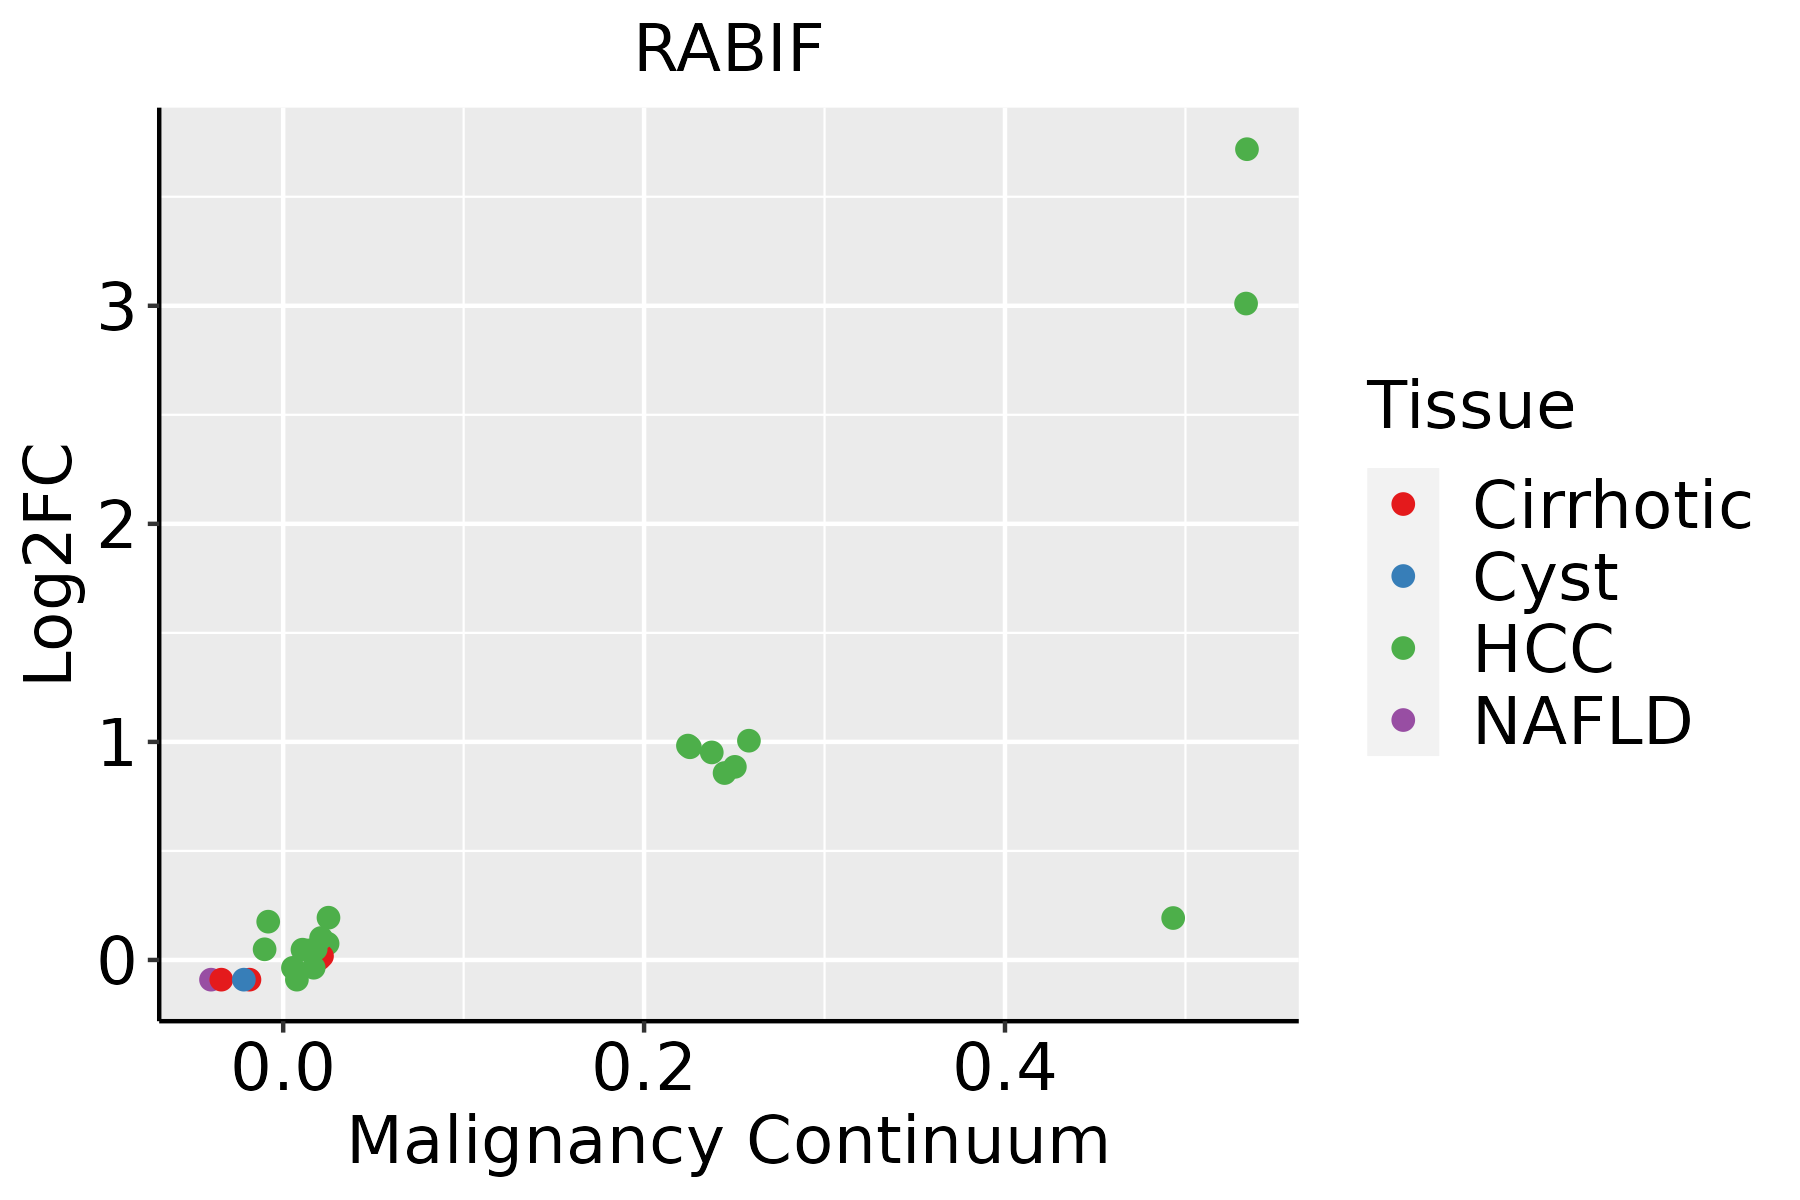 | HCC: Hepatocellular carcinoma |
| NAFLD: Non-alcoholic fatty liver disease | ||
| Oral Cavity | 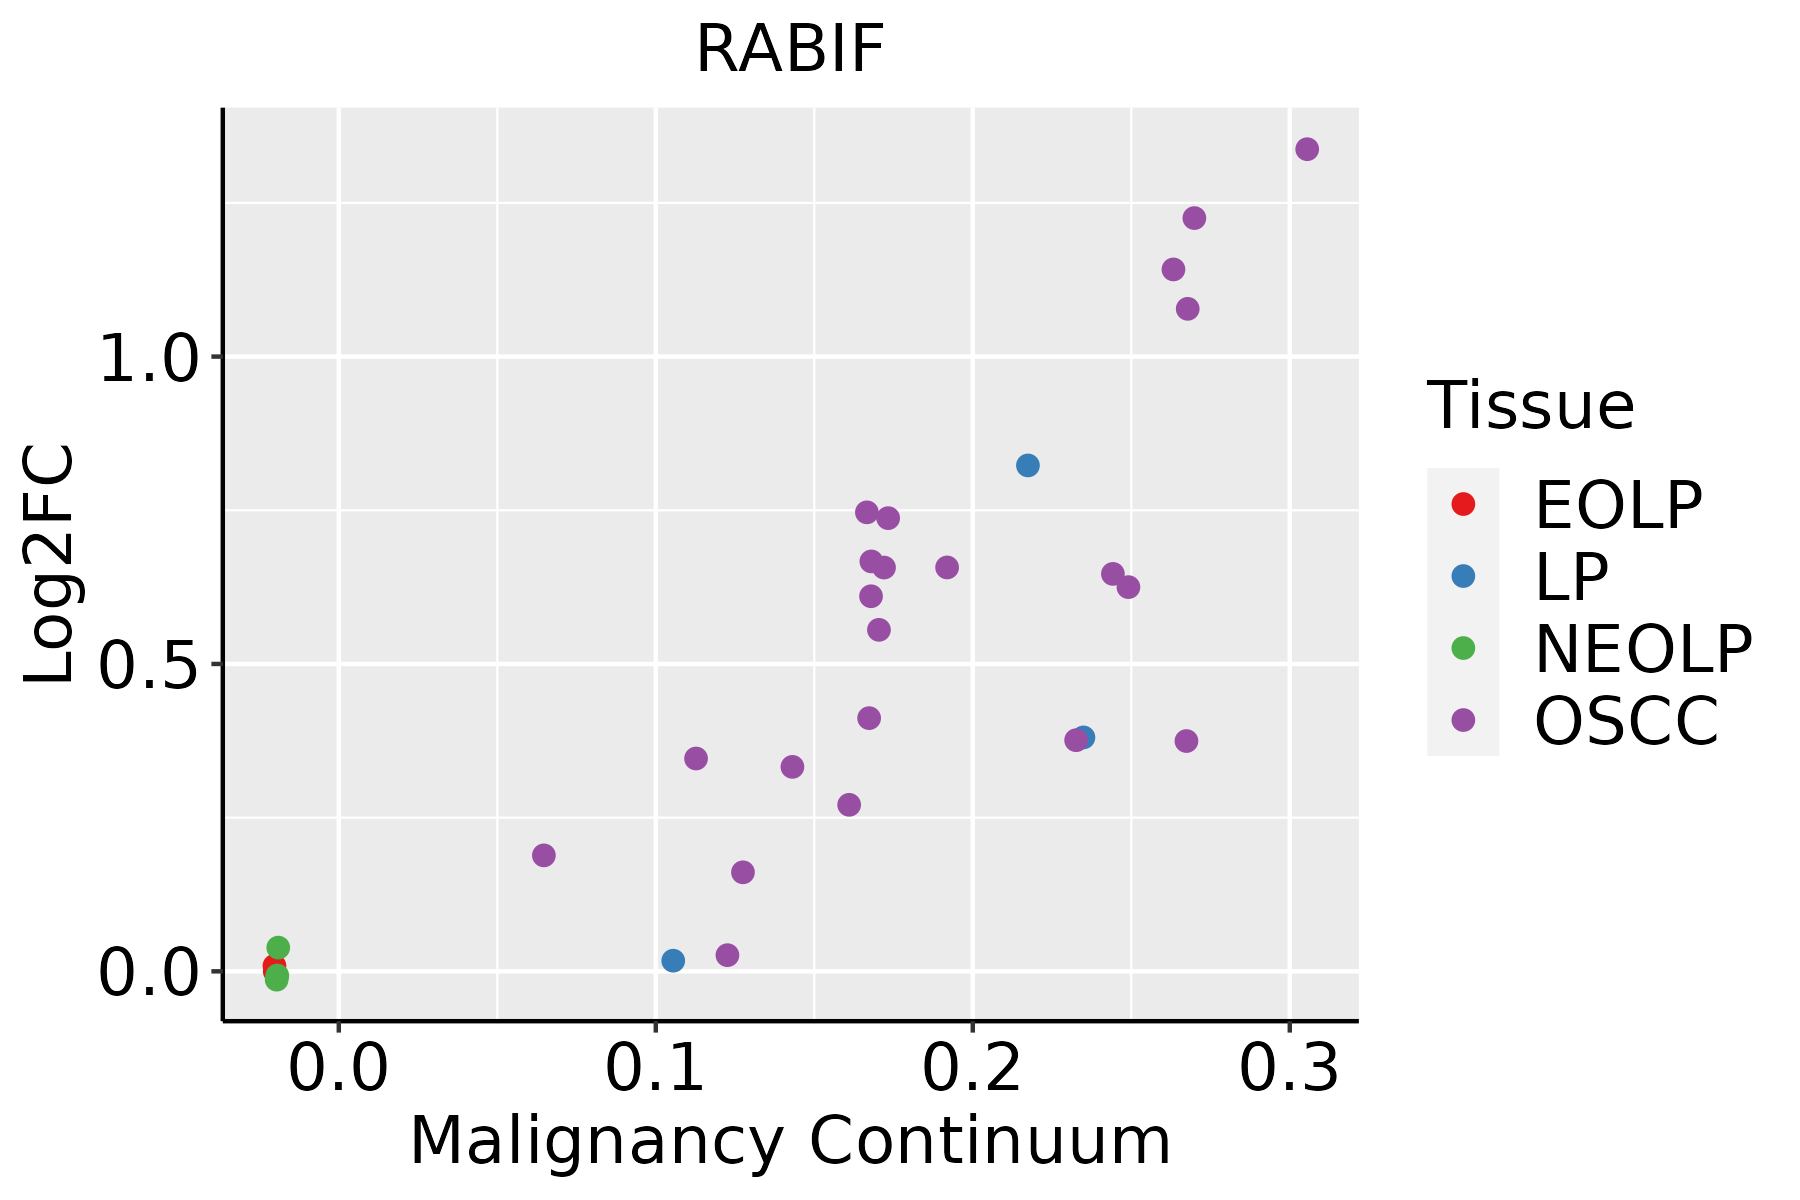 | EOLP: Erosive Oral lichen planus |
| LP: leukoplakia | ||
| NEOLP: Non-erosive oral lichen planus | ||
| OSCC: Oral squamous cell carcinoma | ||
| Skin | 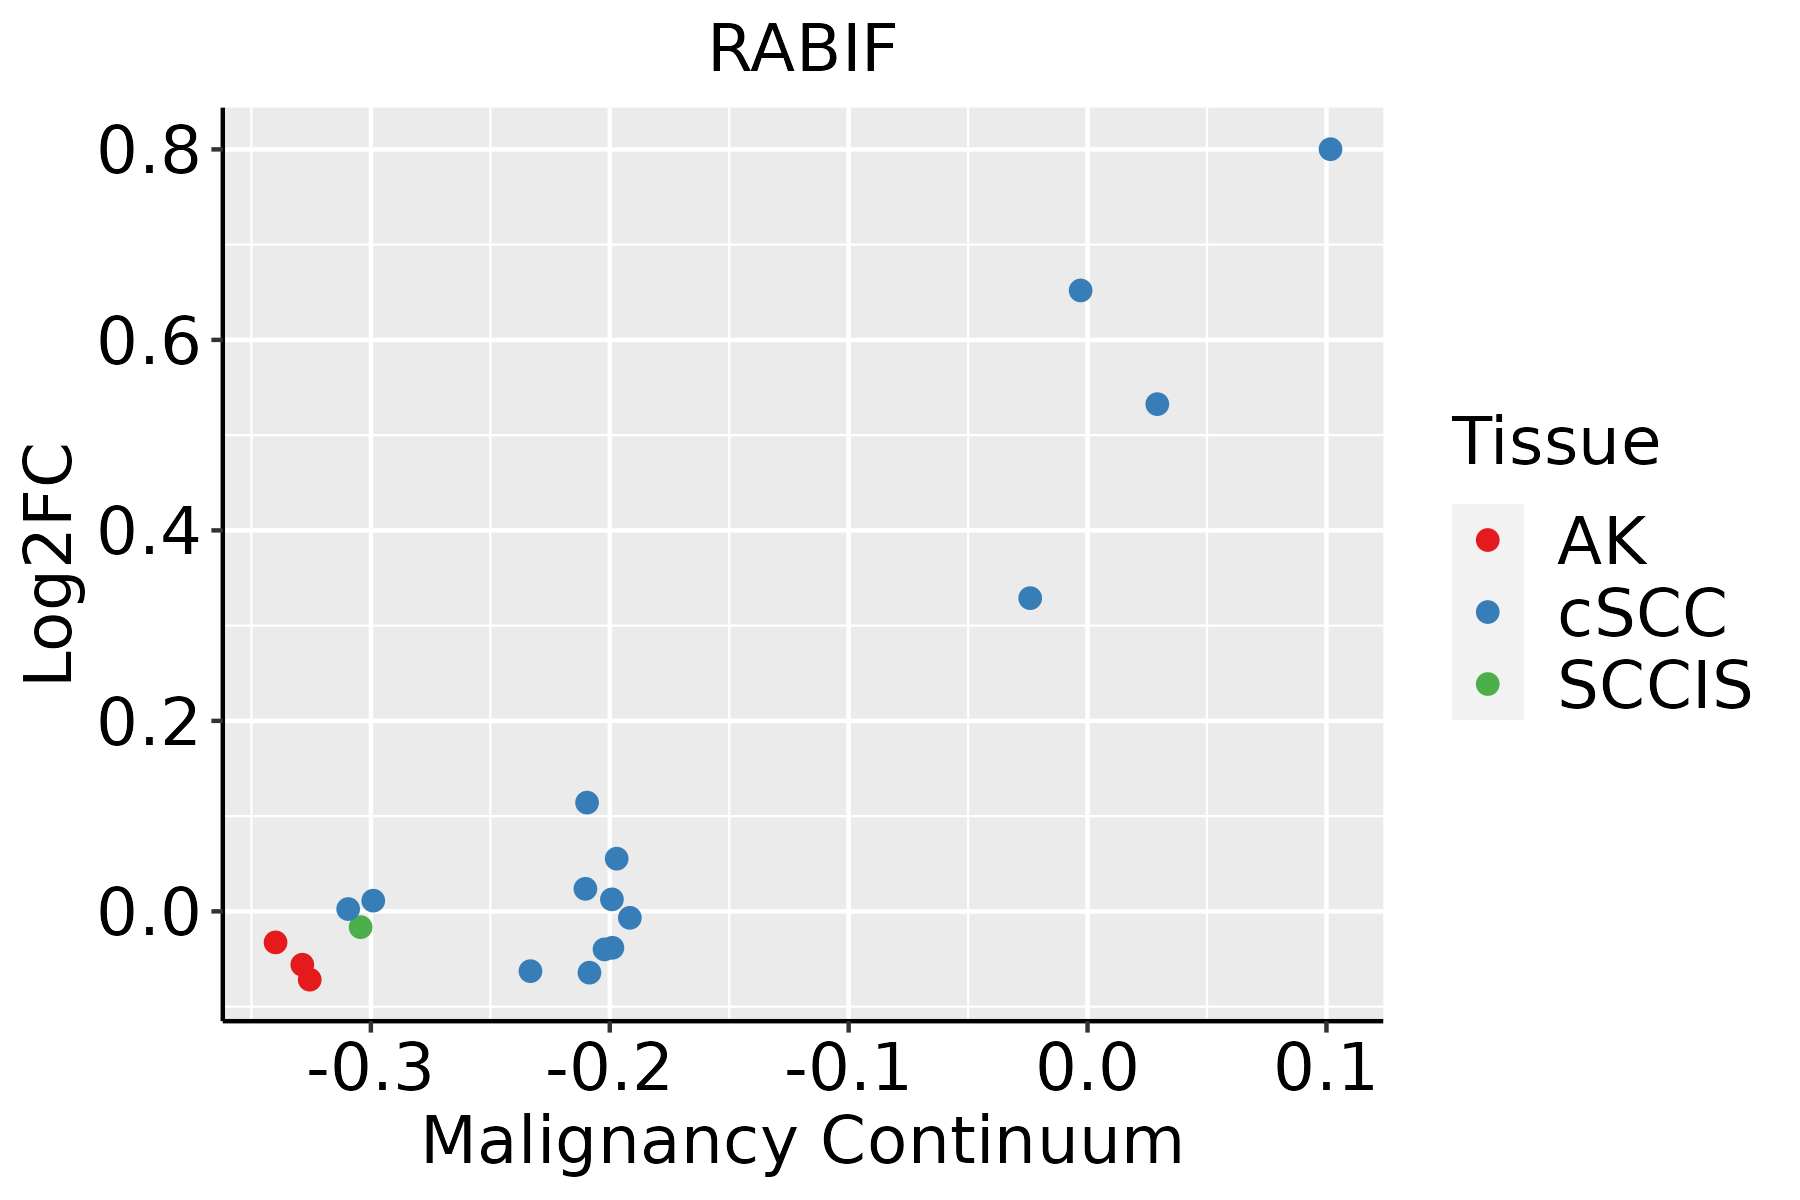 | AK: Actinic keratosis |
| cSCC: Cutaneous squamous cell carcinoma | ||
| SCCIS:squamous cell carcinoma in situ |
| ∗log2FC in expression of this searched gene in stem-like cells from each diseased tissue sample relative to stem-like cells in normal samples in each tissue plotted against the malignancy continuum. Samples are colored based on if they are from different disease stage. |
Top |
Malignant transformation related pathway analysis |
| Find out the enriched GO biological processes and KEGG pathways involved in transition from healthy to precancer to cancer |
| Tissue | Disease Stage | Enriched GO biological Processes |
| Colorectum | AD |  |
| Colorectum | SER |  |
| Colorectum | MSS |  |
| Colorectum | MSI-H |  |
| Colorectum | FAP |  |
| ∗Top 15 enriched GO BP terms are showed in the bar plot of each disease state in each tissue. Each row represents a significant GO biological process which is colored according to the -log10(p.adjust). |
| Page: 1 2 3 4 5 6 7 8 9 |
| GO ID | Tissue | Disease Stage | Description | Gene Ratio | Bg Ratio | pvalue | p.adjust | Count |
| GO:004819318 | Esophagus | ESCC | Golgi vesicle transport | 231/8552 | 296/18723 | 1.82e-30 | 9.63e-28 | 231 |
| GO:000689215 | Esophagus | ESCC | post-Golgi vesicle-mediated transport | 82/8552 | 104/18723 | 4.00e-12 | 1.55e-10 | 82 |
| GO:00610254 | Esophagus | ESCC | membrane fusion | 98/8552 | 163/18723 | 1.39e-04 | 9.41e-04 | 98 |
| GO:004819321 | Liver | HCC | Golgi vesicle transport | 217/7958 | 296/18723 | 2.58e-27 | 1.02e-24 | 217 |
| GO:000689221 | Liver | HCC | post-Golgi vesicle-mediated transport | 77/7958 | 104/18723 | 6.14e-11 | 2.24e-09 | 77 |
| GO:0061025 | Liver | HCC | membrane fusion | 88/7958 | 163/18723 | 1.98e-03 | 1.00e-02 | 88 |
| GO:004819315 | Oral cavity | OSCC | Golgi vesicle transport | 209/7305 | 296/18723 | 1.39e-28 | 6.30e-26 | 209 |
| GO:00068929 | Oral cavity | OSCC | post-Golgi vesicle-mediated transport | 71/7305 | 104/18723 | 1.37e-09 | 3.33e-08 | 71 |
| GO:00610253 | Oral cavity | OSCC | membrane fusion | 84/7305 | 163/18723 | 7.56e-04 | 4.12e-03 | 84 |
| GO:004819316 | Oral cavity | LP | Golgi vesicle transport | 141/4623 | 296/18723 | 6.11e-18 | 1.06e-15 | 141 |
| GO:000689214 | Oral cavity | LP | post-Golgi vesicle-mediated transport | 44/4623 | 104/18723 | 5.90e-05 | 8.05e-04 | 44 |
| GO:00610251 | Oral cavity | LP | membrane fusion | 58/4623 | 163/18723 | 1.19e-03 | 9.62e-03 | 58 |
| GO:0048193110 | Skin | cSCC | Golgi vesicle transport | 153/4864 | 296/18723 | 1.85e-21 | 3.41e-19 | 153 |
| GO:000689217 | Skin | cSCC | post-Golgi vesicle-mediated transport | 49/4864 | 104/18723 | 2.71e-06 | 4.30e-05 | 49 |
| GO:00610255 | Skin | cSCC | membrane fusion | 63/4864 | 163/18723 | 2.49e-04 | 2.03e-03 | 63 |
| Page: 1 |
| Pathway ID | Tissue | Disease Stage | Description | Gene Ratio | Bg Ratio | pvalue | p.adjust | qvalue | Count |
| Page: 1 |
Top |
Cell-cell communication analysis |
| Identification of potential cell-cell interactions between two cell types and their ligand-receptor pairs for different disease states |
| Ligand | Receptor | LRpair | Pathway | Tissue | Disease Stage |
| Page: 1 |
Top |
Single-cell gene regulatory network inference analysis |
| Find out the significant the regulons (TFs) and the target genes of each regulon across cell types for different disease states |
| TF | Cell Type | Tissue | Disease Stage | Target Gene | RSS | Regulon Activity |
| ∗The dot plots of a searched regulon are shown for all cell subpopulations in each disease state of each tissue based on the regulon specific score inferred using pySCENIC and by calculating the average expression. |
| Page: 1 |
Top |
Somatic mutation of malignant transformation related genes |
| Annotation of somatic variants for genes involved in malignant transformation |
| Hugo Symbol | Variant Class | Variant Classification | dbSNP RS | HGVSc | HGVSp | HGVSp Short | SWISSPROT | BIOTYPE | SIFT | PolyPhen | Tumor Sample Barcode | Tissue | Histology | Sex | Age | Stage | Therapy Types | Drugs | Outcome |
| RABIF | SNV | Missense_Mutation | rs756339996 | c.176N>G | p.Asn59Ser | p.N59S | P47224 | protein_coding | tolerated(1) | benign(0) | TCGA-LL-A9Q3-01 | Breast | breast invasive carcinoma | Female | >=65 | III/IV | Immunotherapy | herceptin | CR |
| RABIF | deletion | Frame_Shift_Del | novel | c.288delC | p.Cys97ValfsTer11 | p.C97Vfs*11 | P47224 | protein_coding | TCGA-D8-A27V-01 | Breast | breast invasive carcinoma | Female | <65 | I/II | Hormone Therapy | tamoxiphen | SD | ||
| RABIF | SNV | Missense_Mutation | novel | c.40N>A | p.Glu14Lys | p.E14K | P47224 | protein_coding | deleterious(0.04) | benign(0.026) | TCGA-C5-A2LZ-01 | Cervix | cervical & endocervical cancer | Female | >=65 | III/IV | Unknown | Unknown | PD |
| RABIF | SNV | Missense_Mutation | c.242N>A | p.Gly81Asp | p.G81D | P47224 | protein_coding | deleterious(0) | probably_damaging(0.999) | TCGA-D5-6538-01 | Colorectum | colon adenocarcinoma | Female | >=65 | III/IV | Chemotherapy | xeloda | SD | |
| RABIF | SNV | Missense_Mutation | c.73N>T | p.Arg25Cys | p.R25C | P47224 | protein_coding | deleterious(0) | probably_damaging(0.97) | TCGA-AF-4110-01 | Colorectum | rectum adenocarcinoma | Male | >=65 | I/II | Chemotherapy | oxaliplatin | SD | |
| RABIF | SNV | Missense_Mutation | novel | c.339C>A | p.Phe113Leu | p.F113L | P47224 | protein_coding | deleterious(0.01) | probably_damaging(0.978) | TCGA-AG-A002-01 | Colorectum | rectum adenocarcinoma | Male | <65 | I/II | Unknown | Unknown | SD |
| RABIF | SNV | Missense_Mutation | novel | c.263N>G | p.Asn88Ser | p.N88S | P47224 | protein_coding | tolerated(0.24) | benign(0.005) | TCGA-EO-A22U-01 | Endometrium | uterine corpus endometrioid carcinoma | Female | >=65 | I/II | Unknown | Unknown | SD |
| RABIF | SNV | Missense_Mutation | novel | c.144G>T | p.Met48Ile | p.M48I | P47224 | protein_coding | tolerated(0.11) | possibly_damaging(0.654) | TCGA-69-A59K-01 | Lung | lung adenocarcinoma | Female | <65 | I/II | Chemotherapy | cisplatin | SD |
| RABIF | SNV | Missense_Mutation | c.341N>T | p.Tyr114Phe | p.Y114F | P47224 | protein_coding | tolerated(0.06) | possibly_damaging(0.634) | TCGA-34-5231-01 | Lung | lung squamous cell carcinoma | Male | >=65 | I/II | Unknown | Unknown | SD | |
| RABIF | SNV | Missense_Mutation | c.356G>T | p.Arg119Leu | p.R119L | P47224 | protein_coding | deleterious(0) | probably_damaging(1) | TCGA-85-6561-01 | Lung | lung squamous cell carcinoma | Male | >=65 | I/II | Chemotherapy | cisplatin | SD |
| Page: 1 2 |
Top |
Related drugs of malignant transformation related genes |
| Identification of chemicals and drugs interact with genes involved in malignant transfromation |
| (DGIdb 4.0) |
| Entrez ID | Symbol | Category | Interaction Types | Drug Claim Name | Drug Name | PMIDs |
| Page: 1 |

Copyright 2023-Present -The University of Texas Health Science Center at Houston |