
|
|||||
|
 | |
| |
| |
| |
| |
| |
|
Gene: RABEP2 |
Gene summary for RABEP2 |
| Gene information | Species | Human | Gene symbol | RABEP2 | Gene ID | 79874 |
| Gene name | rabaptin, RAB GTPase binding effector protein 2 | |
| Gene Alias | FRA | |
| Cytomap | 16p11.2 | |
| Gene Type | protein-coding | GO ID | GO:0006810 | UniProtAcc | Q9H5N1 |
Top |
Malignant transformation analysis |
| Identification of the aberrant gene expression in precancerous and cancerous lesions by comparing the gene expression of stem-like cells in diseased tissues with normal stem cells |
| Entrez ID | Symbol | Replicates | Species | Organ | Tissue | Adj P-value | Log2FC | Malignancy |
| 79874 | RABEP2 | LZE2T | Human | Esophagus | ESCC | 9.07e-04 | 3.45e-01 | 0.082 |
| 79874 | RABEP2 | LZE4T | Human | Esophagus | ESCC | 6.17e-03 | 1.14e-01 | 0.0811 |
| 79874 | RABEP2 | LZE5T | Human | Esophagus | ESCC | 4.02e-03 | 2.05e-01 | 0.0514 |
| 79874 | RABEP2 | LZE7T | Human | Esophagus | ESCC | 6.68e-10 | 4.44e-01 | 0.0667 |
| 79874 | RABEP2 | LZE8T | Human | Esophagus | ESCC | 2.14e-02 | 9.21e-02 | 0.067 |
| 79874 | RABEP2 | LZE21D1 | Human | Esophagus | HGIN | 3.56e-03 | 2.79e-01 | 0.0632 |
| 79874 | RABEP2 | LZE22T | Human | Esophagus | ESCC | 2.61e-03 | 2.91e-01 | 0.068 |
| 79874 | RABEP2 | LZE24T | Human | Esophagus | ESCC | 5.57e-26 | 6.57e-01 | 0.0596 |
| 79874 | RABEP2 | LZE21T | Human | Esophagus | ESCC | 3.01e-06 | 2.82e-01 | 0.0655 |
| 79874 | RABEP2 | P1T-E | Human | Esophagus | ESCC | 3.44e-14 | 7.32e-01 | 0.0875 |
| 79874 | RABEP2 | P2T-E | Human | Esophagus | ESCC | 1.61e-32 | 5.28e-01 | 0.1177 |
| 79874 | RABEP2 | P4T-E | Human | Esophagus | ESCC | 8.64e-54 | 1.07e+00 | 0.1323 |
| 79874 | RABEP2 | P5T-E | Human | Esophagus | ESCC | 4.31e-06 | 1.51e-01 | 0.1327 |
| 79874 | RABEP2 | P8T-E | Human | Esophagus | ESCC | 8.08e-19 | 3.34e-01 | 0.0889 |
| 79874 | RABEP2 | P9T-E | Human | Esophagus | ESCC | 5.22e-11 | 1.58e-01 | 0.1131 |
| 79874 | RABEP2 | P10T-E | Human | Esophagus | ESCC | 3.60e-13 | 2.13e-01 | 0.116 |
| 79874 | RABEP2 | P11T-E | Human | Esophagus | ESCC | 1.89e-12 | 4.73e-01 | 0.1426 |
| 79874 | RABEP2 | P12T-E | Human | Esophagus | ESCC | 6.36e-33 | 4.92e-01 | 0.1122 |
| 79874 | RABEP2 | P15T-E | Human | Esophagus | ESCC | 5.67e-15 | 2.61e-01 | 0.1149 |
| 79874 | RABEP2 | P16T-E | Human | Esophagus | ESCC | 1.76e-12 | 2.07e-01 | 0.1153 |
| Page: 1 2 3 4 5 |
| Tissue | Expression Dynamics | Abbreviation |
| Esophagus | 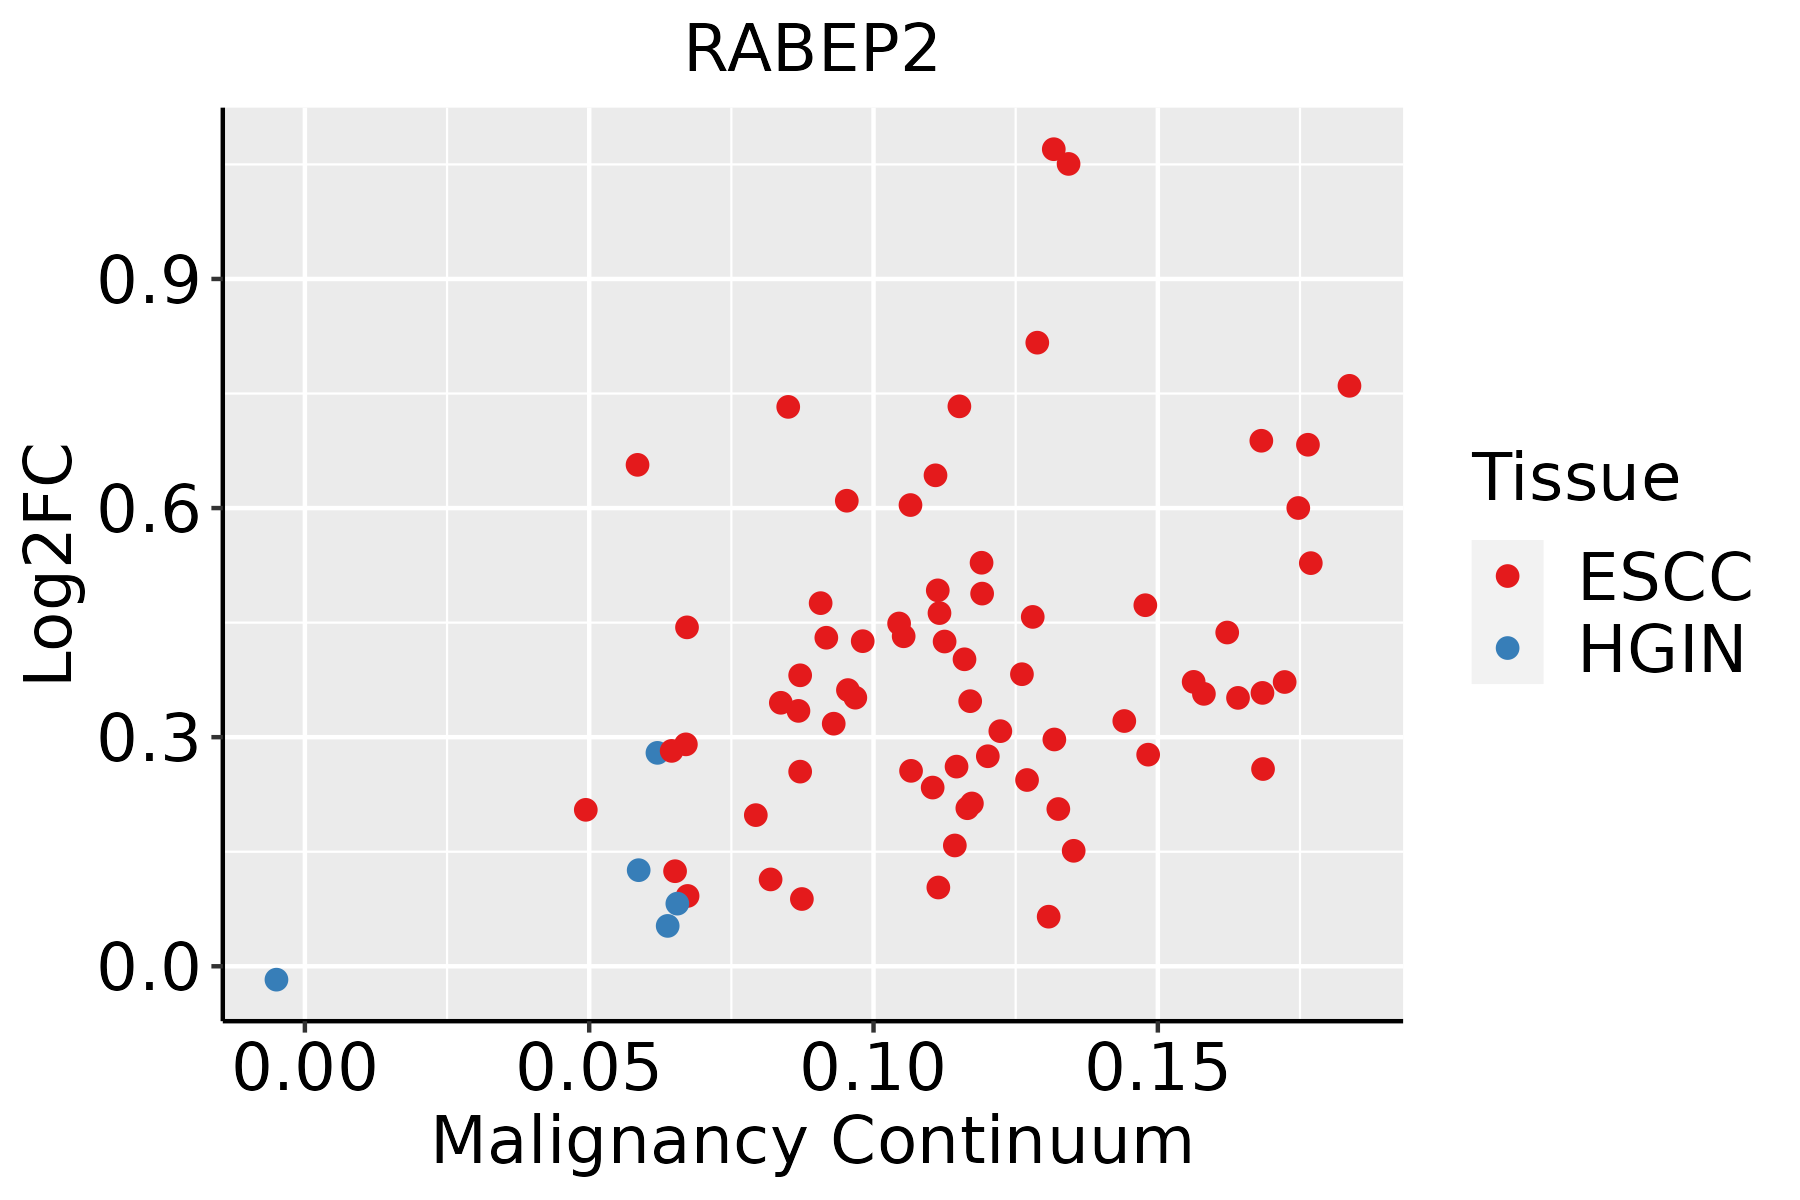 | ESCC: Esophageal squamous cell carcinoma |
| HGIN: High-grade intraepithelial neoplasias | ||
| LGIN: Low-grade intraepithelial neoplasias | ||
| Oral Cavity | 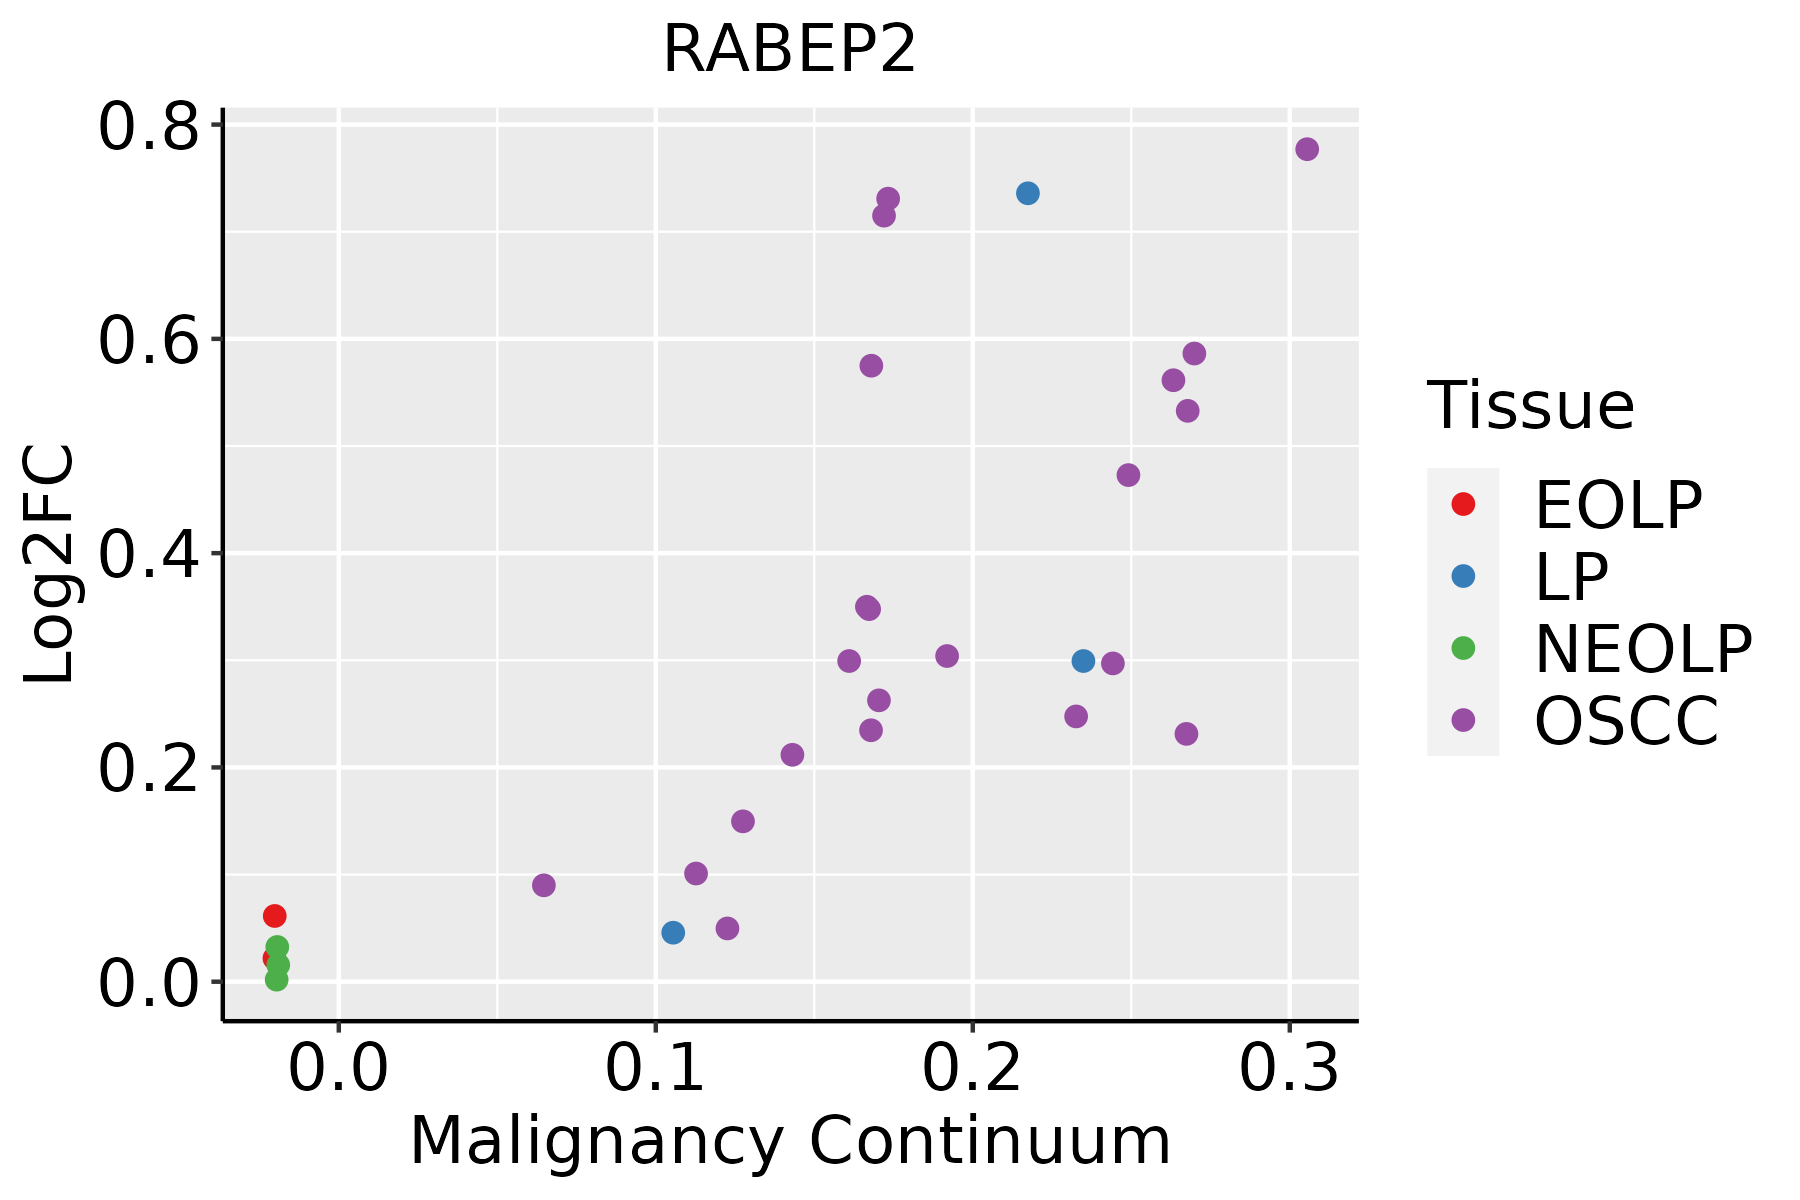 | EOLP: Erosive Oral lichen planus |
| LP: leukoplakia | ||
| NEOLP: Non-erosive oral lichen planus | ||
| OSCC: Oral squamous cell carcinoma | ||
| Prostate |  | BPH: Benign Prostatic Hyperplasia |
| ∗log2FC in expression of this searched gene in stem-like cells from each diseased tissue sample relative to stem-like cells in normal samples in each tissue plotted against the malignancy continuum. Samples are colored based on if they are from different disease stage. |
Top |
Malignant transformation related pathway analysis |
| Find out the enriched GO biological processes and KEGG pathways involved in transition from healthy to precancer to cancer |
| Tissue | Disease Stage | Enriched GO biological Processes |
| Colorectum | AD |  |
| Colorectum | SER |  |
| Colorectum | MSS |  |
| Colorectum | MSI-H |  |
| Colorectum | FAP |  |
| ∗Top 15 enriched GO BP terms are showed in the bar plot of each disease state in each tissue. Each row represents a significant GO biological process which is colored according to the -log10(p.adjust). |
| Page: 1 2 3 4 5 6 7 8 9 |
| GO ID | Tissue | Disease Stage | Description | Gene Ratio | Bg Ratio | pvalue | p.adjust | Count |
| GO:19021156 | Esophagus | HGIN | regulation of organelle assembly | 46/2587 | 186/18723 | 4.63e-05 | 1.12e-03 | 46 |
| GO:006049117 | Esophagus | HGIN | regulation of cell projection assembly | 39/2587 | 188/18723 | 5.61e-03 | 4.57e-02 | 39 |
| GO:190211514 | Esophagus | ESCC | regulation of organelle assembly | 116/8552 | 186/18723 | 3.15e-06 | 3.53e-05 | 116 |
| GO:006049118 | Esophagus | ESCC | regulation of cell projection assembly | 110/8552 | 188/18723 | 2.60e-04 | 1.58e-03 | 110 |
| GO:012003218 | Esophagus | ESCC | regulation of plasma membrane bounded cell projection assembly | 108/8552 | 186/18723 | 4.37e-04 | 2.46e-03 | 108 |
| GO:19021155 | Oral cavity | OSCC | regulation of organelle assembly | 109/7305 | 186/18723 | 4.54e-08 | 8.45e-07 | 109 |
| GO:006049110 | Oral cavity | OSCC | regulation of cell projection assembly | 100/7305 | 188/18723 | 5.27e-05 | 4.38e-04 | 100 |
| GO:012003216 | Oral cavity | OSCC | regulation of plasma membrane bounded cell projection assembly | 98/7305 | 186/18723 | 1.00e-04 | 7.54e-04 | 98 |
| GO:190211513 | Oral cavity | LP | regulation of organelle assembly | 71/4623 | 186/18723 | 2.94e-05 | 4.58e-04 | 71 |
| GO:006049116 | Oral cavity | LP | regulation of cell projection assembly | 66/4623 | 188/18723 | 8.62e-04 | 7.49e-03 | 66 |
| GO:012003217 | Oral cavity | LP | regulation of plasma membrane bounded cell projection assembly | 64/4623 | 186/18723 | 1.81e-03 | 1.37e-02 | 64 |
| GO:006049115 | Prostate | Tumor | regulation of cell projection assembly | 52/3246 | 188/18723 | 2.71e-04 | 2.24e-03 | 52 |
| GO:012003215 | Prostate | Tumor | regulation of plasma membrane bounded cell projection assembly | 51/3246 | 186/18723 | 3.87e-04 | 2.99e-03 | 51 |
| GO:190211512 | Prostate | Tumor | regulation of organelle assembly | 51/3246 | 186/18723 | 3.87e-04 | 2.99e-03 | 51 |
| Page: 1 |
| Pathway ID | Tissue | Disease Stage | Description | Gene Ratio | Bg Ratio | pvalue | p.adjust | qvalue | Count |
| Page: 1 |
Top |
Cell-cell communication analysis |
| Identification of potential cell-cell interactions between two cell types and their ligand-receptor pairs for different disease states |
| Ligand | Receptor | LRpair | Pathway | Tissue | Disease Stage |
| Page: 1 |
Top |
Single-cell gene regulatory network inference analysis |
| Find out the significant the regulons (TFs) and the target genes of each regulon across cell types for different disease states |
| TF | Cell Type | Tissue | Disease Stage | Target Gene | RSS | Regulon Activity |
| ∗The dot plots of a searched regulon are shown for all cell subpopulations in each disease state of each tissue based on the regulon specific score inferred using pySCENIC and by calculating the average expression. |
| Page: 1 |
Top |
Somatic mutation of malignant transformation related genes |
| Annotation of somatic variants for genes involved in malignant transformation |
| Hugo Symbol | Variant Class | Variant Classification | dbSNP RS | HGVSc | HGVSp | HGVSp Short | SWISSPROT | BIOTYPE | SIFT | PolyPhen | Tumor Sample Barcode | Tissue | Histology | Sex | Age | Stage | Therapy Types | Drugs | Outcome |
| RABEP2 | SNV | Missense_Mutation | c.1181N>A | p.Ser394Tyr | p.S394Y | Q9H5N1 | protein_coding | tolerated(0.71) | possibly_damaging(0.53) | TCGA-A8-A099-01 | Breast | breast invasive carcinoma | Female | >=65 | III/IV | Hormone Therapy | exemestane | SD | |
| RABEP2 | SNV | Missense_Mutation | c.157N>C | p.Glu53Gln | p.E53Q | Q9H5N1 | protein_coding | deleterious(0) | probably_damaging(0.994) | TCGA-AC-A23H-01 | Breast | breast invasive carcinoma | Female | >=65 | I/II | Unknown | Unknown | PD | |
| RABEP2 | SNV | Missense_Mutation | c.346G>C | p.Glu116Gln | p.E116Q | Q9H5N1 | protein_coding | deleterious(0.03) | possibly_damaging(0.904) | TCGA-AR-A0TX-01 | Breast | breast invasive carcinoma | Female | <65 | I/II | Unknown | Unknown | SD | |
| RABEP2 | SNV | Missense_Mutation | novel | c.643N>A | p.Gly215Arg | p.G215R | Q9H5N1 | protein_coding | deleterious(0.03) | benign(0.163) | TCGA-BH-A0HF-01 | Breast | breast invasive carcinoma | Female | >=65 | I/II | Hormone Therapy | arimidex | SD |
| RABEP2 | SNV | Missense_Mutation | novel | c.263N>T | p.Ala88Val | p.A88V | Q9H5N1 | protein_coding | deleterious(0.02) | benign(0.253) | TCGA-BH-A0HF-01 | Breast | breast invasive carcinoma | Female | >=65 | I/II | Hormone Therapy | arimidex | SD |
| RABEP2 | SNV | Missense_Mutation | rs756554838 | c.400C>T | p.Pro134Ser | p.P134S | Q9H5N1 | protein_coding | deleterious(0.03) | probably_damaging(0.999) | TCGA-D8-A1XK-01 | Breast | breast invasive carcinoma | Female | <65 | I/II | Chemotherapy | doxorubicine+cyclophosphamide | SD |
| RABEP2 | SNV | Missense_Mutation | novel | c.1498N>T | p.Leu500Phe | p.L500F | Q9H5N1 | protein_coding | deleterious(0.02) | probably_damaging(0.991) | TCGA-GM-A5PX-01 | Breast | breast invasive carcinoma | Female | >=65 | I/II | Hormone Therapy | arimidex | CR |
| RABEP2 | SNV | Missense_Mutation | novel | c.1093G>A | p.Glu365Lys | p.E365K | Q9H5N1 | protein_coding | tolerated(0.16) | probably_damaging(0.968) | TCGA-C5-A1BJ-01 | Cervix | cervical & endocervical cancer | Female | <65 | I/II | Unknown | Unknown | SD |
| RABEP2 | SNV | Missense_Mutation | c.254N>G | p.Ser85Trp | p.S85W | Q9H5N1 | protein_coding | deleterious(0) | probably_damaging(0.999) | TCGA-HM-A4S6-01 | Cervix | cervical & endocervical cancer | Female | <65 | III/IV | Chemotherapy | cisplatin | CR | |
| RABEP2 | SNV | Missense_Mutation | c.254N>T | p.Ser85Leu | p.S85L | Q9H5N1 | protein_coding | deleterious(0) | probably_damaging(0.994) | TCGA-UC-A7PF-01 | Cervix | cervical & endocervical cancer | Female | <65 | I/II | Unknown | Unknown | SD |
| Page: 1 2 3 4 5 6 7 |
Top |
Related drugs of malignant transformation related genes |
| Identification of chemicals and drugs interact with genes involved in malignant transfromation |
| (DGIdb 4.0) |
| Entrez ID | Symbol | Category | Interaction Types | Drug Claim Name | Drug Name | PMIDs |
| Page: 1 |

Copyright 2023-Present -The University of Texas Health Science Center at Houston |