
|
|||||
|
 | |
| |
| |
| |
| |
| |
|
Gene: RAB8A |
Gene summary for RAB8A |
| Gene information | Species | Human | Gene symbol | RAB8A | Gene ID | 4218 |
| Gene name | RAB8A, member RAS oncogene family | |
| Gene Alias | MEL | |
| Cytomap | 19p13.11 | |
| Gene Type | protein-coding | GO ID | GO:0000902 | UniProtAcc | A0A024R7I3 |
Top |
Malignant transformation analysis |
| Identification of the aberrant gene expression in precancerous and cancerous lesions by comparing the gene expression of stem-like cells in diseased tissues with normal stem cells |
| Entrez ID | Symbol | Replicates | Species | Organ | Tissue | Adj P-value | Log2FC | Malignancy |
| 4218 | RAB8A | HTA11_347_2000001011 | Human | Colorectum | AD | 2.10e-02 | 1.97e-01 | -0.1954 |
| 4218 | RAB8A | HTA11_696_2000001011 | Human | Colorectum | AD | 8.21e-07 | 2.89e-01 | -0.1464 |
| 4218 | RAB8A | LZE4T | Human | Esophagus | ESCC | 1.62e-22 | 6.21e-01 | 0.0811 |
| 4218 | RAB8A | LZE5T | Human | Esophagus | ESCC | 8.23e-04 | 4.43e-01 | 0.0514 |
| 4218 | RAB8A | LZE7T | Human | Esophagus | ESCC | 1.38e-08 | 5.77e-01 | 0.0667 |
| 4218 | RAB8A | LZE8T | Human | Esophagus | ESCC | 4.59e-12 | 2.52e-01 | 0.067 |
| 4218 | RAB8A | LZE20T | Human | Esophagus | ESCC | 1.83e-08 | 2.75e-01 | 0.0662 |
| 4218 | RAB8A | LZE22D1 | Human | Esophagus | HGIN | 3.12e-02 | 1.42e-01 | 0.0595 |
| 4218 | RAB8A | LZE24T | Human | Esophagus | ESCC | 2.75e-32 | 8.93e-01 | 0.0596 |
| 4218 | RAB8A | LZE21T | Human | Esophagus | ESCC | 2.73e-05 | 3.33e-01 | 0.0655 |
| 4218 | RAB8A | LZE6T | Human | Esophagus | ESCC | 2.47e-13 | 5.67e-01 | 0.0845 |
| 4218 | RAB8A | P1T-E | Human | Esophagus | ESCC | 4.55e-14 | 7.31e-01 | 0.0875 |
| 4218 | RAB8A | P2T-E | Human | Esophagus | ESCC | 1.66e-17 | 3.82e-01 | 0.1177 |
| 4218 | RAB8A | P4T-E | Human | Esophagus | ESCC | 3.83e-36 | 8.19e-01 | 0.1323 |
| 4218 | RAB8A | P5T-E | Human | Esophagus | ESCC | 1.96e-41 | 6.68e-01 | 0.1327 |
| 4218 | RAB8A | P8T-E | Human | Esophagus | ESCC | 7.16e-43 | 7.93e-01 | 0.0889 |
| 4218 | RAB8A | P9T-E | Human | Esophagus | ESCC | 5.43e-31 | 6.61e-01 | 0.1131 |
| 4218 | RAB8A | P10T-E | Human | Esophagus | ESCC | 5.48e-47 | 8.03e-01 | 0.116 |
| 4218 | RAB8A | P11T-E | Human | Esophagus | ESCC | 5.81e-26 | 8.43e-01 | 0.1426 |
| 4218 | RAB8A | P12T-E | Human | Esophagus | ESCC | 2.96e-38 | 7.08e-01 | 0.1122 |
| Page: 1 2 3 4 5 6 |
| Tissue | Expression Dynamics | Abbreviation |
| Colorectum (GSE201348) |  | FAP: Familial adenomatous polyposis |
| CRC: Colorectal cancer | ||
| Colorectum (HTA11) | 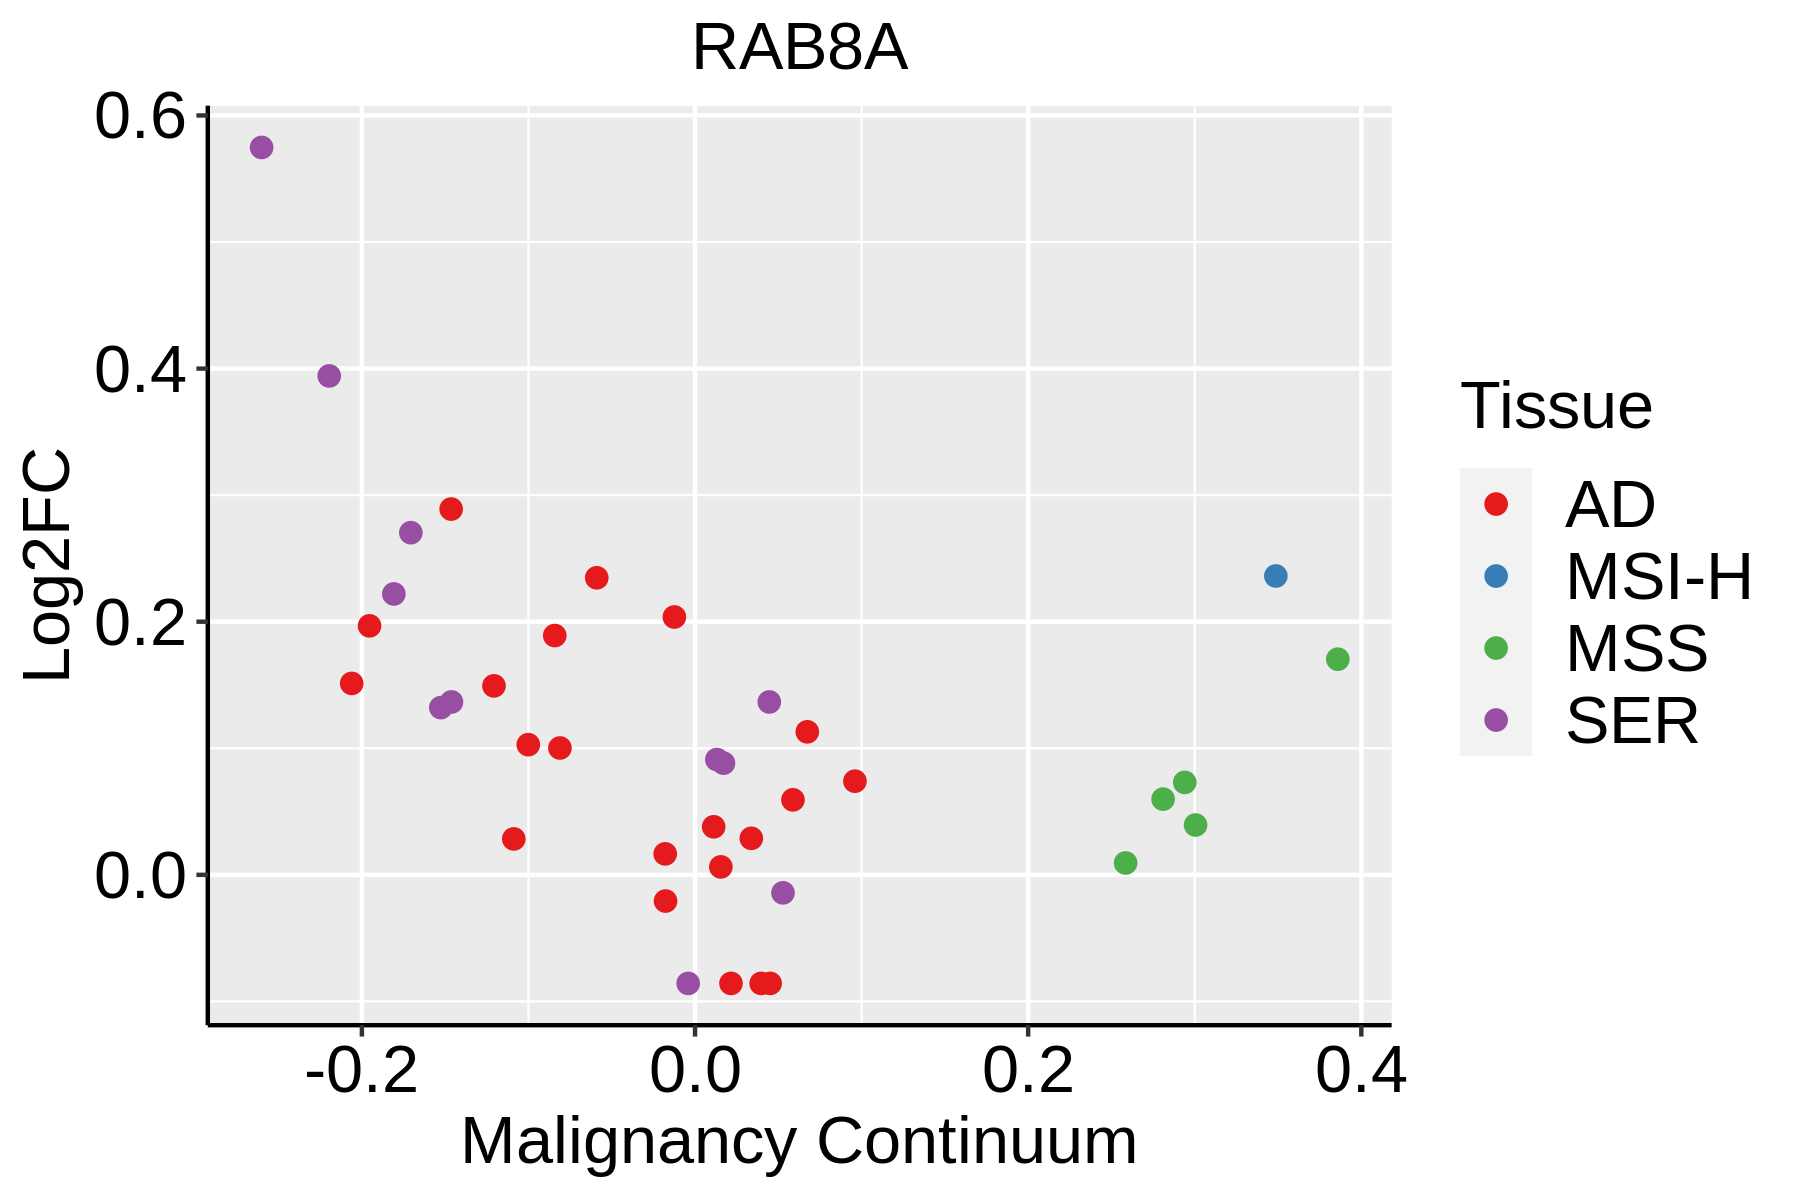 | AD: Adenomas |
| SER: Sessile serrated lesions | ||
| MSI-H: Microsatellite-high colorectal cancer | ||
| MSS: Microsatellite stable colorectal cancer | ||
| Esophagus | 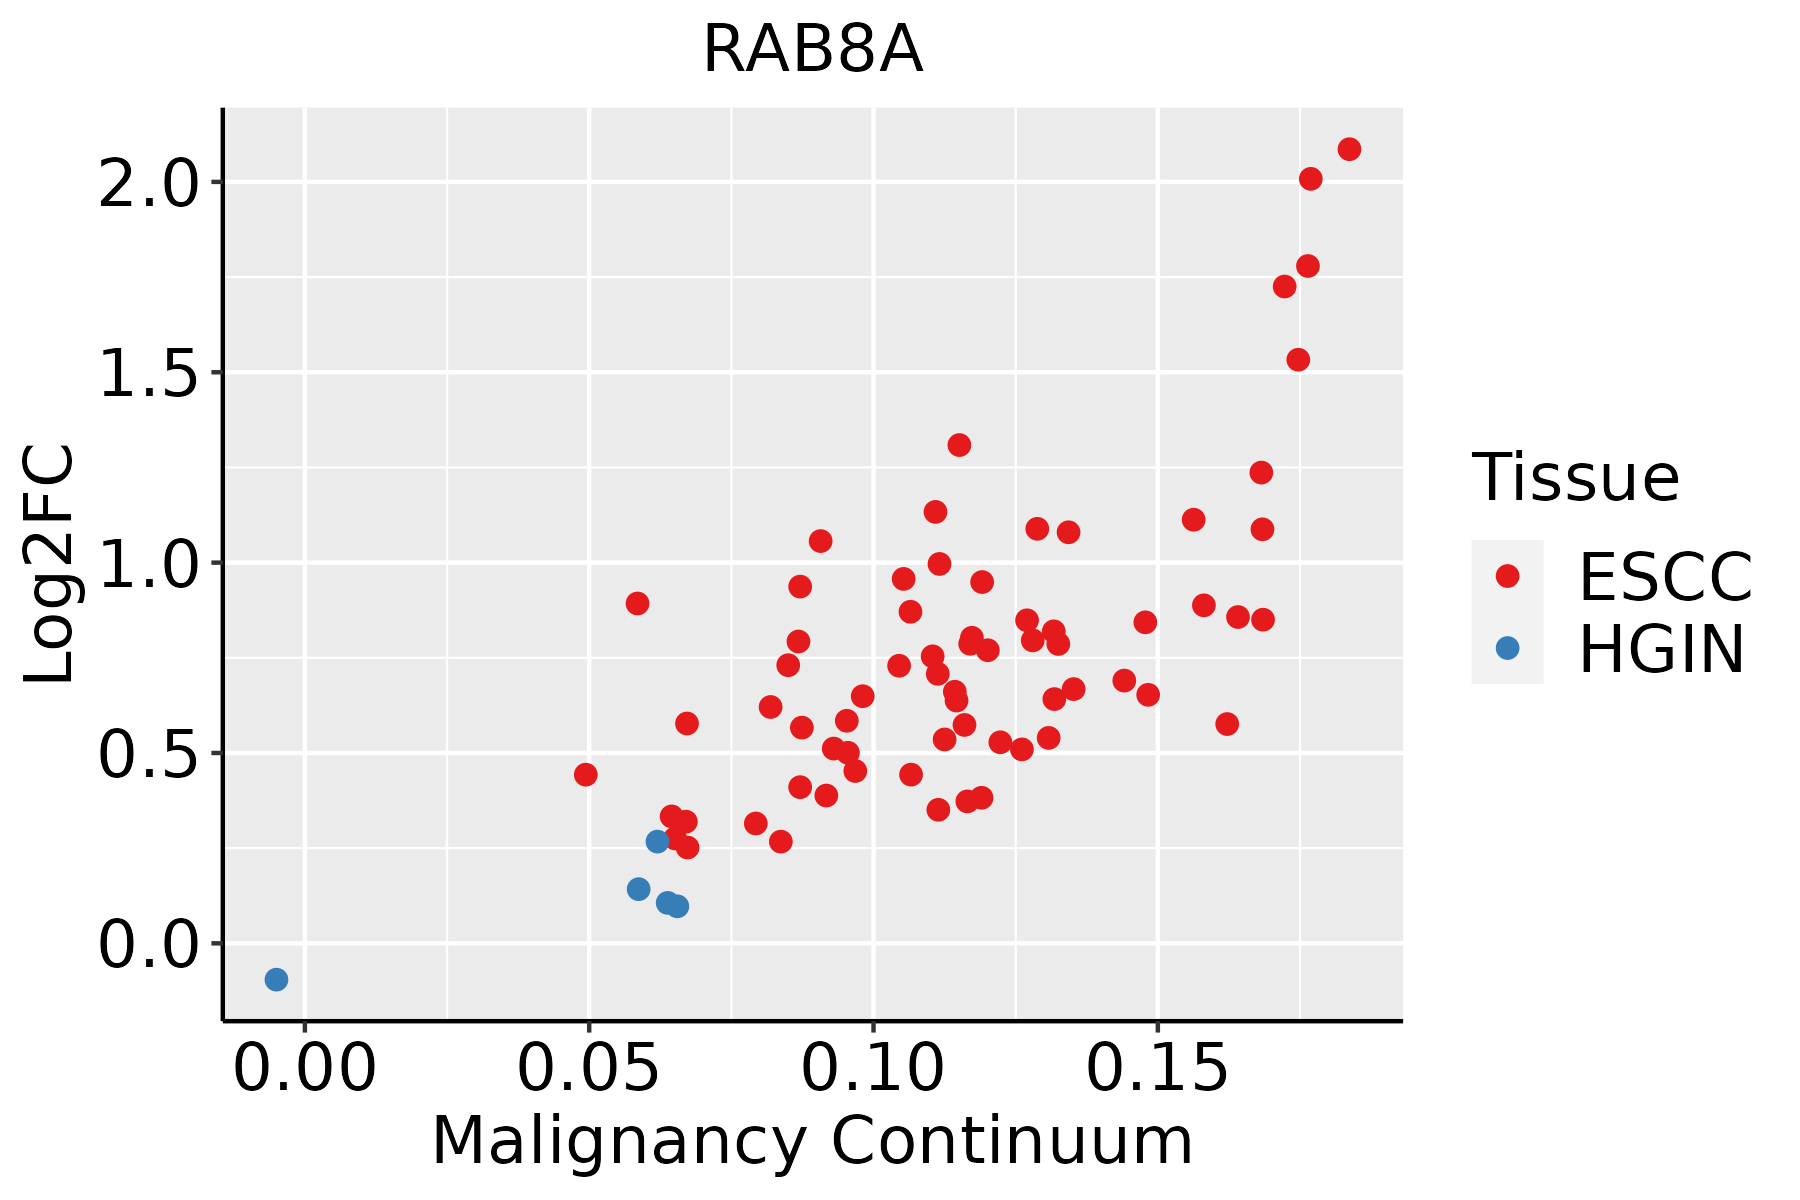 | ESCC: Esophageal squamous cell carcinoma |
| HGIN: High-grade intraepithelial neoplasias | ||
| LGIN: Low-grade intraepithelial neoplasias | ||
| Liver | 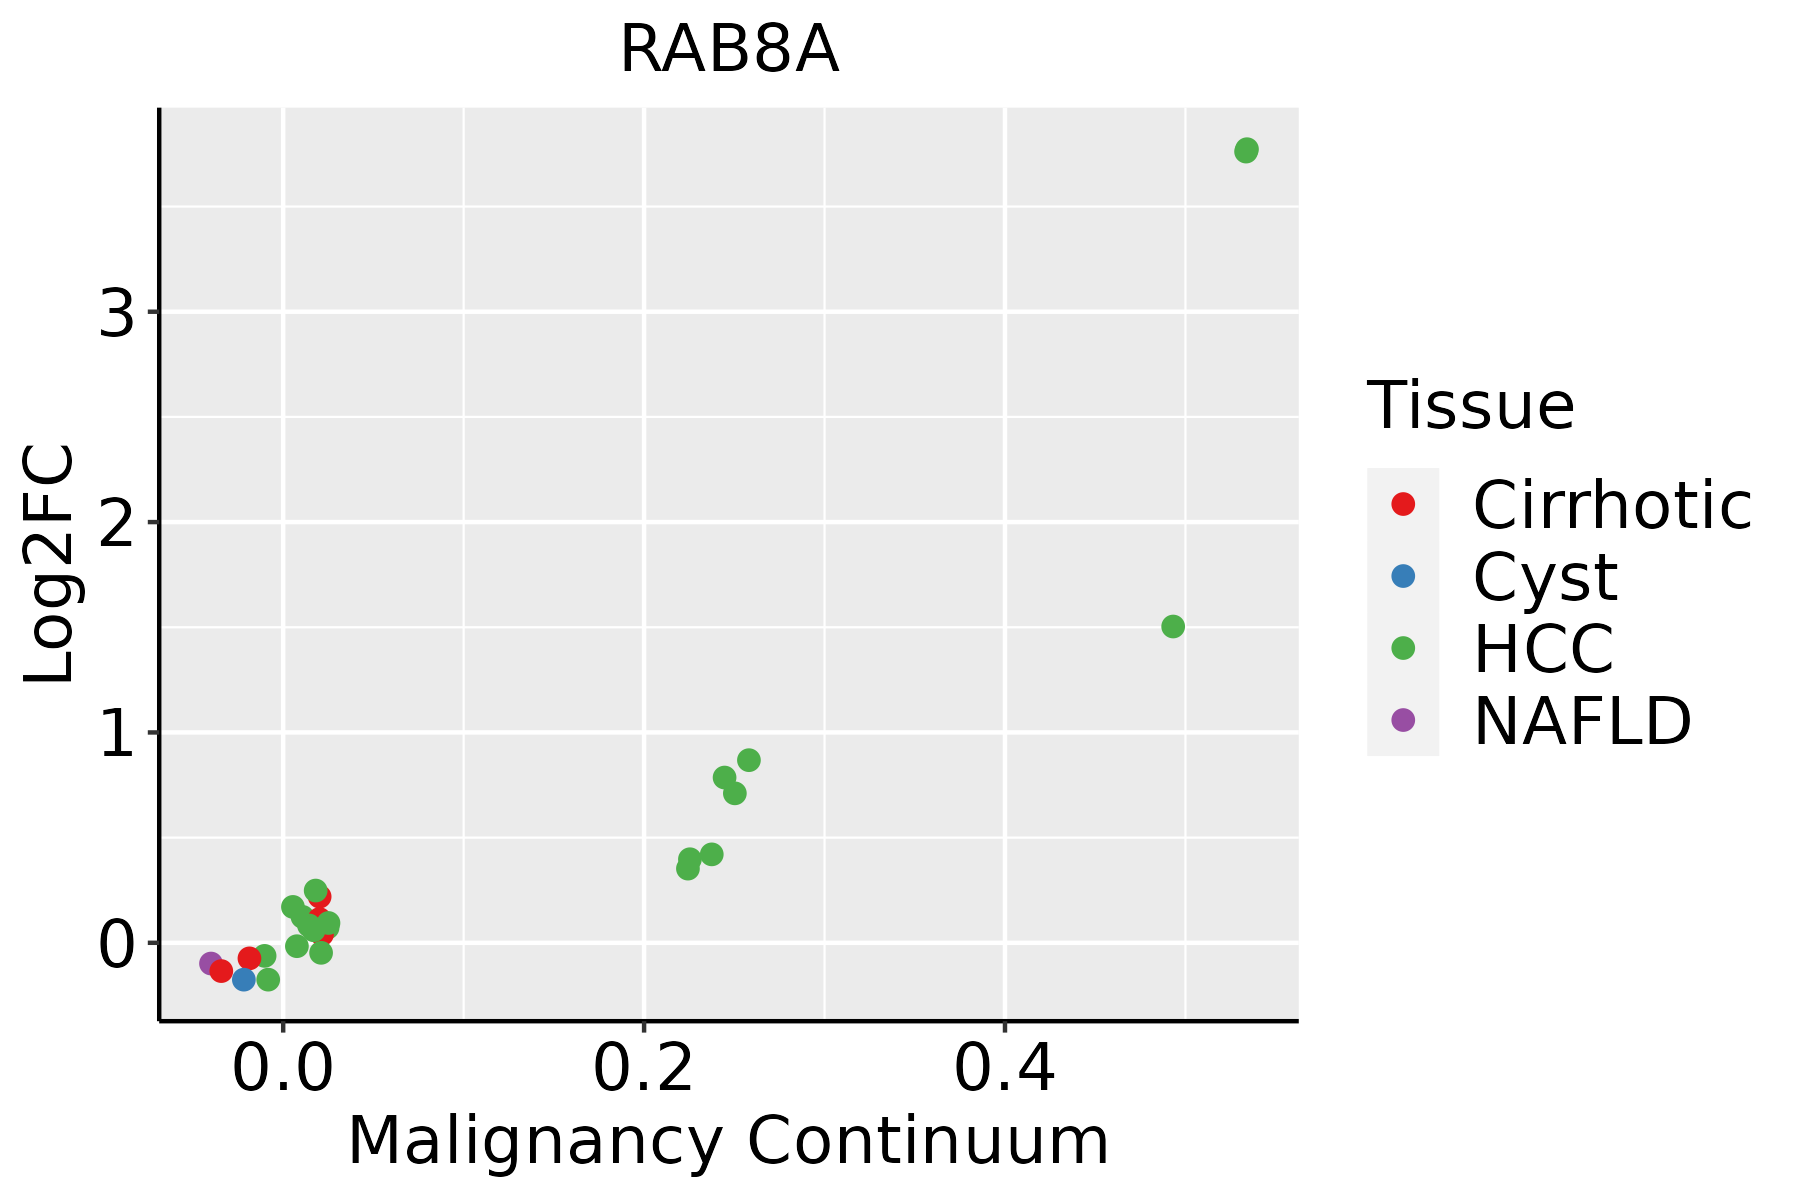 | HCC: Hepatocellular carcinoma |
| NAFLD: Non-alcoholic fatty liver disease | ||
| Oral Cavity | 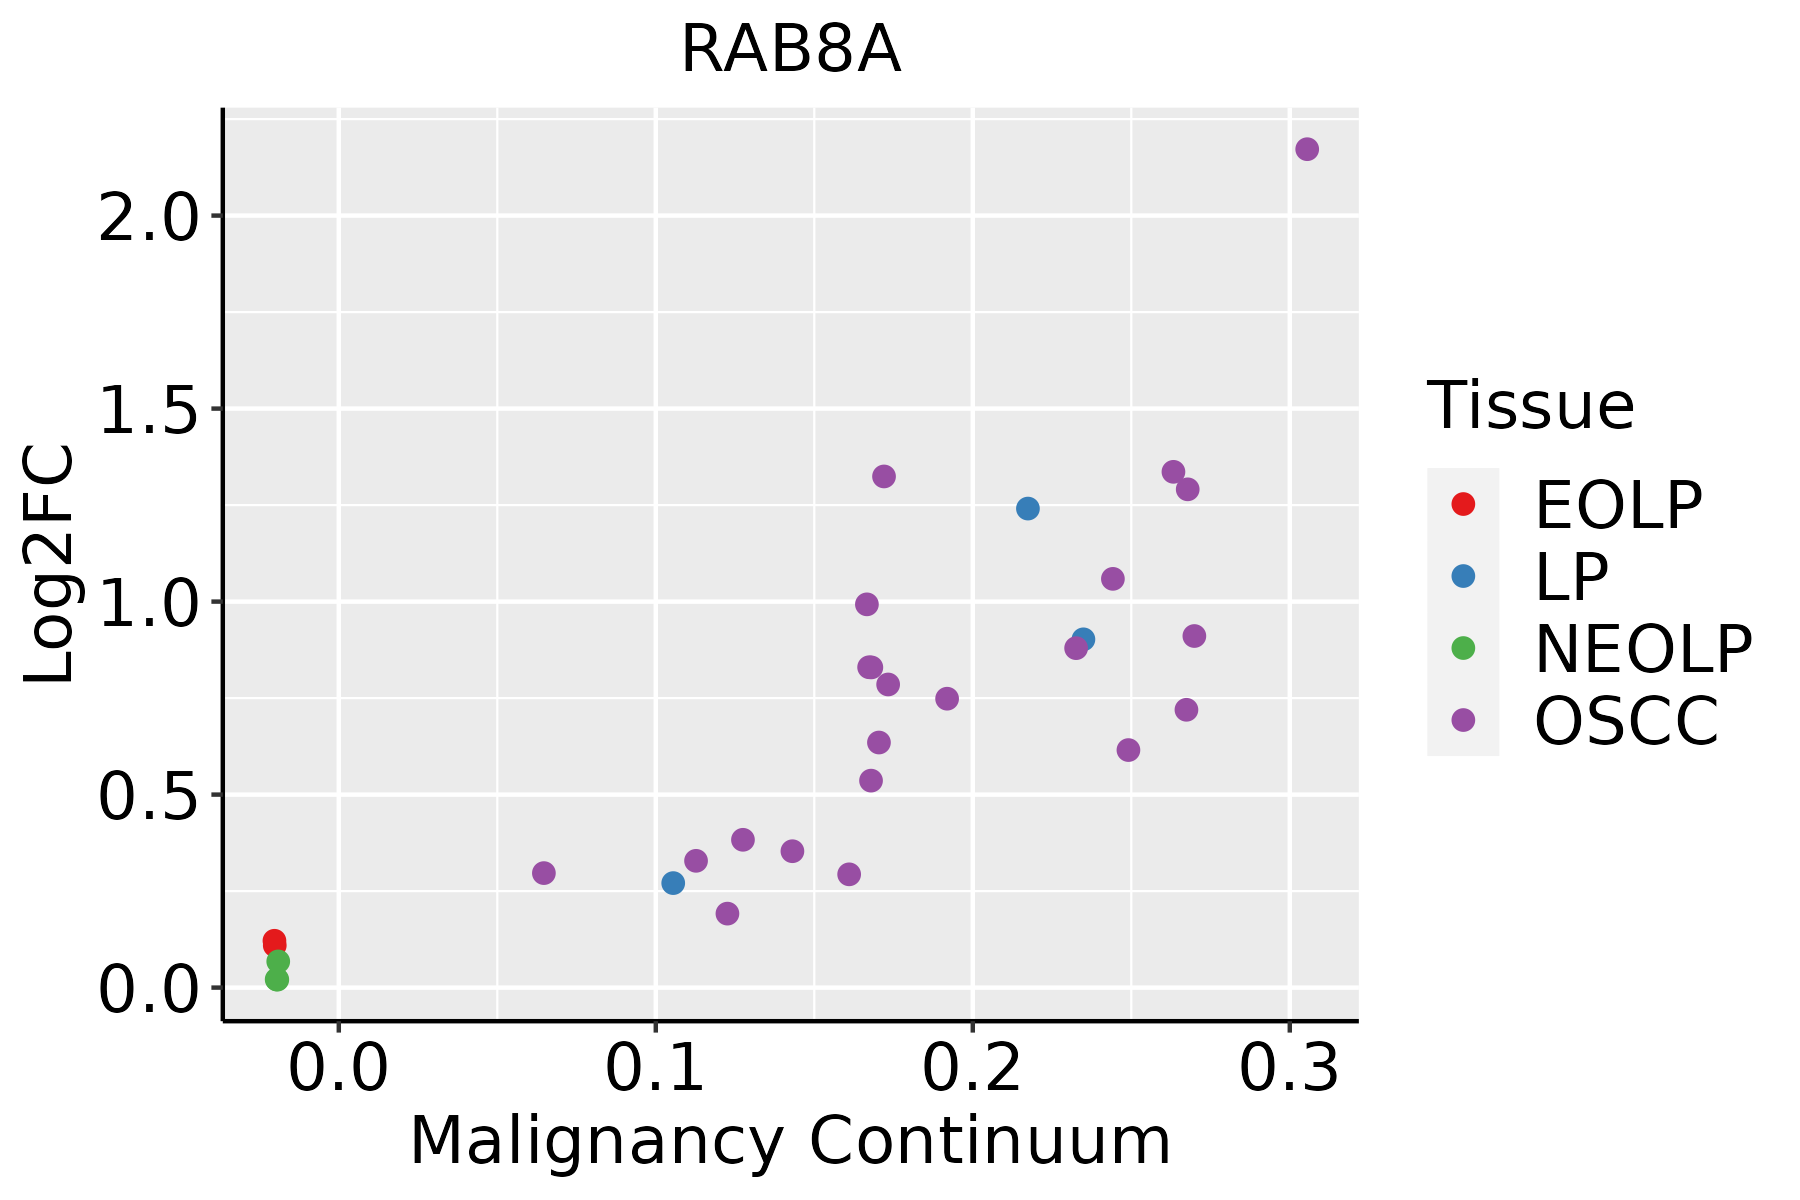 | EOLP: Erosive Oral lichen planus |
| LP: leukoplakia | ||
| NEOLP: Non-erosive oral lichen planus | ||
| OSCC: Oral squamous cell carcinoma | ||
| Skin | 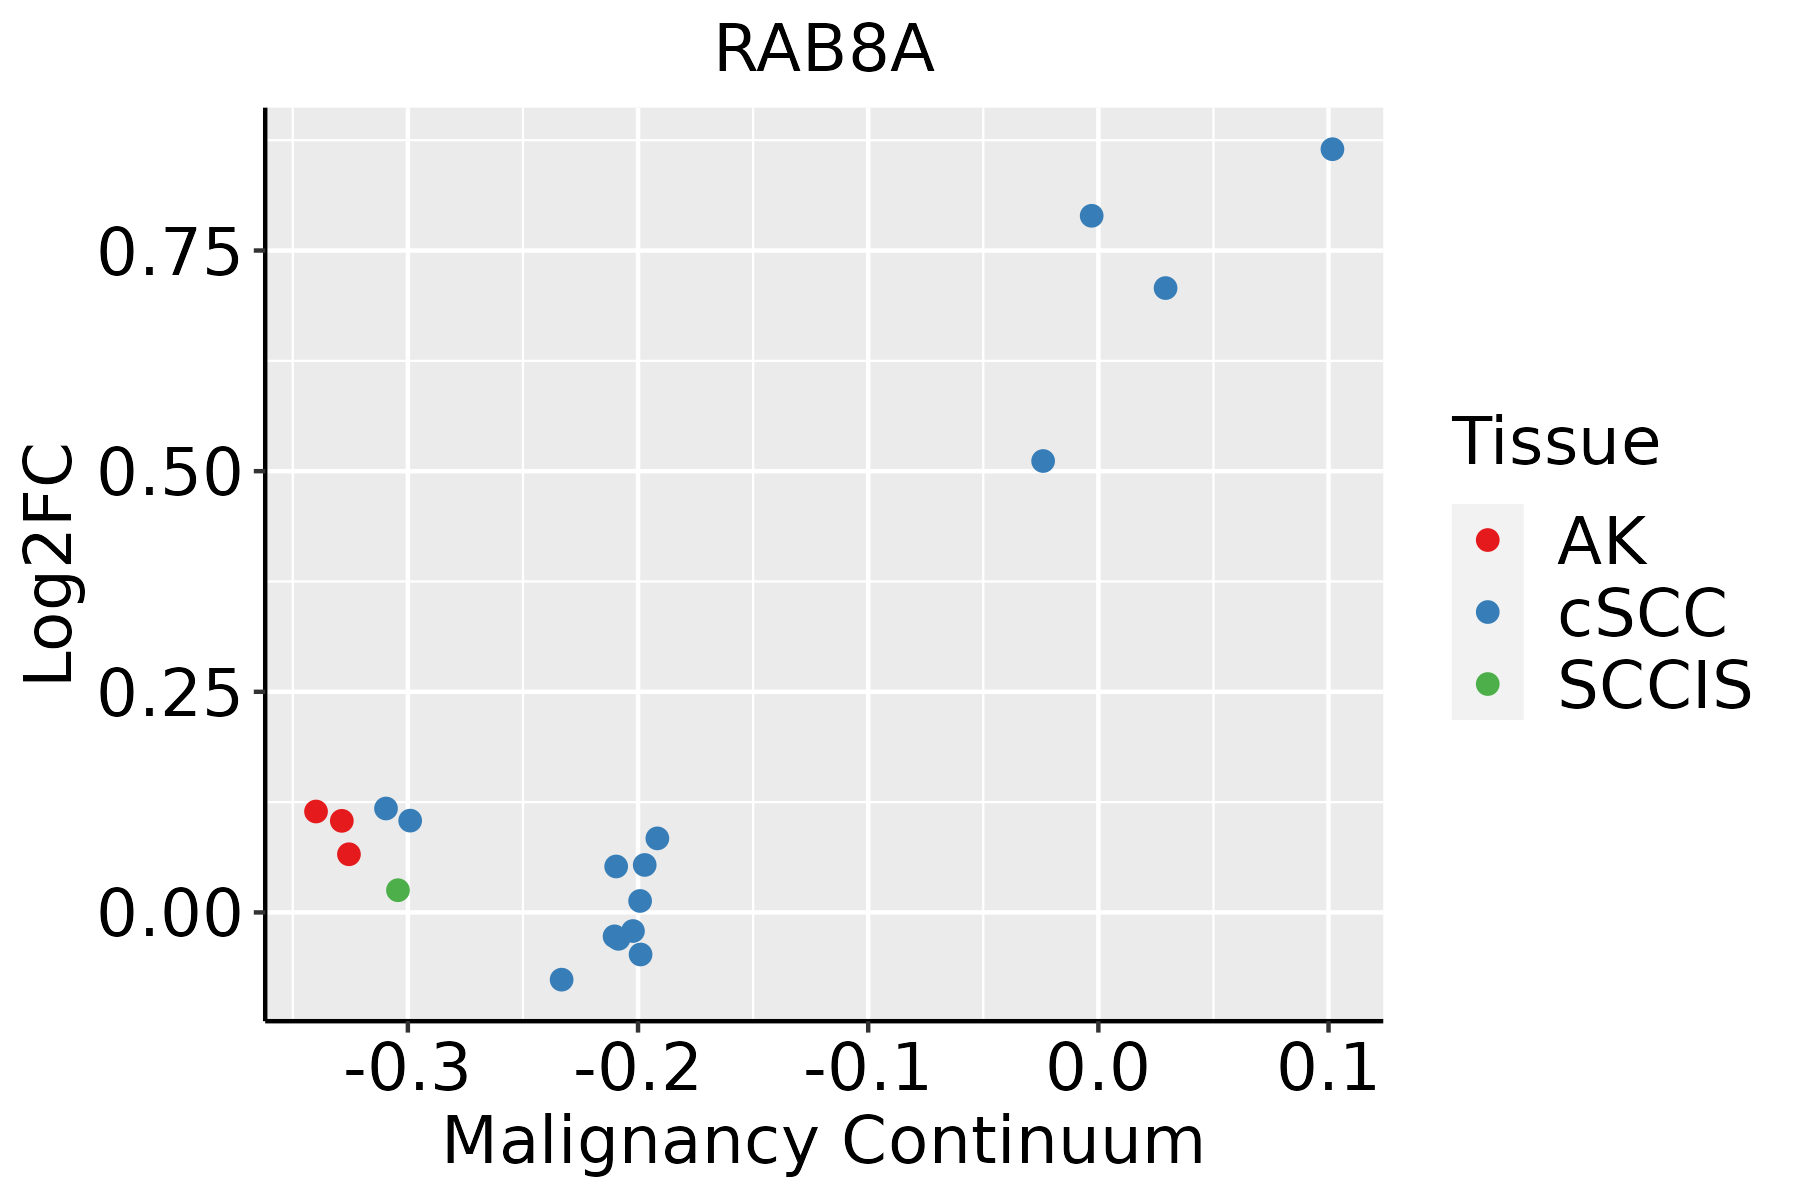 | AK: Actinic keratosis |
| cSCC: Cutaneous squamous cell carcinoma | ||
| SCCIS:squamous cell carcinoma in situ | ||
| Thyroid |  | ATC: Anaplastic thyroid cancer |
| HT: Hashimoto's thyroiditis | ||
| PTC: Papillary thyroid cancer |
| ∗log2FC in expression of this searched gene in stem-like cells from each diseased tissue sample relative to stem-like cells in normal samples in each tissue plotted against the malignancy continuum. Samples are colored based on if they are from different disease stage. |
Top |
Malignant transformation related pathway analysis |
| Find out the enriched GO biological processes and KEGG pathways involved in transition from healthy to precancer to cancer |
| Tissue | Disease Stage | Enriched GO biological Processes |
| Colorectum | AD |  |
| Colorectum | SER |  |
| Colorectum | MSS |  |
| Colorectum | MSI-H |  |
| Colorectum | FAP |  |
| ∗Top 15 enriched GO BP terms are showed in the bar plot of each disease state in each tissue. Each row represents a significant GO biological process which is colored according to the -log10(p.adjust). |
| Page: 1 2 3 4 5 6 7 8 9 |
| GO ID | Tissue | Disease Stage | Description | Gene Ratio | Bg Ratio | pvalue | p.adjust | Count |
| GO:0072659 | Colorectum | AD | protein localization to plasma membrane | 122/3918 | 284/18723 | 2.86e-17 | 1.49e-14 | 122 |
| GO:1990778 | Colorectum | AD | protein localization to cell periphery | 129/3918 | 333/18723 | 5.51e-14 | 1.15e-11 | 129 |
| GO:0090150 | Colorectum | AD | establishment of protein localization to membrane | 100/3918 | 260/18723 | 6.01e-11 | 6.33e-09 | 100 |
| GO:0048193 | Colorectum | AD | Golgi vesicle transport | 109/3918 | 296/18723 | 1.80e-10 | 1.68e-08 | 109 |
| GO:0016197 | Colorectum | AD | endosomal transport | 90/3918 | 230/18723 | 1.88e-10 | 1.73e-08 | 90 |
| GO:0010506 | Colorectum | AD | regulation of autophagy | 111/3918 | 317/18723 | 3.57e-09 | 2.35e-07 | 111 |
| GO:0098876 | Colorectum | AD | vesicle-mediated transport to the plasma membrane | 57/3918 | 136/18723 | 2.30e-08 | 1.27e-06 | 57 |
| GO:0061951 | Colorectum | AD | establishment of protein localization to plasma membrane | 31/3918 | 60/18723 | 1.37e-07 | 6.42e-06 | 31 |
| GO:0016050 | Colorectum | AD | vesicle organization | 101/3918 | 300/18723 | 1.65e-07 | 7.17e-06 | 101 |
| GO:0032868 | Colorectum | AD | response to insulin | 91/3918 | 264/18723 | 2.02e-07 | 8.48e-06 | 91 |
| GO:1901653 | Colorectum | AD | cellular response to peptide | 114/3918 | 359/18723 | 8.32e-07 | 2.88e-05 | 114 |
| GO:0032869 | Colorectum | AD | cellular response to insulin stimulus | 72/3918 | 203/18723 | 1.10e-06 | 3.68e-05 | 72 |
| GO:0071375 | Colorectum | AD | cellular response to peptide hormone stimulus | 95/3918 | 290/18723 | 1.50e-06 | 4.66e-05 | 95 |
| GO:0043434 | Colorectum | AD | response to peptide hormone | 126/3918 | 414/18723 | 2.70e-06 | 7.86e-05 | 126 |
| GO:0007409 | Colorectum | AD | axonogenesis | 122/3918 | 418/18723 | 3.36e-05 | 6.15e-04 | 122 |
| GO:0061564 | Colorectum | AD | axon development | 132/3918 | 467/18723 | 8.40e-05 | 1.31e-03 | 132 |
| GO:0009306 | Colorectum | AD | protein secretion | 105/3918 | 359/18723 | 1.05e-04 | 1.57e-03 | 105 |
| GO:0035592 | Colorectum | AD | establishment of protein localization to extracellular region | 105/3918 | 360/18723 | 1.18e-04 | 1.73e-03 | 105 |
| GO:0071692 | Colorectum | AD | protein localization to extracellular region | 106/3918 | 368/18723 | 1.86e-04 | 2.49e-03 | 106 |
| GO:0032456 | Colorectum | AD | endocytic recycling | 28/3918 | 73/18723 | 4.87e-04 | 5.30e-03 | 28 |
| Page: 1 2 3 4 5 6 7 8 9 10 11 12 13 |
| Pathway ID | Tissue | Disease Stage | Description | Gene Ratio | Bg Ratio | pvalue | p.adjust | qvalue | Count |
| hsa05014 | Colorectum | AD | Amyotrophic lateral sclerosis | 164/2092 | 364/8465 | 4.28e-18 | 1.27e-16 | 8.09e-17 | 164 |
| hsa05022 | Colorectum | AD | Pathways of neurodegeneration - multiple diseases | 201/2092 | 476/8465 | 4.54e-18 | 1.27e-16 | 8.09e-17 | 201 |
| hsa04144 | Colorectum | AD | Endocytosis | 111/2092 | 251/8465 | 5.95e-12 | 1.42e-10 | 9.08e-11 | 111 |
| hsa04530 | Colorectum | AD | Tight junction | 76/2092 | 169/8465 | 5.49e-09 | 9.69e-08 | 6.18e-08 | 76 |
| hsa04152 | Colorectum | AD | AMPK signaling pathway | 47/2092 | 121/8465 | 3.74e-04 | 2.82e-03 | 1.80e-03 | 47 |
| hsa04140 | Colorectum | AD | Autophagy - animal | 49/2092 | 141/8465 | 4.58e-03 | 2.20e-02 | 1.40e-02 | 49 |
| hsa050141 | Colorectum | AD | Amyotrophic lateral sclerosis | 164/2092 | 364/8465 | 4.28e-18 | 1.27e-16 | 8.09e-17 | 164 |
| hsa050221 | Colorectum | AD | Pathways of neurodegeneration - multiple diseases | 201/2092 | 476/8465 | 4.54e-18 | 1.27e-16 | 8.09e-17 | 201 |
| hsa041441 | Colorectum | AD | Endocytosis | 111/2092 | 251/8465 | 5.95e-12 | 1.42e-10 | 9.08e-11 | 111 |
| hsa045301 | Colorectum | AD | Tight junction | 76/2092 | 169/8465 | 5.49e-09 | 9.69e-08 | 6.18e-08 | 76 |
| hsa041521 | Colorectum | AD | AMPK signaling pathway | 47/2092 | 121/8465 | 3.74e-04 | 2.82e-03 | 1.80e-03 | 47 |
| hsa041401 | Colorectum | AD | Autophagy - animal | 49/2092 | 141/8465 | 4.58e-03 | 2.20e-02 | 1.40e-02 | 49 |
| hsa0501430 | Esophagus | HGIN | Amyotrophic lateral sclerosis | 140/1383 | 364/8465 | 2.13e-25 | 1.16e-23 | 9.19e-24 | 140 |
| hsa0502230 | Esophagus | HGIN | Pathways of neurodegeneration - multiple diseases | 153/1383 | 476/8465 | 1.22e-18 | 4.41e-17 | 3.50e-17 | 153 |
| hsa0414429 | Esophagus | HGIN | Endocytosis | 76/1383 | 251/8465 | 1.74e-08 | 3.34e-07 | 2.65e-07 | 76 |
| hsa0453039 | Esophagus | HGIN | Tight junction | 40/1383 | 169/8465 | 8.18e-03 | 4.71e-02 | 3.74e-02 | 40 |
| hsa05014113 | Esophagus | HGIN | Amyotrophic lateral sclerosis | 140/1383 | 364/8465 | 2.13e-25 | 1.16e-23 | 9.19e-24 | 140 |
| hsa05022113 | Esophagus | HGIN | Pathways of neurodegeneration - multiple diseases | 153/1383 | 476/8465 | 1.22e-18 | 4.41e-17 | 3.50e-17 | 153 |
| hsa04144113 | Esophagus | HGIN | Endocytosis | 76/1383 | 251/8465 | 1.74e-08 | 3.34e-07 | 2.65e-07 | 76 |
| hsa04530115 | Esophagus | HGIN | Tight junction | 40/1383 | 169/8465 | 8.18e-03 | 4.71e-02 | 3.74e-02 | 40 |
| Page: 1 2 3 4 |
Top |
Cell-cell communication analysis |
| Identification of potential cell-cell interactions between two cell types and their ligand-receptor pairs for different disease states |
| Ligand | Receptor | LRpair | Pathway | Tissue | Disease Stage |
| Page: 1 |
Top |
Single-cell gene regulatory network inference analysis |
| Find out the significant the regulons (TFs) and the target genes of each regulon across cell types for different disease states |
| TF | Cell Type | Tissue | Disease Stage | Target Gene | RSS | Regulon Activity |
| ∗The dot plots of a searched regulon are shown for all cell subpopulations in each disease state of each tissue based on the regulon specific score inferred using pySCENIC and by calculating the average expression. |
| Page: 1 |
Top |
Somatic mutation of malignant transformation related genes |
| Annotation of somatic variants for genes involved in malignant transformation |
| Hugo Symbol | Variant Class | Variant Classification | dbSNP RS | HGVSc | HGVSp | HGVSp Short | SWISSPROT | BIOTYPE | SIFT | PolyPhen | Tumor Sample Barcode | Tissue | Histology | Sex | Age | Stage | Therapy Types | Drugs | Outcome |
| RAB8A | SNV | Missense_Mutation | c.99N>G | p.Phe33Leu | p.F33L | P61006 | protein_coding | deleterious(0.03) | benign(0.254) | TCGA-5L-AAT1-01 | Breast | breast invasive carcinoma | Female | <65 | III/IV | Hormone Therapy | letrozol | SD | |
| RAB8A | SNV | Missense_Mutation | c.157N>A | p.Asp53Asn | p.D53N | P61006 | protein_coding | tolerated(0.08) | benign(0.319) | TCGA-C5-A1BQ-01 | Cervix | cervical & endocervical cancer | Female | >=65 | III/IV | Chemotherapy | cisplatin | CR | |
| RAB8A | SNV | Missense_Mutation | c.114C>G | p.Ile38Met | p.I38M | P61006 | protein_coding | deleterious(0) | possibly_damaging(0.752) | TCGA-IR-A3LH-01 | Cervix | cervical & endocervical cancer | Female | <65 | I/II | Chemotherapy | cisplatin | CR | |
| RAB8A | SNV | Missense_Mutation | c.272C>T | p.Thr91Ile | p.T91I | P61006 | protein_coding | deleterious(0) | probably_damaging(0.968) | TCGA-AZ-6599-01 | Colorectum | colon adenocarcinoma | Male | >=65 | I/II | Unknown | Unknown | SD | |
| RAB8A | SNV | Missense_Mutation | novel | c.332C>A | p.Ser111Tyr | p.S111Y | P61006 | protein_coding | deleterious(0) | probably_damaging(0.997) | TCGA-A5-A0G1-01 | Endometrium | uterine corpus endometrioid carcinoma | Female | >=65 | I/II | Unknown | Unknown | SD |
| RAB8A | SNV | Missense_Mutation | novel | c.310C>T | p.Arg104Cys | p.R104C | P61006 | protein_coding | deleterious(0) | probably_damaging(0.998) | TCGA-AJ-A3BH-01 | Endometrium | uterine corpus endometrioid carcinoma | Female | Unknown | I/II | Unknown | Unknown | SD |
| RAB8A | SNV | Missense_Mutation | novel | c.310C>T | p.Arg104Cys | p.R104C | P61006 | protein_coding | deleterious(0) | probably_damaging(0.998) | TCGA-AJ-A3EL-01 | Endometrium | uterine corpus endometrioid carcinoma | Female | <65 | I/II | Unknown | Unknown | SD |
| RAB8A | SNV | Missense_Mutation | novel | c.38N>C | p.Leu13Pro | p.L13P | P61006 | protein_coding | deleterious(0.02) | probably_damaging(1) | TCGA-AJ-A3OL-01 | Endometrium | uterine corpus endometrioid carcinoma | Female | <65 | III/IV | Chemotherapy | carboplatin | PD |
| RAB8A | SNV | Missense_Mutation | c.455C>T | p.Ala152Val | p.A152V | P61006 | protein_coding | deleterious(0) | probably_damaging(1) | TCGA-AP-A0LM-01 | Endometrium | uterine corpus endometrioid carcinoma | Female | <65 | III/IV | Chemotherapy | cisplatin | SD | |
| RAB8A | SNV | Missense_Mutation | c.493C>T | p.Leu165Phe | p.L165F | P61006 | protein_coding | deleterious(0) | probably_damaging(0.979) | TCGA-AP-A0LM-01 | Endometrium | uterine corpus endometrioid carcinoma | Female | <65 | III/IV | Chemotherapy | cisplatin | SD |
| Page: 1 2 3 |
Top |
Related drugs of malignant transformation related genes |
| Identification of chemicals and drugs interact with genes involved in malignant transfromation |
| (DGIdb 4.0) |
| Entrez ID | Symbol | Category | Interaction Types | Drug Claim Name | Drug Name | PMIDs |
| Page: 1 |

Copyright 2023-Present -The University of Texas Health Science Center at Houston |