
|
|||||
|
 | |
| |
| |
| |
| |
| |
|
Gene: RAB7A |
Gene summary for RAB7A |
| Gene information | Species | Human | Gene symbol | RAB7A | Gene ID | 7879 |
| Gene name | RAB7A, member RAS oncogene family | |
| Gene Alias | CMT2B | |
| Cytomap | 3q21.3 | |
| Gene Type | protein-coding | GO ID | GO:0000045 | UniProtAcc | A0A158RFU6 |
Top |
Malignant transformation analysis |
| Identification of the aberrant gene expression in precancerous and cancerous lesions by comparing the gene expression of stem-like cells in diseased tissues with normal stem cells |
| Entrez ID | Symbol | Replicates | Species | Organ | Tissue | Adj P-value | Log2FC | Malignancy |
| 7879 | RAB7A | GSM4909286 | Human | Breast | IDC | 3.08e-05 | -2.51e-01 | 0.1081 |
| 7879 | RAB7A | GSM4909288 | Human | Breast | IDC | 6.53e-05 | -4.60e-01 | 0.0988 |
| 7879 | RAB7A | GSM4909294 | Human | Breast | IDC | 1.55e-11 | -3.55e-01 | 0.2022 |
| 7879 | RAB7A | GSM4909296 | Human | Breast | IDC | 5.61e-25 | -4.04e-01 | 0.1524 |
| 7879 | RAB7A | GSM4909297 | Human | Breast | IDC | 1.65e-23 | -1.31e-01 | 0.1517 |
| 7879 | RAB7A | GSM4909301 | Human | Breast | IDC | 1.09e-07 | -3.02e-01 | 0.1577 |
| 7879 | RAB7A | GSM4909302 | Human | Breast | IDC | 3.98e-05 | -3.34e-01 | 0.1545 |
| 7879 | RAB7A | GSM4909307 | Human | Breast | IDC | 9.83e-06 | -3.24e-01 | 0.1569 |
| 7879 | RAB7A | GSM4909309 | Human | Breast | IDC | 3.23e-02 | -2.58e-01 | 0.0483 |
| 7879 | RAB7A | GSM4909311 | Human | Breast | IDC | 6.49e-45 | -5.42e-01 | 0.1534 |
| 7879 | RAB7A | GSM4909312 | Human | Breast | IDC | 3.16e-18 | -1.62e-01 | 0.1552 |
| 7879 | RAB7A | GSM4909315 | Human | Breast | IDC | 1.66e-02 | -2.66e-01 | 0.21 |
| 7879 | RAB7A | GSM4909319 | Human | Breast | IDC | 1.10e-42 | -4.85e-01 | 0.1563 |
| 7879 | RAB7A | GSM4909320 | Human | Breast | IDC | 5.40e-11 | -5.30e-01 | 0.1575 |
| 7879 | RAB7A | GSM4909321 | Human | Breast | IDC | 2.72e-20 | -2.64e-01 | 0.1559 |
| 7879 | RAB7A | brca1 | Human | Breast | Precancer | 1.51e-07 | 4.08e-01 | -0.0338 |
| 7879 | RAB7A | brca2 | Human | Breast | Precancer | 1.83e-09 | 3.75e-01 | -0.024 |
| 7879 | RAB7A | brca3 | Human | Breast | Precancer | 1.09e-10 | 4.07e-01 | -0.0263 |
| 7879 | RAB7A | M1 | Human | Breast | IDC | 2.47e-05 | -4.19e-01 | 0.1577 |
| 7879 | RAB7A | NCCBC14 | Human | Breast | DCIS | 1.38e-12 | -9.21e-02 | 0.2021 |
| Page: 1 2 3 4 5 6 7 8 9 10 11 12 13 14 |
| Tissue | Expression Dynamics | Abbreviation |
| Breast | 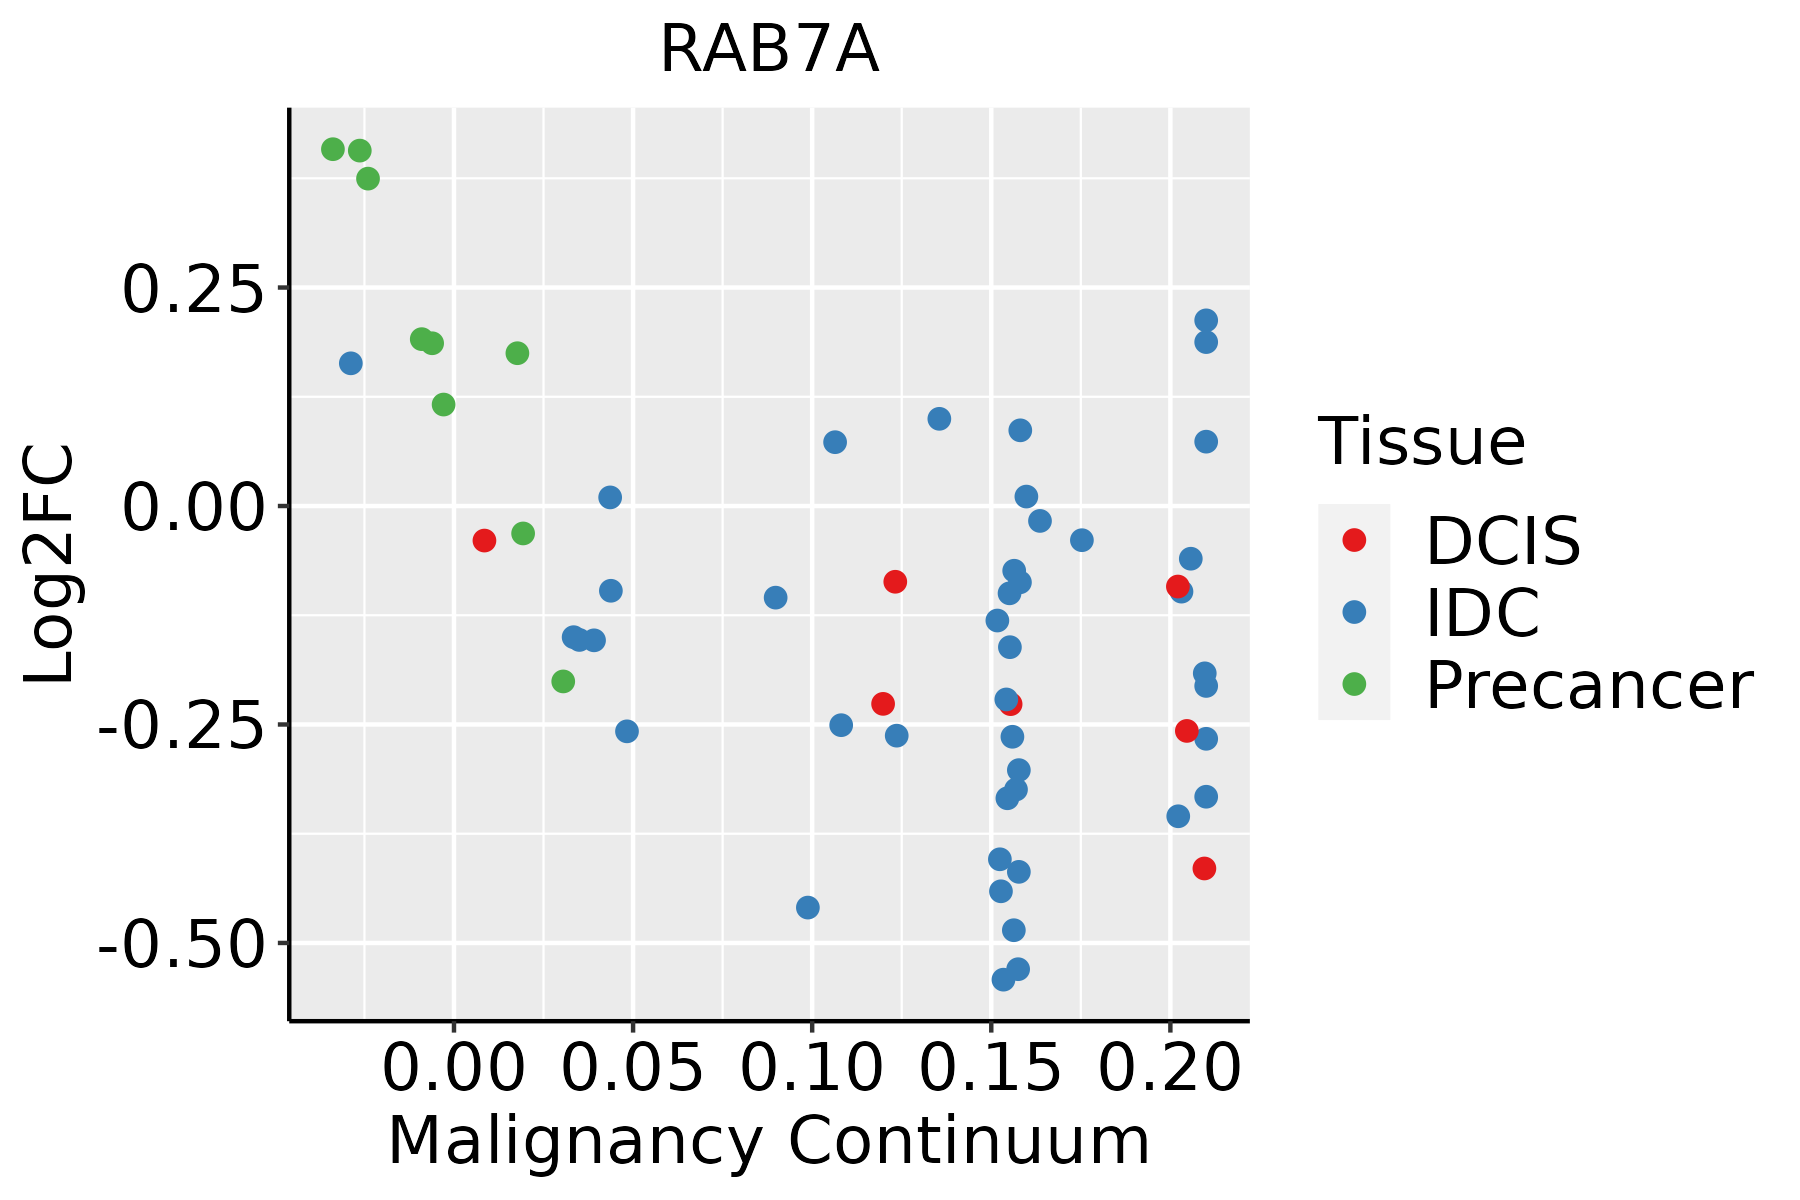 | IDC: Invasive ductal carcinoma |
| DCIS: Ductal carcinoma in situ | ||
| Precancer(BRCA1-mut): Precancerous lesion from BRCA1 mutation carriers | ||
| Cervix | 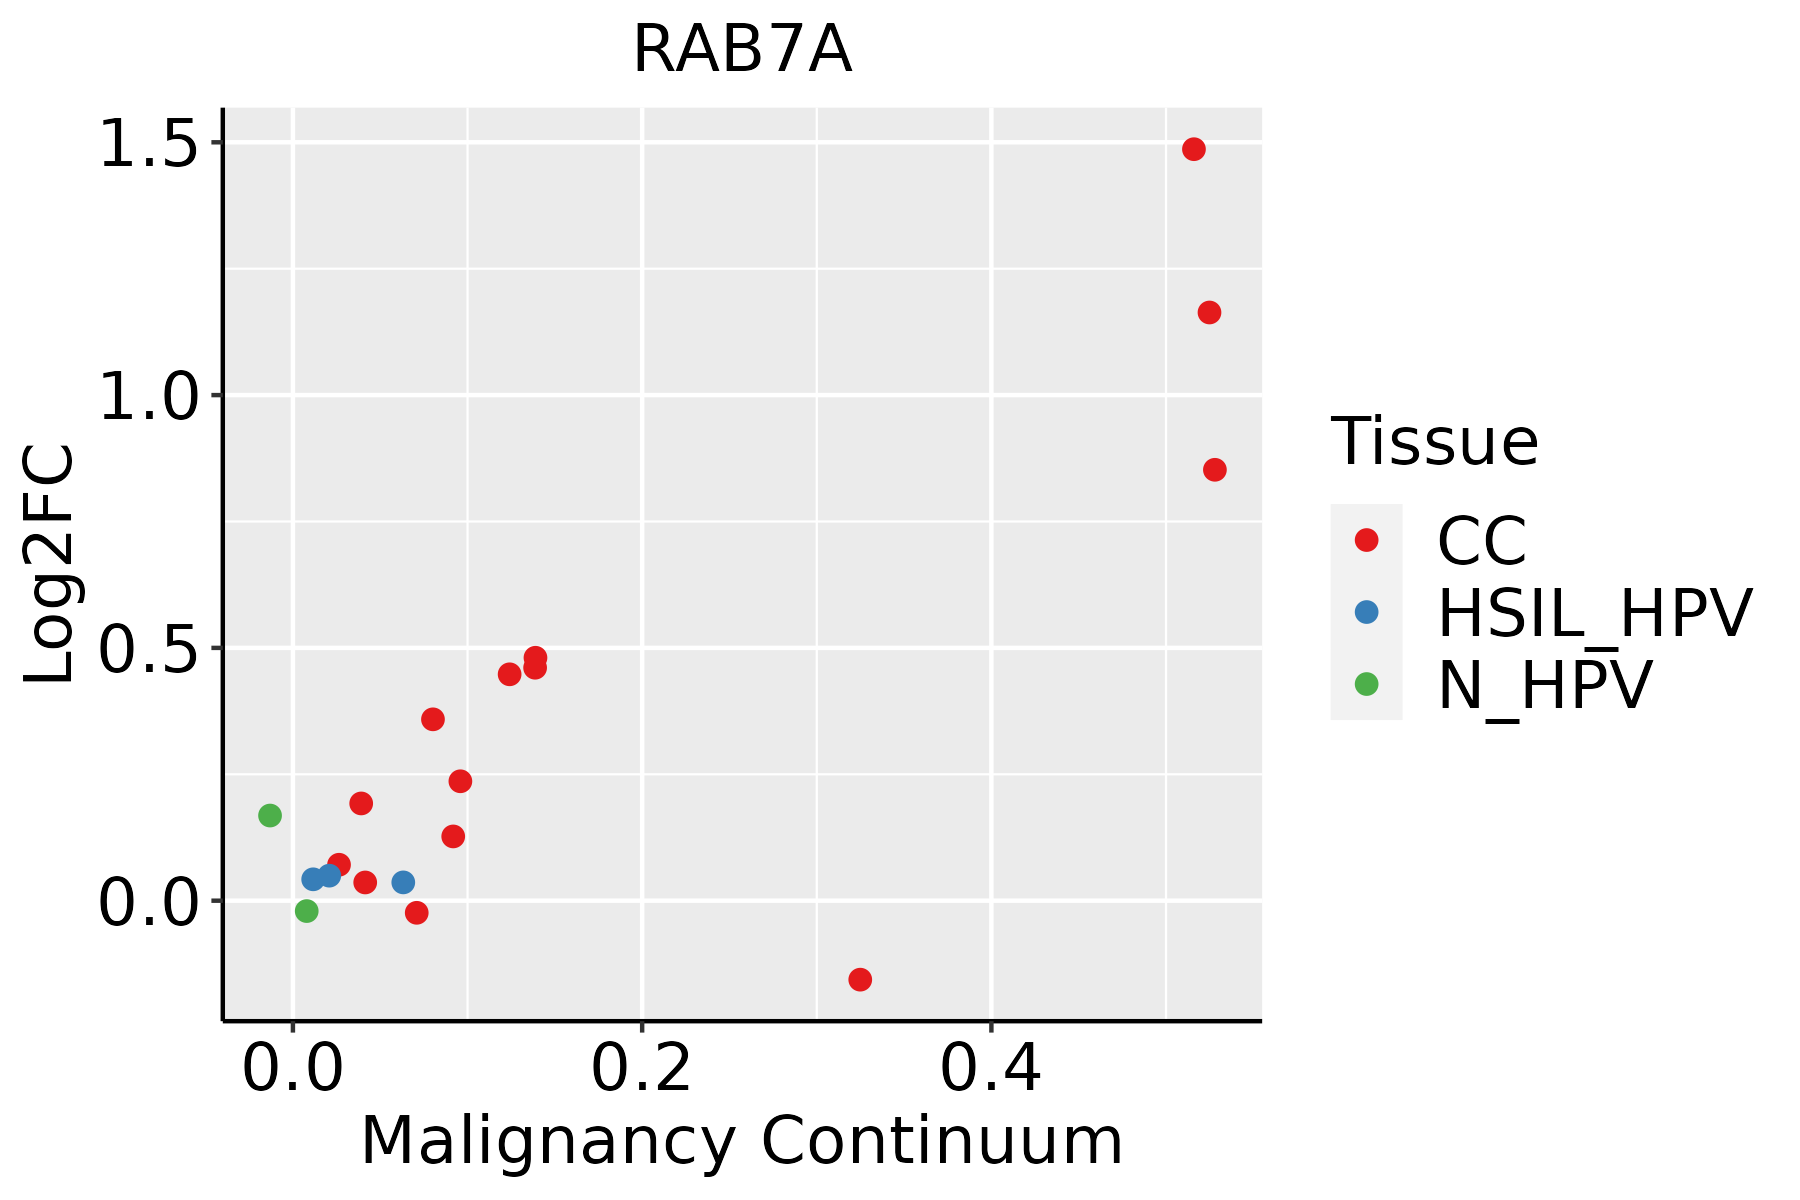 | CC: Cervix cancer |
| HSIL_HPV: HPV-infected high-grade squamous intraepithelial lesions | ||
| N_HPV: HPV-infected normal cervix | ||
| Colorectum (GSE201348) |  | FAP: Familial adenomatous polyposis |
| CRC: Colorectal cancer | ||
| Colorectum (HTA11) |  | AD: Adenomas |
| SER: Sessile serrated lesions | ||
| MSI-H: Microsatellite-high colorectal cancer | ||
| MSS: Microsatellite stable colorectal cancer | ||
| Endometrium | 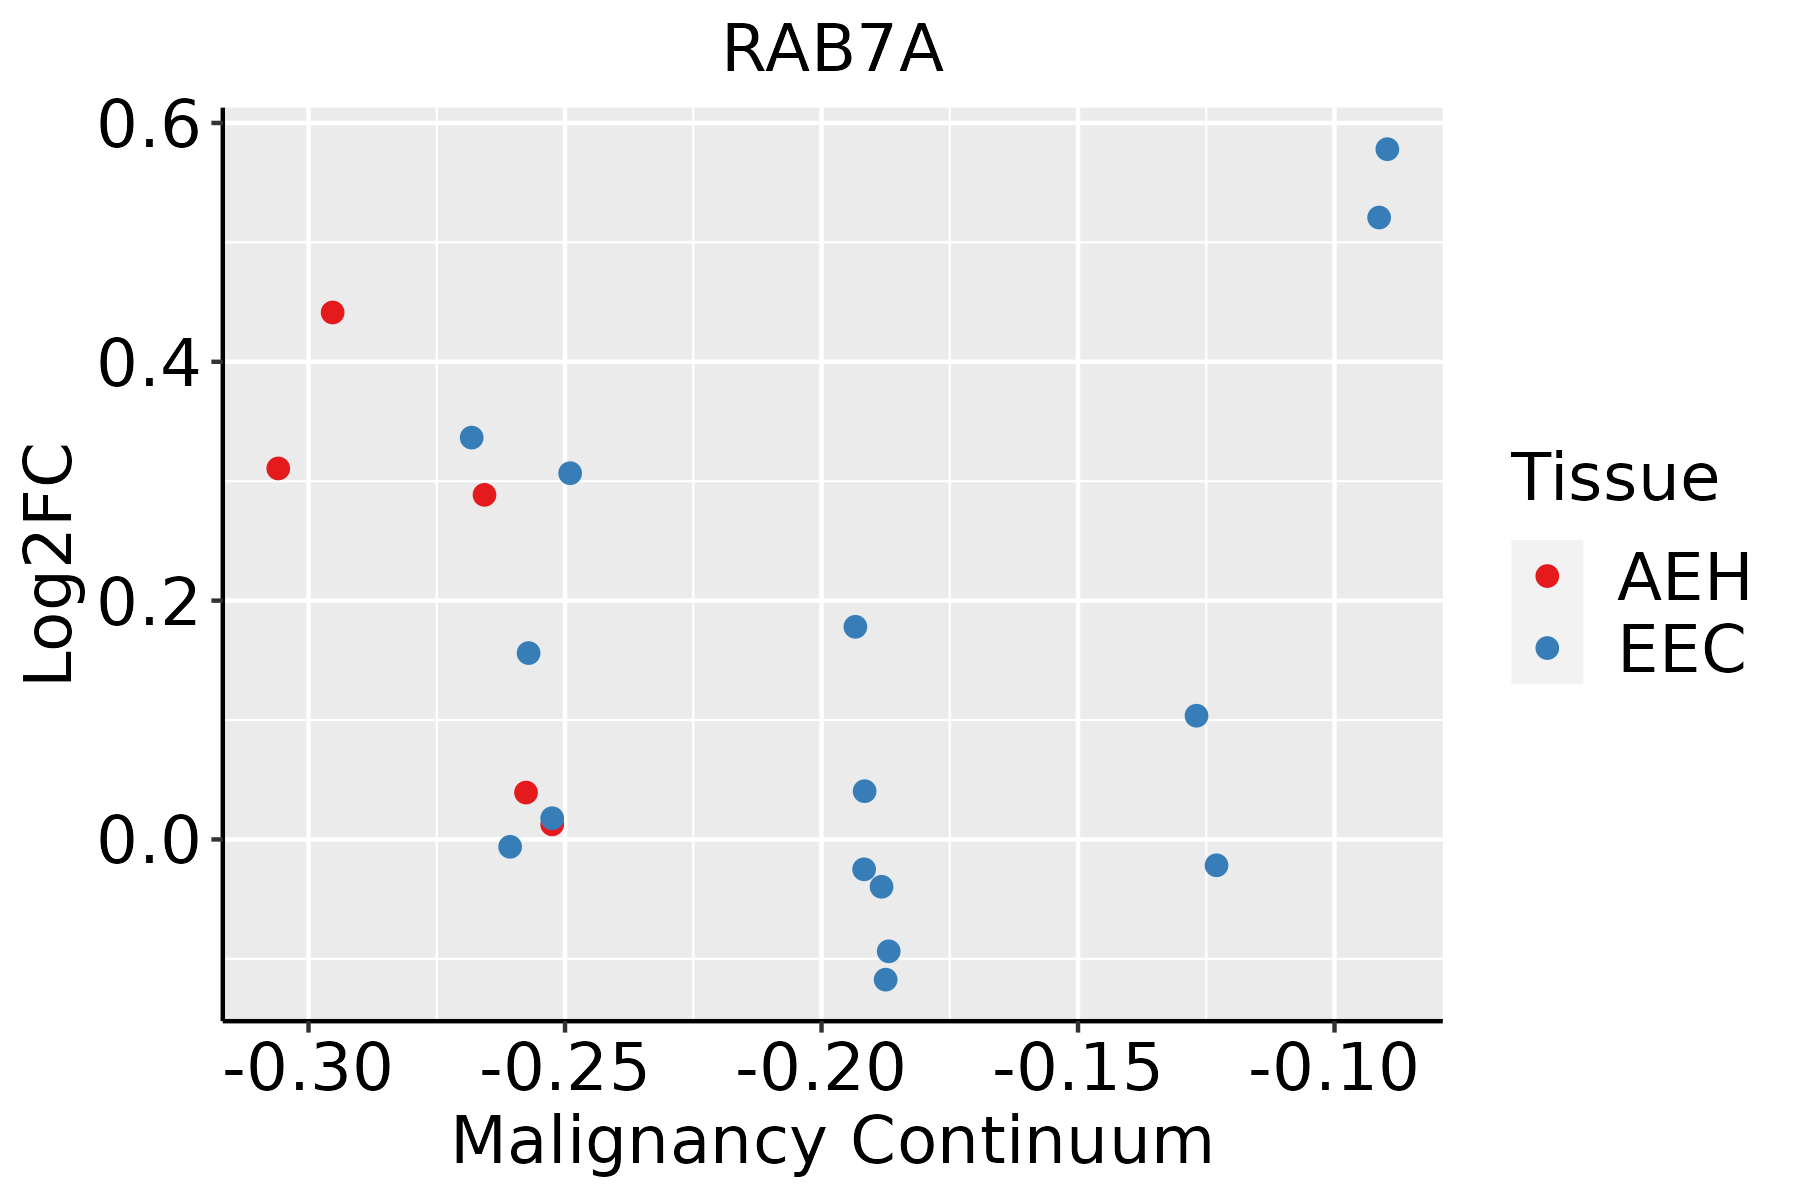 | AEH: Atypical endometrial hyperplasia |
| EEC: Endometrioid Cancer | ||
| Esophagus | 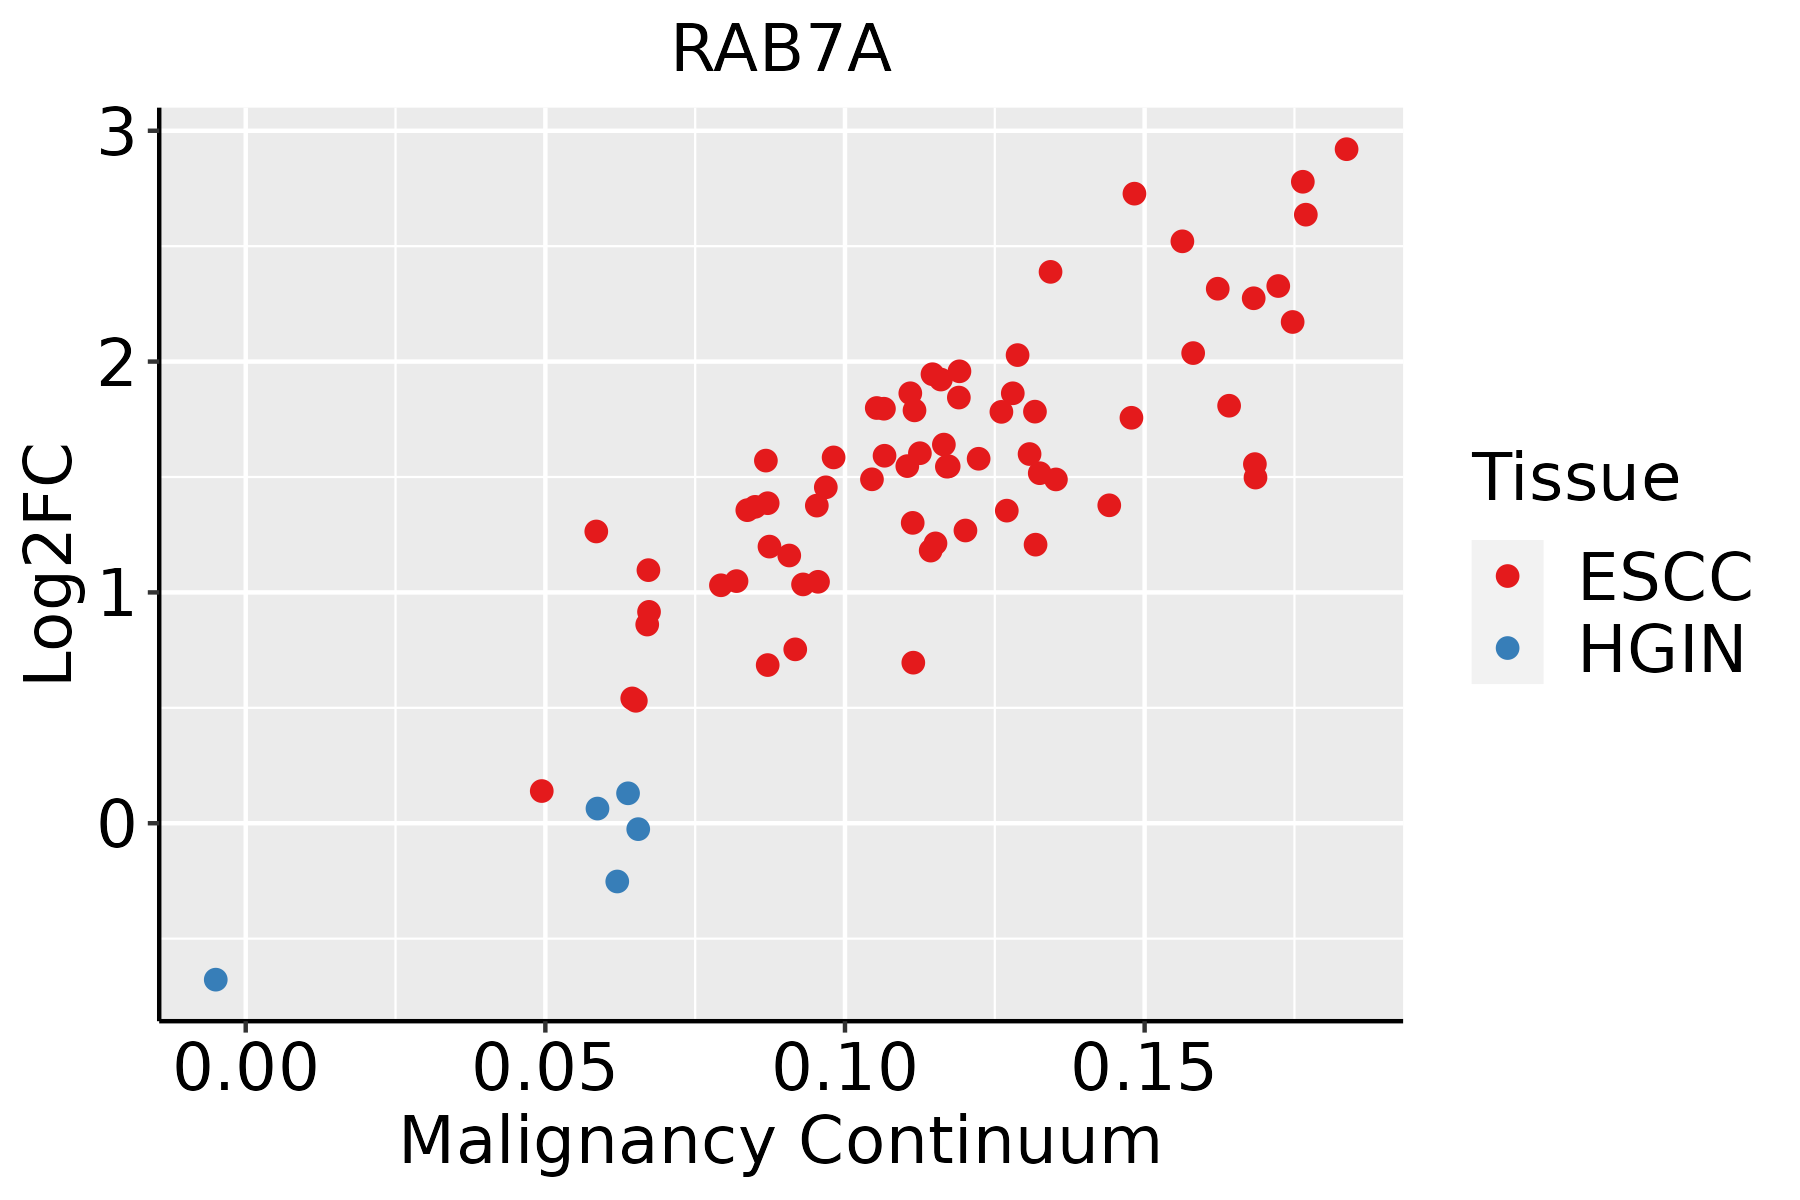 | ESCC: Esophageal squamous cell carcinoma |
| HGIN: High-grade intraepithelial neoplasias | ||
| LGIN: Low-grade intraepithelial neoplasias | ||
| Liver | 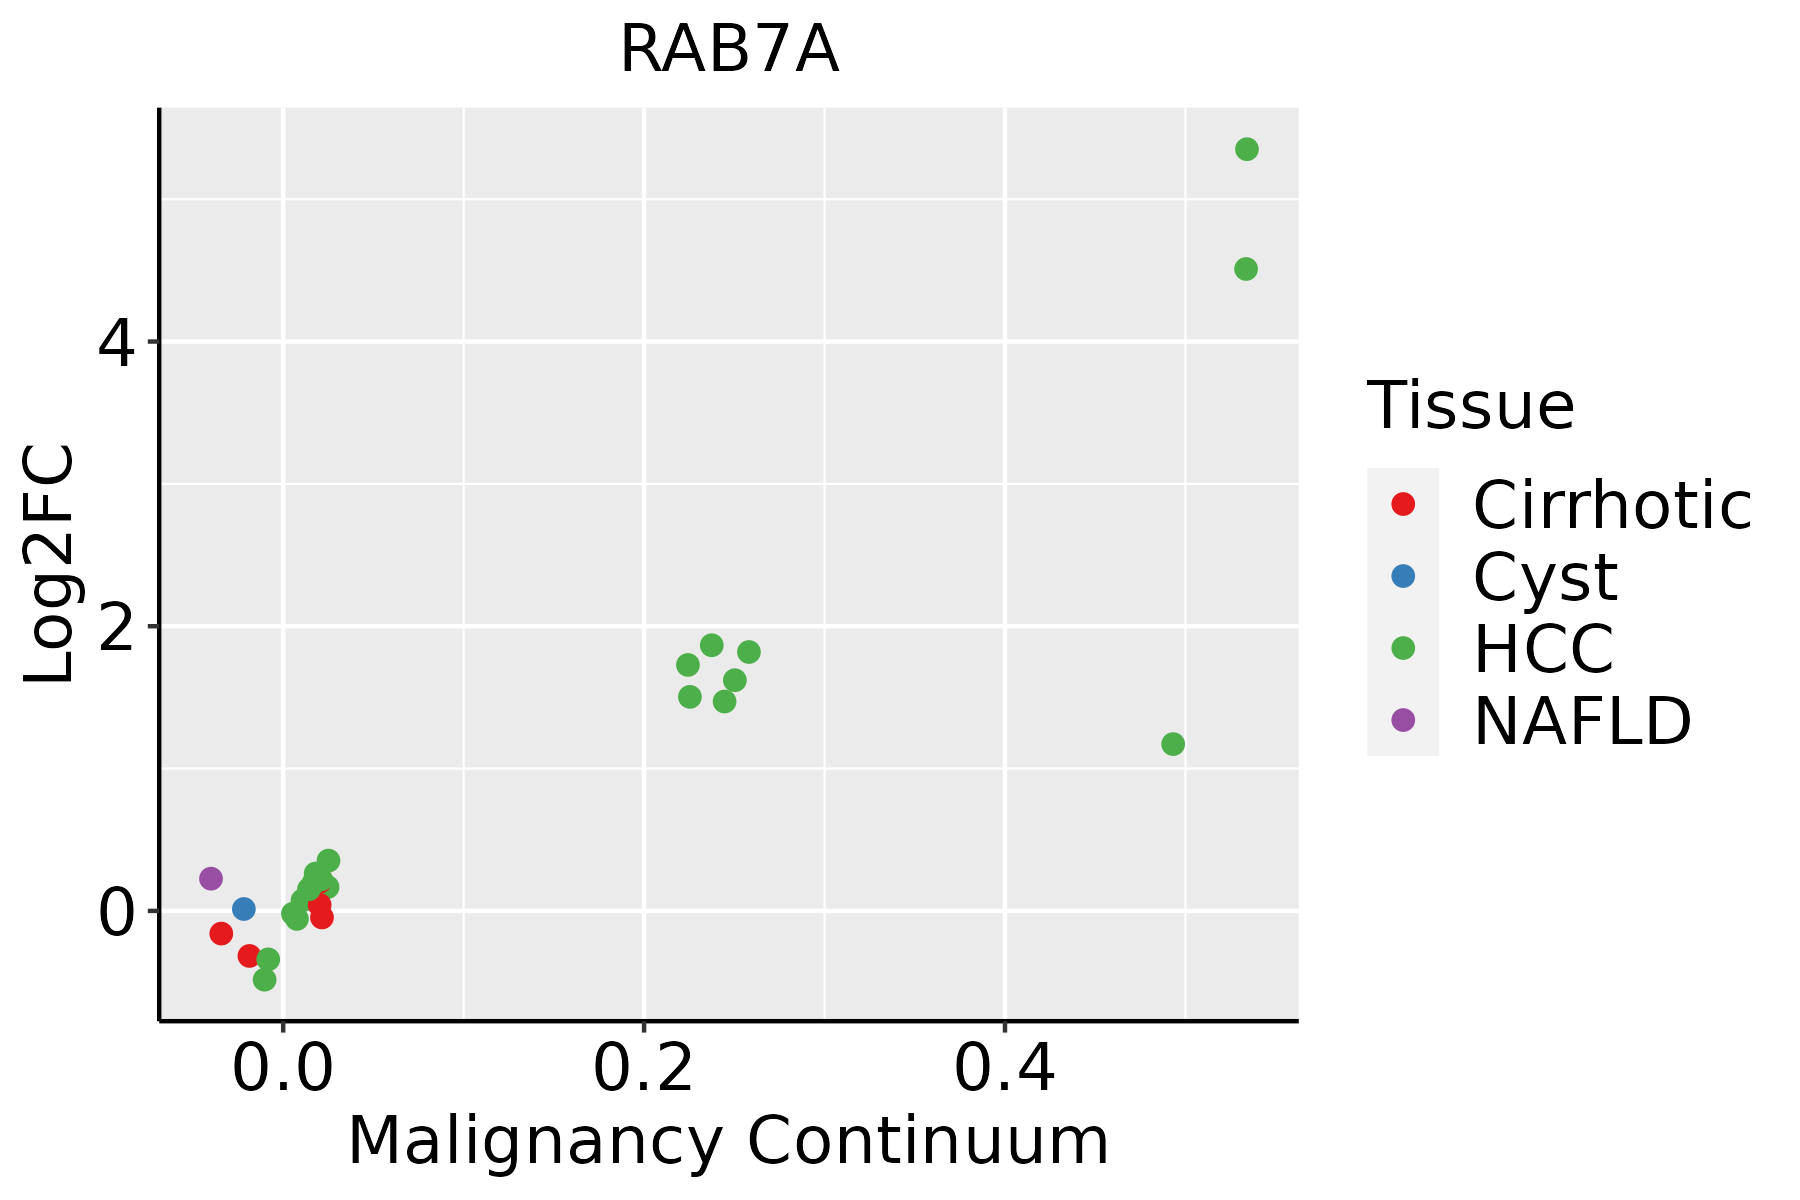 | HCC: Hepatocellular carcinoma |
| NAFLD: Non-alcoholic fatty liver disease | ||
| Lung |  | AAH: Atypical adenomatous hyperplasia |
| AIS: Adenocarcinoma in situ | ||
| IAC: Invasive lung adenocarcinoma | ||
| MIA: Minimally invasive adenocarcinoma | ||
| Oral Cavity | 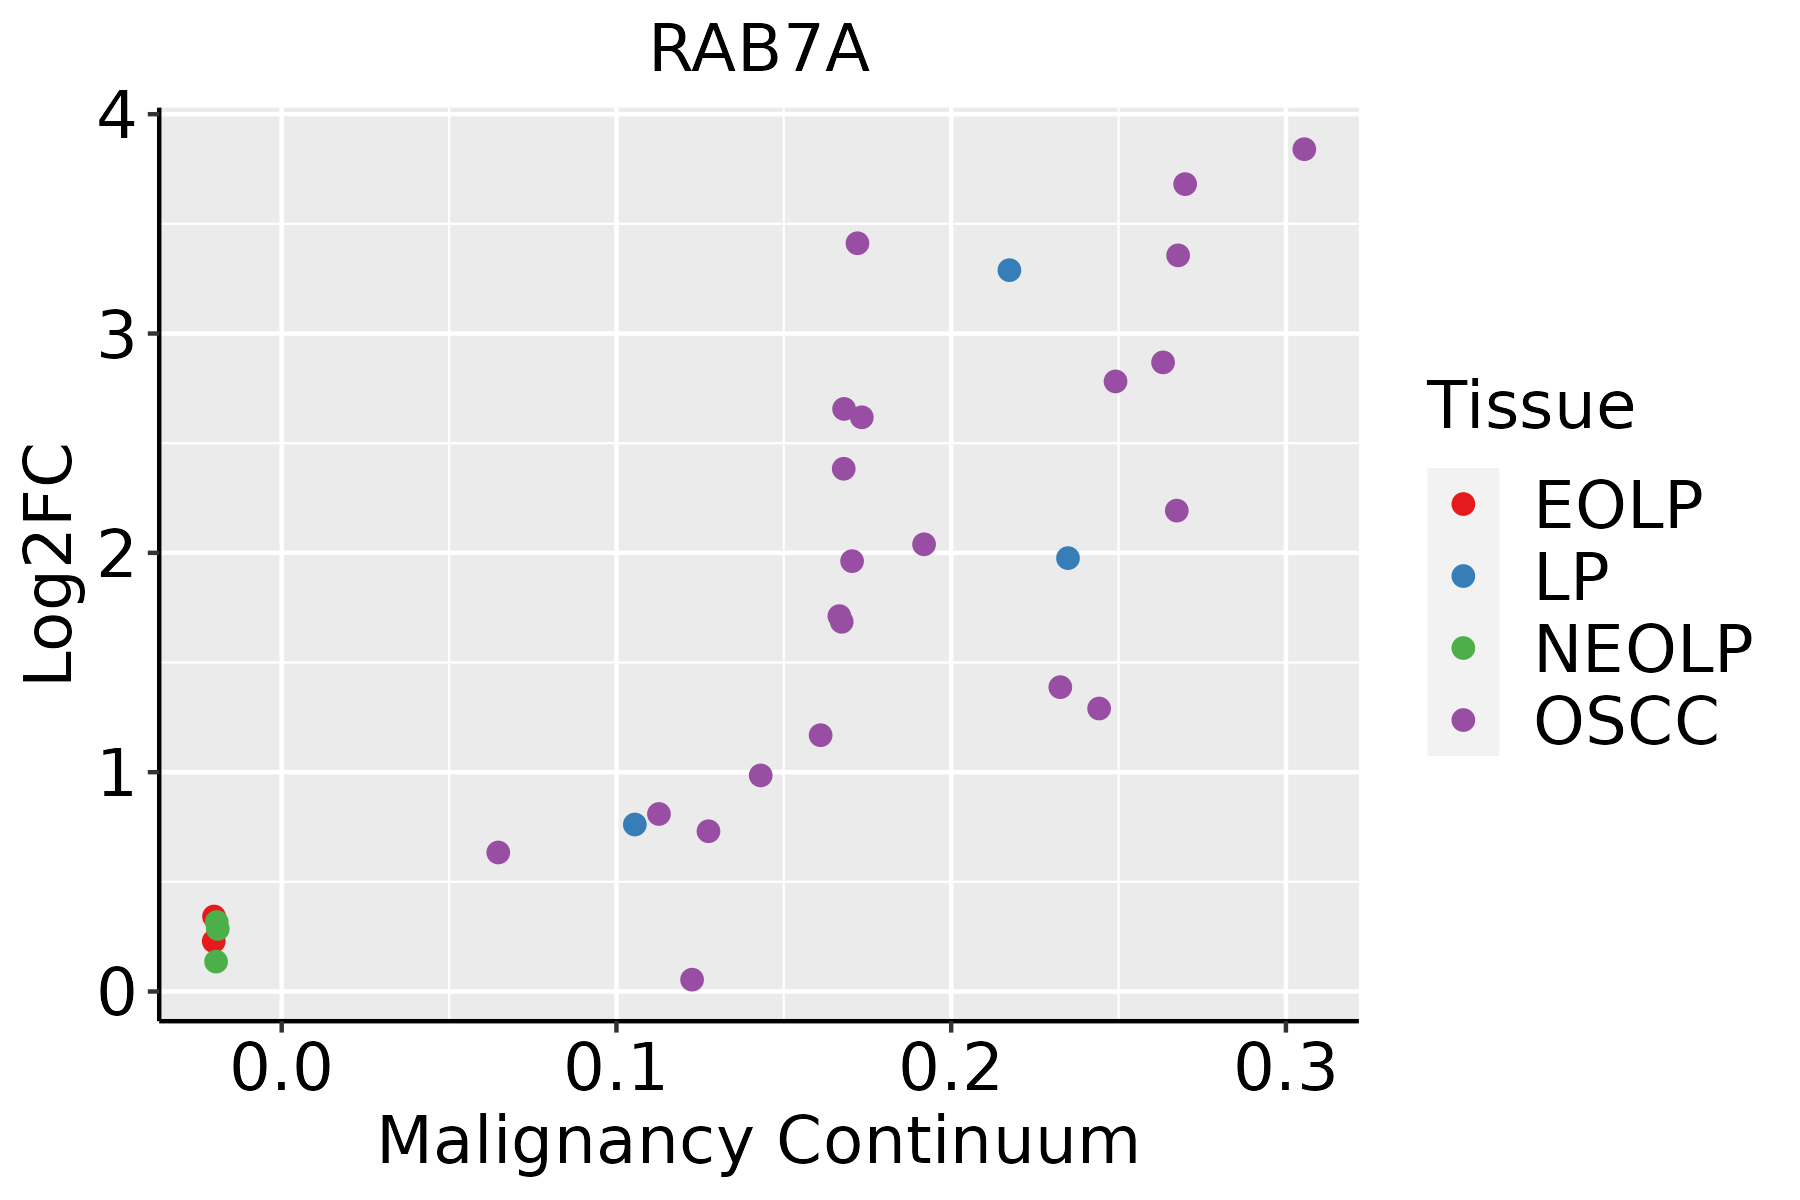 | EOLP: Erosive Oral lichen planus |
| LP: leukoplakia | ||
| NEOLP: Non-erosive oral lichen planus | ||
| OSCC: Oral squamous cell carcinoma | ||
| Prostate | 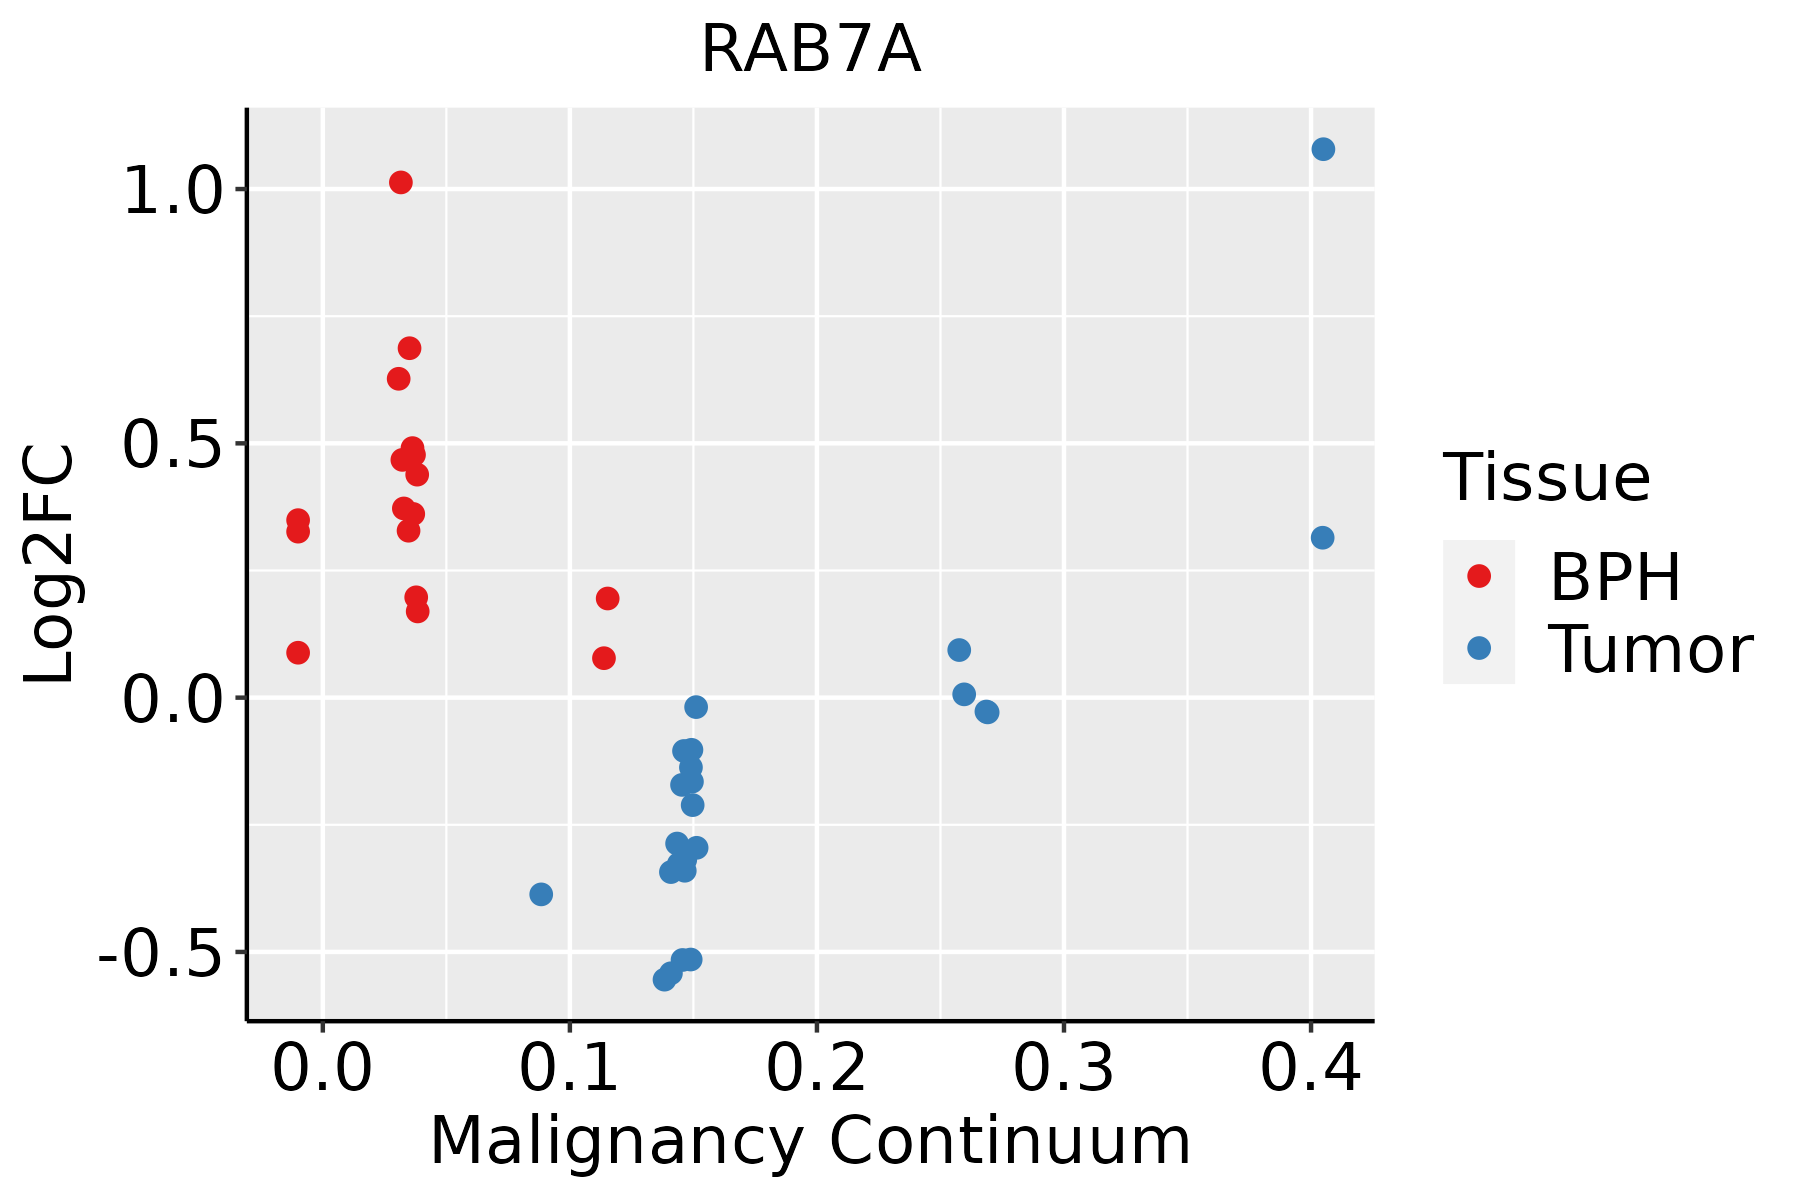 | BPH: Benign Prostatic Hyperplasia |
| Skin | 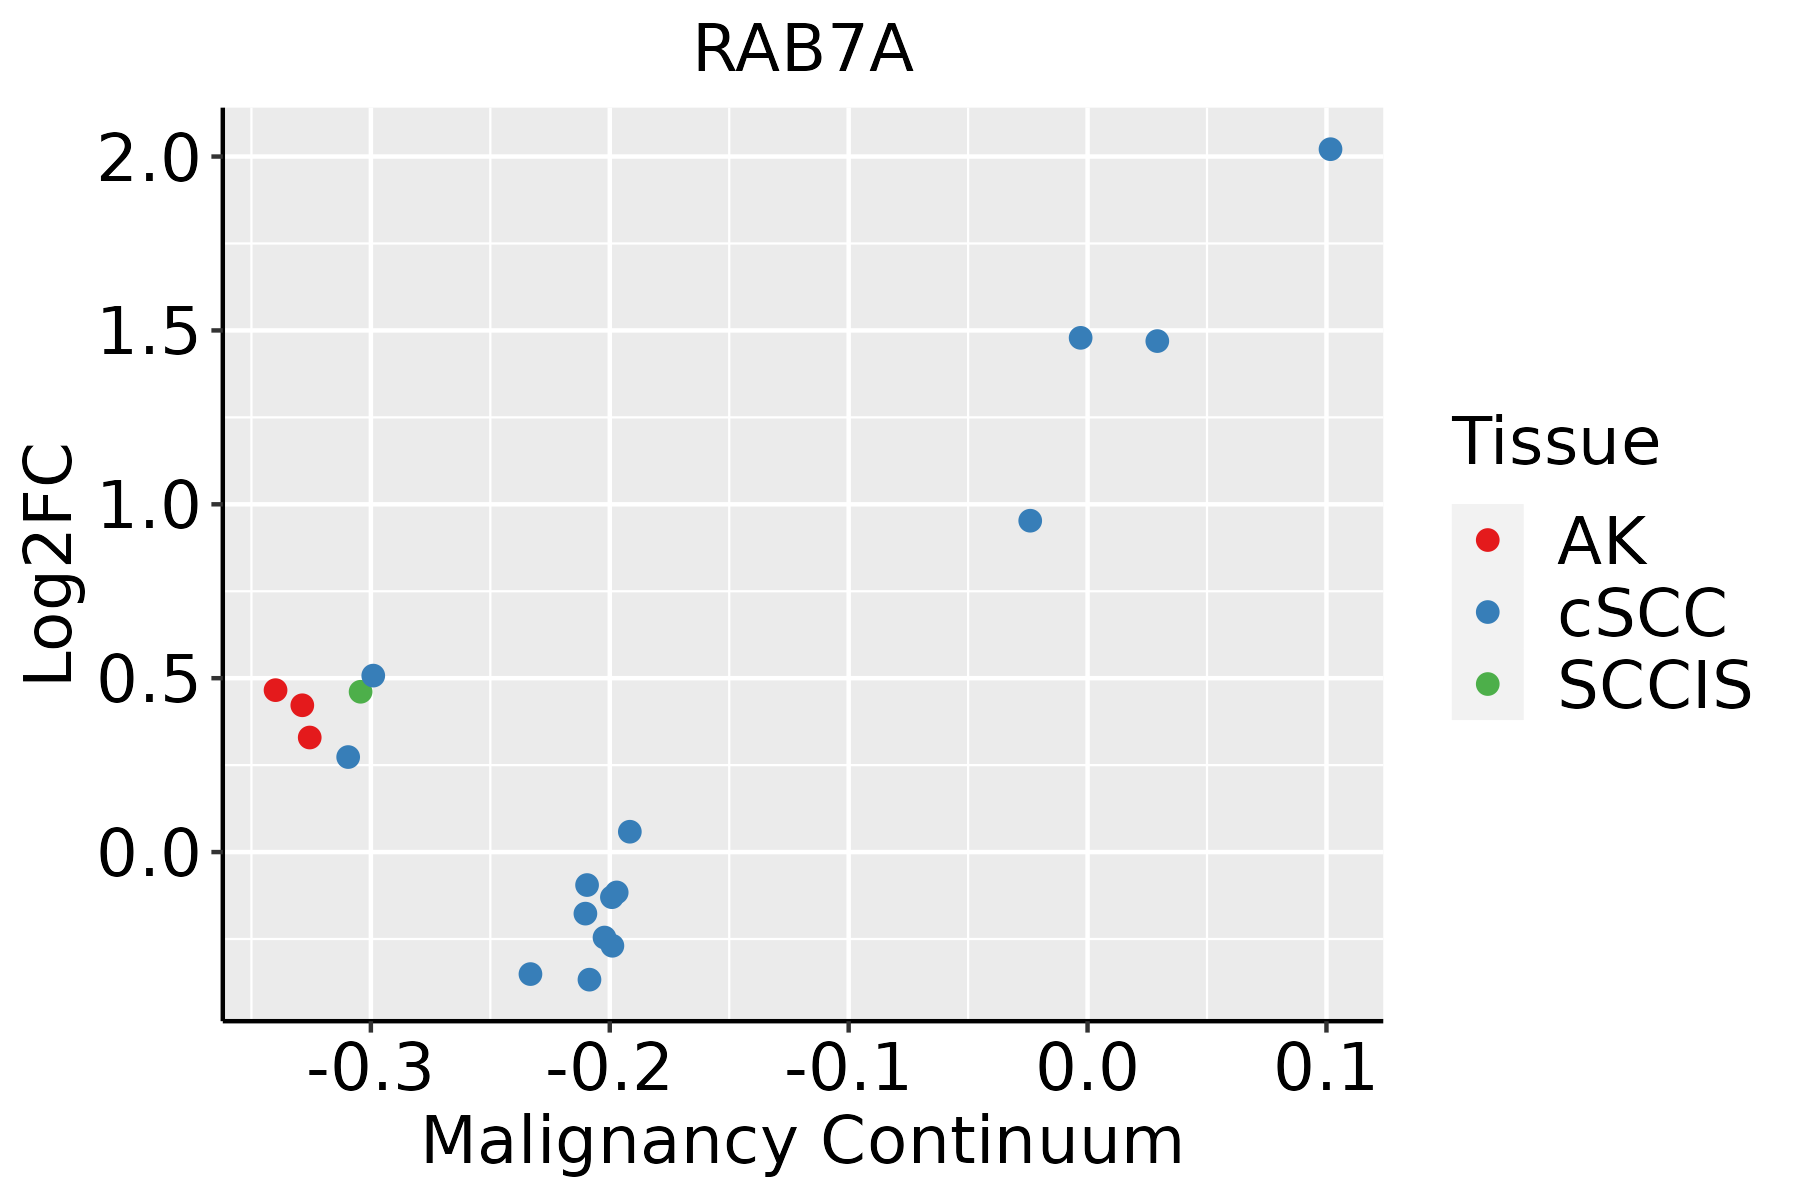 | AK: Actinic keratosis |
| cSCC: Cutaneous squamous cell carcinoma | ||
| SCCIS:squamous cell carcinoma in situ | ||
| Thyroid |  | ATC: Anaplastic thyroid cancer |
| HT: Hashimoto's thyroiditis | ||
| PTC: Papillary thyroid cancer |
| ∗log2FC in expression of this searched gene in stem-like cells from each diseased tissue sample relative to stem-like cells in normal samples in each tissue plotted against the malignancy continuum. Samples are colored based on if they are from different disease stage. |
Top |
Malignant transformation related pathway analysis |
| Find out the enriched GO biological processes and KEGG pathways involved in transition from healthy to precancer to cancer |
| Tissue | Disease Stage | Enriched GO biological Processes |
| Colorectum | AD |  |
| Colorectum | SER |  |
| Colorectum | MSS |  |
| Colorectum | MSI-H |  |
| Colorectum | FAP |  |
| ∗Top 15 enriched GO BP terms are showed in the bar plot of each disease state in each tissue. Each row represents a significant GO biological process which is colored according to the -log10(p.adjust). |
| Page: 1 2 3 4 5 6 7 8 9 |
| GO ID | Tissue | Disease Stage | Description | Gene Ratio | Bg Ratio | pvalue | p.adjust | Count |
| GO:00160329 | Breast | Precancer | viral process | 58/1080 | 415/18723 | 3.42e-10 | 3.16e-08 | 58 |
| GO:00190589 | Breast | Precancer | viral life cycle | 47/1080 | 317/18723 | 2.42e-09 | 1.99e-07 | 47 |
| GO:00444039 | Breast | Precancer | biological process involved in symbiotic interaction | 42/1080 | 290/18723 | 3.40e-08 | 2.11e-06 | 42 |
| GO:00521269 | Breast | Precancer | movement in host environment | 29/1080 | 175/18723 | 2.59e-07 | 1.28e-05 | 29 |
| GO:00517019 | Breast | Precancer | biological process involved in interaction with host | 31/1080 | 203/18723 | 6.52e-07 | 2.71e-05 | 31 |
| GO:00507929 | Breast | Precancer | regulation of viral process | 27/1080 | 164/18723 | 7.59e-07 | 3.05e-05 | 27 |
| GO:00421769 | Breast | Precancer | regulation of protein catabolic process | 47/1080 | 391/18723 | 1.50e-06 | 5.58e-05 | 47 |
| GO:00069009 | Breast | Precancer | vesicle budding from membrane | 12/1080 | 61/18723 | 1.61e-04 | 2.69e-03 | 12 |
| GO:00098969 | Breast | Precancer | positive regulation of catabolic process | 48/1080 | 492/18723 | 2.62e-04 | 3.84e-03 | 48 |
| GO:00485249 | Breast | Precancer | positive regulation of viral process | 12/1080 | 65/18723 | 3.00e-04 | 4.34e-03 | 12 |
| GO:00066059 | Breast | Precancer | protein targeting | 33/1080 | 314/18723 | 6.50e-04 | 7.99e-03 | 33 |
| GO:00725948 | Breast | Precancer | establishment of protein localization to organelle | 41/1080 | 422/18723 | 7.75e-04 | 9.20e-03 | 41 |
| GO:19035434 | Breast | Precancer | positive regulation of exosomal secretion | 5/1080 | 15/18723 | 1.17e-03 | 1.26e-02 | 5 |
| GO:00457329 | Breast | Precancer | positive regulation of protein catabolic process | 25/1080 | 231/18723 | 1.87e-03 | 1.82e-02 | 25 |
| GO:19035416 | Breast | Precancer | regulation of exosomal secretion | 5/1080 | 17/18723 | 2.19e-03 | 2.06e-02 | 5 |
| GO:19901826 | Breast | Precancer | exosomal secretion | 5/1080 | 20/18723 | 4.74e-03 | 3.61e-02 | 5 |
| GO:00977346 | Breast | Precancer | extracellular exosome biogenesis | 5/1080 | 21/18723 | 5.93e-03 | 4.21e-02 | 5 |
| GO:00300046 | Breast | Precancer | cellular monovalent inorganic cation homeostasis | 13/1080 | 103/18723 | 6.26e-03 | 4.40e-02 | 13 |
| GO:001603214 | Breast | IDC | viral process | 75/1434 | 415/18723 | 1.98e-12 | 4.02e-10 | 75 |
| GO:001905814 | Breast | IDC | viral life cycle | 61/1434 | 317/18723 | 1.61e-11 | 2.77e-09 | 61 |
| Page: 1 2 3 4 5 6 7 8 9 10 11 12 13 14 15 16 17 18 19 20 21 22 23 24 25 26 27 28 29 30 31 32 33 34 35 36 37 38 39 40 41 42 43 44 45 46 47 48 49 50 51 52 53 54 55 56 57 58 59 60 61 62 63 64 |
| Pathway ID | Tissue | Disease Stage | Description | Gene Ratio | Bg Ratio | pvalue | p.adjust | qvalue | Count |
| hsa0513218 | Breast | Precancer | Salmonella infection | 49/684 | 249/8465 | 2.92e-09 | 6.15e-08 | 4.71e-08 | 49 |
| hsa0414518 | Breast | Precancer | Phagosome | 27/684 | 152/8465 | 7.37e-05 | 6.85e-04 | 5.25e-04 | 27 |
| hsa0413716 | Breast | Precancer | Mitophagy - animal | 15/684 | 72/8465 | 5.22e-04 | 3.93e-03 | 3.01e-03 | 15 |
| hsa0513219 | Breast | Precancer | Salmonella infection | 49/684 | 249/8465 | 2.92e-09 | 6.15e-08 | 4.71e-08 | 49 |
| hsa0414519 | Breast | Precancer | Phagosome | 27/684 | 152/8465 | 7.37e-05 | 6.85e-04 | 5.25e-04 | 27 |
| hsa0413717 | Breast | Precancer | Mitophagy - animal | 15/684 | 72/8465 | 5.22e-04 | 3.93e-03 | 3.01e-03 | 15 |
| hsa0513224 | Breast | IDC | Salmonella infection | 55/867 | 249/8465 | 2.07e-08 | 4.49e-07 | 3.36e-07 | 55 |
| hsa0414522 | Breast | IDC | Phagosome | 34/867 | 152/8465 | 8.00e-06 | 9.99e-05 | 7.48e-05 | 34 |
| hsa0413723 | Breast | IDC | Mitophagy - animal | 17/867 | 72/8465 | 7.61e-04 | 6.04e-03 | 4.52e-03 | 17 |
| hsa0513234 | Breast | IDC | Salmonella infection | 55/867 | 249/8465 | 2.07e-08 | 4.49e-07 | 3.36e-07 | 55 |
| hsa0414532 | Breast | IDC | Phagosome | 34/867 | 152/8465 | 8.00e-06 | 9.99e-05 | 7.48e-05 | 34 |
| hsa0413733 | Breast | IDC | Mitophagy - animal | 17/867 | 72/8465 | 7.61e-04 | 6.04e-03 | 4.52e-03 | 17 |
| hsa0513243 | Breast | DCIS | Salmonella infection | 55/846 | 249/8465 | 8.71e-09 | 1.87e-07 | 1.38e-07 | 55 |
| hsa0414541 | Breast | DCIS | Phagosome | 35/846 | 152/8465 | 1.67e-06 | 2.45e-05 | 1.81e-05 | 35 |
| hsa0413742 | Breast | DCIS | Mitophagy - animal | 17/846 | 72/8465 | 5.75e-04 | 4.42e-03 | 3.26e-03 | 17 |
| hsa0414416 | Breast | DCIS | Endocytosis | 37/846 | 251/8465 | 9.92e-03 | 4.40e-02 | 3.24e-02 | 37 |
| hsa0513253 | Breast | DCIS | Salmonella infection | 55/846 | 249/8465 | 8.71e-09 | 1.87e-07 | 1.38e-07 | 55 |
| hsa0414551 | Breast | DCIS | Phagosome | 35/846 | 152/8465 | 1.67e-06 | 2.45e-05 | 1.81e-05 | 35 |
| hsa0413752 | Breast | DCIS | Mitophagy - animal | 17/846 | 72/8465 | 5.75e-04 | 4.42e-03 | 3.26e-03 | 17 |
| hsa0414417 | Breast | DCIS | Endocytosis | 37/846 | 251/8465 | 9.92e-03 | 4.40e-02 | 3.24e-02 | 37 |
| Page: 1 2 3 4 5 6 7 8 9 10 11 |
Top |
Cell-cell communication analysis |
| Identification of potential cell-cell interactions between two cell types and their ligand-receptor pairs for different disease states |
| Ligand | Receptor | LRpair | Pathway | Tissue | Disease Stage |
| Page: 1 |
Top |
Single-cell gene regulatory network inference analysis |
| Find out the significant the regulons (TFs) and the target genes of each regulon across cell types for different disease states |
| TF | Cell Type | Tissue | Disease Stage | Target Gene | RSS | Regulon Activity |
| RAB7A | MES | Cervix | Healthy | KLK10,APOBEC3A,RFFL, etc. | 2.91e-01 |  |
| ∗The dot plots of a searched regulon are shown for all cell subpopulations in each disease state of each tissue based on the regulon specific score inferred using pySCENIC and by calculating the average expression. |
| Page: 1 |
Top |
Somatic mutation of malignant transformation related genes |
| Annotation of somatic variants for genes involved in malignant transformation |
| Hugo Symbol | Variant Class | Variant Classification | dbSNP RS | HGVSc | HGVSp | HGVSp Short | SWISSPROT | BIOTYPE | SIFT | PolyPhen | Tumor Sample Barcode | Tissue | Histology | Sex | Age | Stage | Therapy Types | Drugs | Outcome |
| RAB7A | SNV | Missense_Mutation | c.217N>G | p.Leu73Val | p.L73V | P51149 | protein_coding | deleterious(0.02) | benign(0.239) | TCGA-BH-A0HA-01 | Breast | breast invasive carcinoma | Female | <65 | I/II | Unknown | Unknown | SD | |
| RAB7A | SNV | Missense_Mutation | novel | c.412C>T | p.Arg138Trp | p.R138W | P51149 | protein_coding | deleterious(0) | possibly_damaging(0.85) | TCGA-2W-A8YY-01 | Cervix | cervical & endocervical cancer | Female | <65 | I/II | Chemotherapy | cisplatin | CR |
| RAB7A | SNV | Missense_Mutation | c.99C>G | p.Phe33Leu | p.F33L | P51149 | protein_coding | deleterious(0) | probably_damaging(0.981) | TCGA-IR-A3LK-01 | Cervix | cervical & endocervical cancer | Female | >=65 | I/II | Chemotherapy | cisplatin | PD | |
| RAB7A | SNV | Missense_Mutation | novel | c.103N>C | p.Asn35His | p.N35H | P51149 | protein_coding | tolerated(0.05) | possibly_damaging(0.782) | TCGA-ZJ-AAXU-01 | Cervix | cervical & endocervical cancer | Female | <65 | I/II | Unknown | Unknown | SD |
| RAB7A | SNV | Missense_Mutation | c.65C>T | p.Thr22Ile | p.T22I | P51149 | protein_coding | deleterious(0) | probably_damaging(0.977) | TCGA-AA-3488-01 | Colorectum | colon adenocarcinoma | Male | <65 | III/IV | Unknown | Unknown | PD | |
| RAB7A | SNV | Missense_Mutation | c.334N>T | p.Pro112Ser | p.P112S | P51149 | protein_coding | deleterious(0.01) | benign(0.127) | TCGA-AA-3977-01 | Colorectum | colon adenocarcinoma | Male | >=65 | I/II | Unknown | Unknown | SD | |
| RAB7A | SNV | Missense_Mutation | novel | c.287N>G | p.Phe96Cys | p.F96C | P51149 | protein_coding | deleterious(0) | probably_damaging(0.999) | TCGA-AA-3984-01 | Colorectum | colon adenocarcinoma | Female | <65 | I/II | Unknown | Unknown | SD |
| RAB7A | SNV | Missense_Mutation | c.213N>C | p.Gln71His | p.Q71H | P51149 | protein_coding | tolerated(0.08) | benign(0.03) | TCGA-AM-5821-01 | Colorectum | colon adenocarcinoma | Female | >=65 | I/II | Unknown | Unknown | SD | |
| RAB7A | SNV | Missense_Mutation | novel | c.105N>G | p.Asn35Lys | p.N35K | P51149 | protein_coding | tolerated(0.22) | benign(0.057) | TCGA-CA-6717-01 | Colorectum | colon adenocarcinoma | Male | <65 | I/II | Chemotherapy | oxaliplatin | CR |
| RAB7A | SNV | Missense_Mutation | rs121909079 | c.484N>A | p.Val162Met | p.V162M | P51149 | protein_coding | deleterious(0.01) | probably_damaging(0.994) | TCGA-NH-A50U-01 | Colorectum | colon adenocarcinoma | Male | <65 | I/II | Ancillary | leucovorin | PD |
| Page: 1 2 3 |
Top |
Related drugs of malignant transformation related genes |
| Identification of chemicals and drugs interact with genes involved in malignant transfromation |
| (DGIdb 4.0) |
| Entrez ID | Symbol | Category | Interaction Types | Drug Claim Name | Drug Name | PMIDs |
| Page: 1 |

Copyright 2023-Present -The University of Texas Health Science Center at Houston |