
|
|||||
|
 | |
| |
| |
| |
| |
| |
|
Gene: RAB6B |
Gene summary for RAB6B |
| Gene information | Species | Human | Gene symbol | RAB6B | Gene ID | 51560 |
| Gene name | RAB6B, member RAS oncogene family | |
| Gene Alias | RAB6B | |
| Cytomap | 3q22.1 | |
| Gene Type | protein-coding | GO ID | GO:0006810 | UniProtAcc | Q9NRW1 |
Top |
Malignant transformation analysis |
| Identification of the aberrant gene expression in precancerous and cancerous lesions by comparing the gene expression of stem-like cells in diseased tissues with normal stem cells |
| Entrez ID | Symbol | Replicates | Species | Organ | Tissue | Adj P-value | Log2FC | Malignancy |
| 51560 | RAB6B | LZE2T | Human | Esophagus | ESCC | 9.13e-03 | 4.98e-01 | 0.082 |
| 51560 | RAB6B | LZE4T | Human | Esophagus | ESCC | 4.41e-14 | 6.13e-01 | 0.0811 |
| 51560 | RAB6B | LZE7T | Human | Esophagus | ESCC | 2.26e-06 | 4.60e-01 | 0.0667 |
| 51560 | RAB6B | LZE24T | Human | Esophagus | ESCC | 5.48e-03 | 1.11e-01 | 0.0596 |
| 51560 | RAB6B | P2T-E | Human | Esophagus | ESCC | 8.23e-05 | 1.13e-01 | 0.1177 |
| 51560 | RAB6B | P4T-E | Human | Esophagus | ESCC | 1.44e-02 | 1.40e-01 | 0.1323 |
| 51560 | RAB6B | P9T-E | Human | Esophagus | ESCC | 8.13e-18 | 4.73e-01 | 0.1131 |
| 51560 | RAB6B | P10T-E | Human | Esophagus | ESCC | 9.84e-43 | 8.26e-01 | 0.116 |
| 51560 | RAB6B | P12T-E | Human | Esophagus | ESCC | 2.03e-22 | 4.96e-01 | 0.1122 |
| 51560 | RAB6B | P15T-E | Human | Esophagus | ESCC | 2.47e-51 | 1.41e+00 | 0.1149 |
| 51560 | RAB6B | P16T-E | Human | Esophagus | ESCC | 1.22e-26 | 6.00e-01 | 0.1153 |
| 51560 | RAB6B | P22T-E | Human | Esophagus | ESCC | 5.83e-05 | 2.40e-01 | 0.1236 |
| 51560 | RAB6B | P26T-E | Human | Esophagus | ESCC | 1.63e-15 | 3.59e-01 | 0.1276 |
| 51560 | RAB6B | P28T-E | Human | Esophagus | ESCC | 2.31e-62 | 1.57e+00 | 0.1149 |
| 51560 | RAB6B | P30T-E | Human | Esophagus | ESCC | 4.63e-36 | 2.88e+00 | 0.137 |
| 51560 | RAB6B | P36T-E | Human | Esophagus | ESCC | 2.20e-02 | 1.72e-01 | 0.1187 |
| 51560 | RAB6B | P38T-E | Human | Esophagus | ESCC | 1.16e-03 | 1.74e-01 | 0.127 |
| 51560 | RAB6B | P40T-E | Human | Esophagus | ESCC | 1.86e-02 | 1.76e-01 | 0.109 |
| 51560 | RAB6B | P48T-E | Human | Esophagus | ESCC | 3.64e-06 | 2.94e-01 | 0.0959 |
| 51560 | RAB6B | P49T-E | Human | Esophagus | ESCC | 1.08e-11 | 1.53e+00 | 0.1768 |
| Page: 1 2 |
| Tissue | Expression Dynamics | Abbreviation |
| Esophagus | 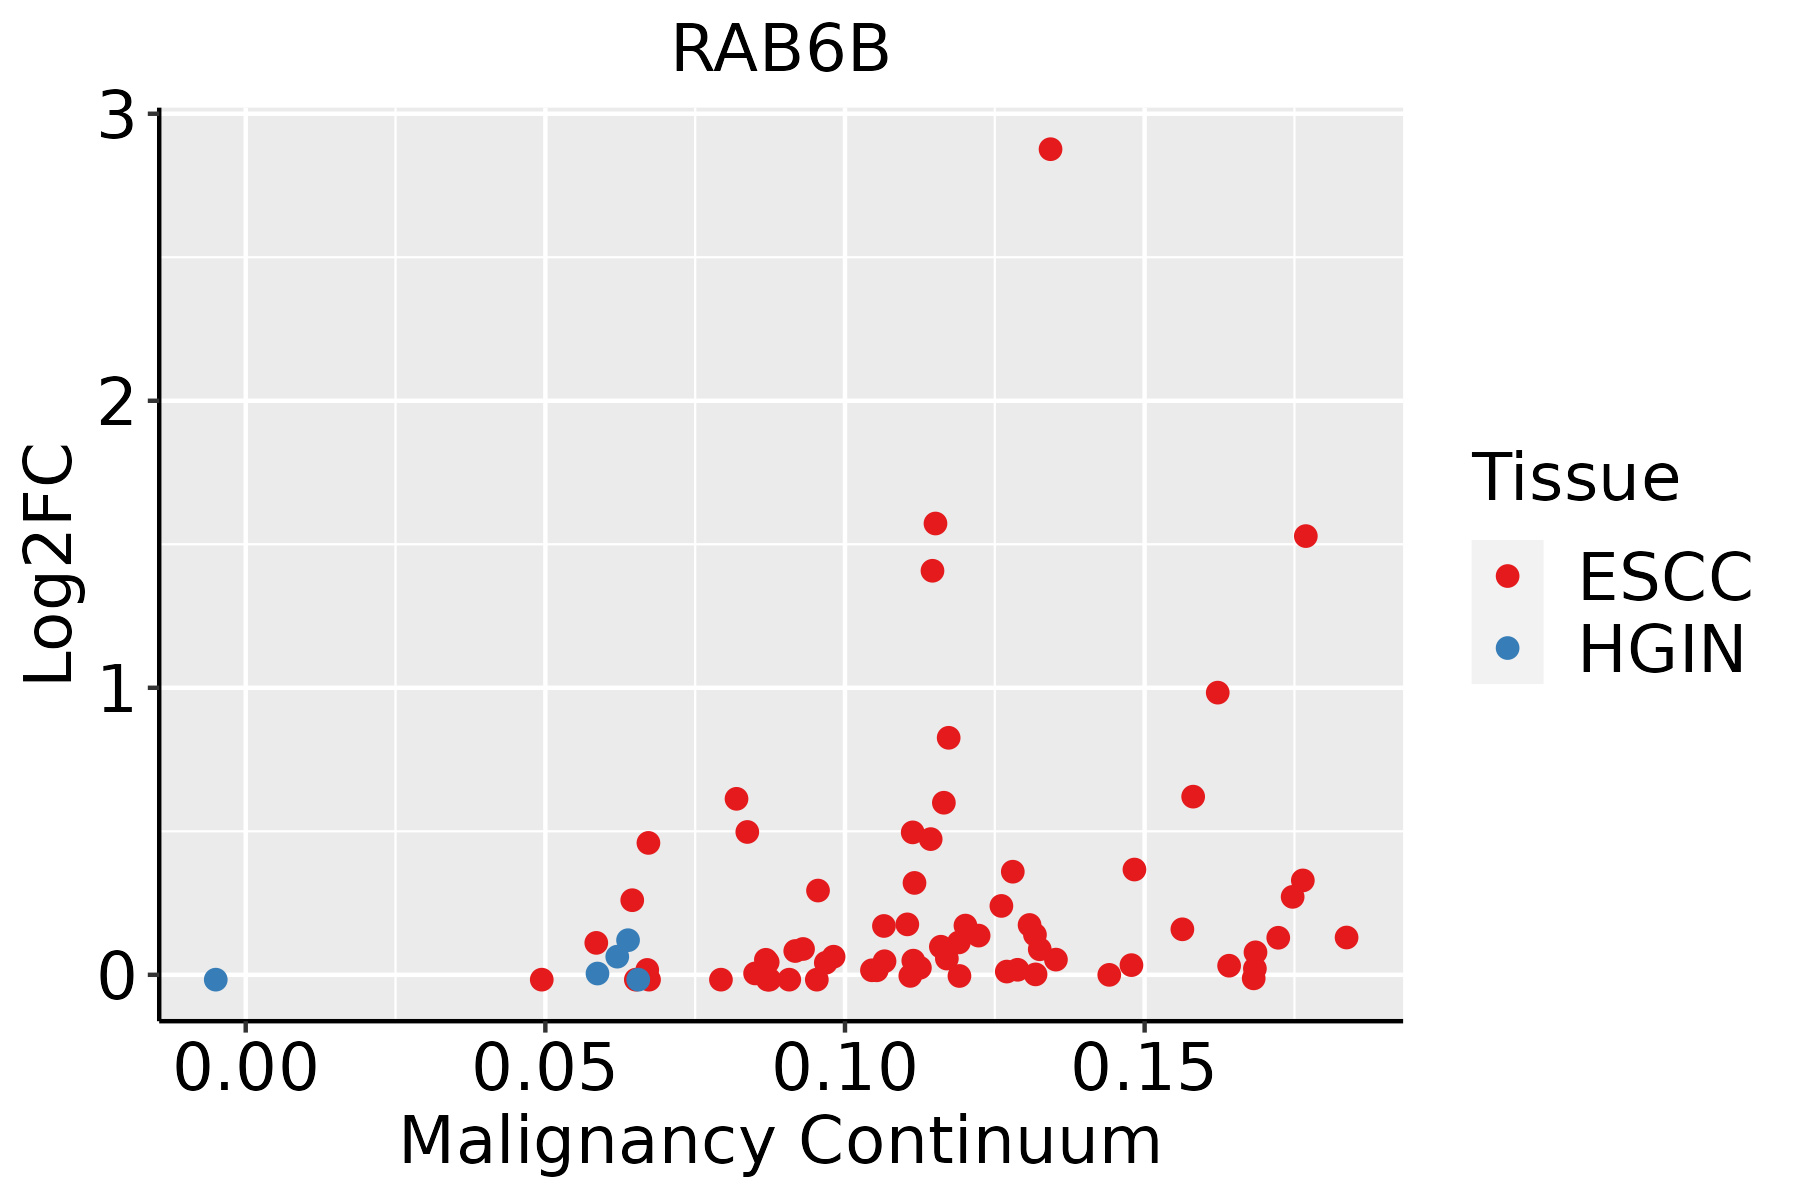 | ESCC: Esophageal squamous cell carcinoma |
| HGIN: High-grade intraepithelial neoplasias | ||
| LGIN: Low-grade intraepithelial neoplasias |
| ∗log2FC in expression of this searched gene in stem-like cells from each diseased tissue sample relative to stem-like cells in normal samples in each tissue plotted against the malignancy continuum. Samples are colored based on if they are from different disease stage. |
Top |
Malignant transformation related pathway analysis |
| Find out the enriched GO biological processes and KEGG pathways involved in transition from healthy to precancer to cancer |
| Tissue | Disease Stage | Enriched GO biological Processes |
| Colorectum | AD |  |
| Colorectum | SER |  |
| Colorectum | MSS |  |
| Colorectum | MSI-H |  |
| Colorectum | FAP |  |
| ∗Top 15 enriched GO BP terms are showed in the bar plot of each disease state in each tissue. Each row represents a significant GO biological process which is colored according to the -log10(p.adjust). |
| Page: 1 2 3 4 5 6 7 8 9 |
| GO ID | Tissue | Disease Stage | Description | Gene Ratio | Bg Ratio | pvalue | p.adjust | Count |
| GO:004819318 | Esophagus | ESCC | Golgi vesicle transport | 231/8552 | 296/18723 | 1.82e-30 | 9.63e-28 | 231 |
| GO:001619715 | Esophagus | ESCC | endosomal transport | 168/8552 | 230/18723 | 2.28e-17 | 1.93e-15 | 168 |
| GO:001648210 | Esophagus | ESCC | cytosolic transport | 124/8552 | 168/18723 | 9.69e-14 | 4.69e-12 | 124 |
| GO:000689017 | Esophagus | ESCC | retrograde vesicle-mediated transport, Golgi to endoplasmic reticulum | 46/8552 | 52/18723 | 1.23e-10 | 3.66e-09 | 46 |
| GO:00421477 | Esophagus | ESCC | retrograde transport, endosome to Golgi | 63/8552 | 91/18723 | 4.58e-06 | 4.87e-05 | 63 |
| GO:00068914 | Esophagus | ESCC | intra-Golgi vesicle-mediated transport | 26/8552 | 33/18723 | 1.06e-04 | 7.43e-04 | 26 |
| Page: 1 |
| Pathway ID | Tissue | Disease Stage | Description | Gene Ratio | Bg Ratio | pvalue | p.adjust | qvalue | Count |
| Page: 1 |
Top |
Cell-cell communication analysis |
| Identification of potential cell-cell interactions between two cell types and their ligand-receptor pairs for different disease states |
| Ligand | Receptor | LRpair | Pathway | Tissue | Disease Stage |
| Page: 1 |
Top |
Single-cell gene regulatory network inference analysis |
| Find out the significant the regulons (TFs) and the target genes of each regulon across cell types for different disease states |
| TF | Cell Type | Tissue | Disease Stage | Target Gene | RSS | Regulon Activity |
| ∗The dot plots of a searched regulon are shown for all cell subpopulations in each disease state of each tissue based on the regulon specific score inferred using pySCENIC and by calculating the average expression. |
| Page: 1 |
Top |
Somatic mutation of malignant transformation related genes |
| Annotation of somatic variants for genes involved in malignant transformation |
| Hugo Symbol | Variant Class | Variant Classification | dbSNP RS | HGVSc | HGVSp | HGVSp Short | SWISSPROT | BIOTYPE | SIFT | PolyPhen | Tumor Sample Barcode | Tissue | Histology | Sex | Age | Stage | Therapy Types | Drugs | Outcome |
| RAB6B | SNV | Missense_Mutation | c.106N>A | p.Asp36Asn | p.D36N | Q9NRW1 | protein_coding | deleterious(0.01) | benign(0.223) | TCGA-A6-2686-01 | Colorectum | colon adenocarcinoma | Female | >=65 | I/II | Unknown | Unknown | SD | |
| RAB6B | SNV | Missense_Mutation | c.448N>T | p.Val150Phe | p.V150F | Q9NRW1 | protein_coding | deleterious(0.01) | probably_damaging(0.97) | TCGA-AD-A5EK-01 | Colorectum | colon adenocarcinoma | Male | <65 | I/II | Unknown | Unknown | SD | |
| RAB6B | SNV | Missense_Mutation | novel | c.488N>C | p.Val163Ala | p.V163A | Q9NRW1 | protein_coding | deleterious(0) | probably_damaging(0.973) | TCGA-G4-6588-01 | Colorectum | colon adenocarcinoma | Female | <65 | I/II | Unknown | Unknown | SD |
| RAB6B | SNV | Missense_Mutation | rs769627212 | c.325N>A | p.Asp109Asn | p.D109N | Q9NRW1 | protein_coding | deleterious(0.05) | benign(0.047) | TCGA-WS-AB45-01 | Colorectum | colon adenocarcinoma | Female | <65 | I/II | Unknown | Unknown | SD |
| RAB6B | SNV | Missense_Mutation | c.115G>A | p.Asp39Asn | p.D39N | Q9NRW1 | protein_coding | deleterious(0.01) | benign(0.124) | TCGA-AF-6655-01 | Colorectum | rectum adenocarcinoma | Male | >=65 | III/IV | Unknown | Unknown | SD | |
| RAB6B | SNV | Missense_Mutation | novel | c.479N>A | p.Gly160Asp | p.G160D | Q9NRW1 | protein_coding | deleterious(0) | probably_damaging(0.97) | TCGA-A5-A0G1-01 | Endometrium | uterine corpus endometrioid carcinoma | Female | >=65 | I/II | Unknown | Unknown | SD |
| RAB6B | SNV | Missense_Mutation | novel | c.68N>T | p.Ser23Ile | p.S23I | Q9NRW1 | protein_coding | deleterious(0.01) | possibly_damaging(0.543) | TCGA-A5-A0G1-01 | Endometrium | uterine corpus endometrioid carcinoma | Female | >=65 | I/II | Unknown | Unknown | SD |
| RAB6B | SNV | Missense_Mutation | rs770015097 | c.179G>A | p.Arg60His | p.R60H | Q9NRW1 | protein_coding | deleterious(0.01) | probably_damaging(0.952) | TCGA-A5-A0VP-01 | Endometrium | uterine corpus endometrioid carcinoma | Female | >=65 | I/II | Unknown | Unknown | SD |
| RAB6B | SNV | Missense_Mutation | rs534416766 | c.227N>A | p.Arg76His | p.R76H | Q9NRW1 | protein_coding | deleterious(0.04) | possibly_damaging(0.761) | TCGA-AJ-A3EL-01 | Endometrium | uterine corpus endometrioid carcinoma | Female | <65 | I/II | Unknown | Unknown | SD |
| RAB6B | SNV | Missense_Mutation | c.232N>A | p.Leu78Met | p.L78M | Q9NRW1 | protein_coding | deleterious(0) | probably_damaging(1) | TCGA-AP-A051-01 | Endometrium | uterine corpus endometrioid carcinoma | Female | >=65 | I/II | Unknown | Unknown | SD |
| Page: 1 2 3 4 |
Top |
Related drugs of malignant transformation related genes |
| Identification of chemicals and drugs interact with genes involved in malignant transfromation |
| (DGIdb 4.0) |
| Entrez ID | Symbol | Category | Interaction Types | Drug Claim Name | Drug Name | PMIDs |
| Page: 1 |

Copyright 2023-Present -The University of Texas Health Science Center at Houston |