
|
|||||
|
 | |
| |
| |
| |
| |
| |
|
Gene: RAB6A |
Gene summary for RAB6A |
| Gene information | Species | Human | Gene symbol | RAB6A | Gene ID | 5870 |
| Gene name | RAB6A, member RAS oncogene family | |
| Gene Alias | RAB6 | |
| Cytomap | 11q13.4 | |
| Gene Type | protein-coding | GO ID | GO:0002376 | UniProtAcc | P20340 |
Top |
Malignant transformation analysis |
| Identification of the aberrant gene expression in precancerous and cancerous lesions by comparing the gene expression of stem-like cells in diseased tissues with normal stem cells |
| Entrez ID | Symbol | Replicates | Species | Organ | Tissue | Adj P-value | Log2FC | Malignancy |
| 5870 | RAB6A | HTA11_3410_2000001011 | Human | Colorectum | AD | 2.28e-05 | -3.77e-01 | 0.0155 |
| 5870 | RAB6A | HTA11_347_2000001011 | Human | Colorectum | AD | 2.98e-09 | 5.08e-01 | -0.1954 |
| 5870 | RAB6A | A001-C-207 | Human | Colorectum | FAP | 1.49e-02 | -2.72e-01 | 0.1278 |
| 5870 | RAB6A | A015-C-203 | Human | Colorectum | FAP | 9.76e-19 | -4.21e-01 | -0.1294 |
| 5870 | RAB6A | A015-C-204 | Human | Colorectum | FAP | 5.51e-06 | -4.10e-01 | -0.0228 |
| 5870 | RAB6A | A014-C-040 | Human | Colorectum | FAP | 7.06e-04 | -5.07e-01 | -0.1184 |
| 5870 | RAB6A | A002-C-201 | Human | Colorectum | FAP | 2.20e-12 | -3.53e-01 | 0.0324 |
| 5870 | RAB6A | A002-C-203 | Human | Colorectum | FAP | 7.12e-03 | -2.57e-01 | 0.2786 |
| 5870 | RAB6A | A001-C-119 | Human | Colorectum | FAP | 3.67e-04 | -2.68e-01 | -0.1557 |
| 5870 | RAB6A | A001-C-108 | Human | Colorectum | FAP | 1.28e-14 | -3.75e-01 | -0.0272 |
| 5870 | RAB6A | A002-C-205 | Human | Colorectum | FAP | 8.22e-18 | -4.16e-01 | -0.1236 |
| 5870 | RAB6A | A001-C-104 | Human | Colorectum | FAP | 2.13e-02 | -2.62e-01 | 0.0184 |
| 5870 | RAB6A | A015-C-005 | Human | Colorectum | FAP | 4.61e-03 | -2.80e-01 | -0.0336 |
| 5870 | RAB6A | A015-C-006 | Human | Colorectum | FAP | 7.74e-14 | -4.23e-01 | -0.0994 |
| 5870 | RAB6A | A015-C-106 | Human | Colorectum | FAP | 6.38e-09 | -2.97e-01 | -0.0511 |
| 5870 | RAB6A | A002-C-114 | Human | Colorectum | FAP | 8.17e-16 | -4.87e-01 | -0.1561 |
| 5870 | RAB6A | A015-C-104 | Human | Colorectum | FAP | 7.54e-24 | -5.43e-01 | -0.1899 |
| 5870 | RAB6A | A001-C-014 | Human | Colorectum | FAP | 1.05e-08 | -3.09e-01 | 0.0135 |
| 5870 | RAB6A | A002-C-016 | Human | Colorectum | FAP | 3.26e-18 | -4.13e-01 | 0.0521 |
| 5870 | RAB6A | A015-C-002 | Human | Colorectum | FAP | 1.74e-10 | -3.94e-01 | -0.0763 |
| Page: 1 2 3 4 5 6 7 8 9 |
| Tissue | Expression Dynamics | Abbreviation |
| Colorectum (GSE201348) |  | FAP: Familial adenomatous polyposis |
| CRC: Colorectal cancer | ||
| Colorectum (HTA11) | 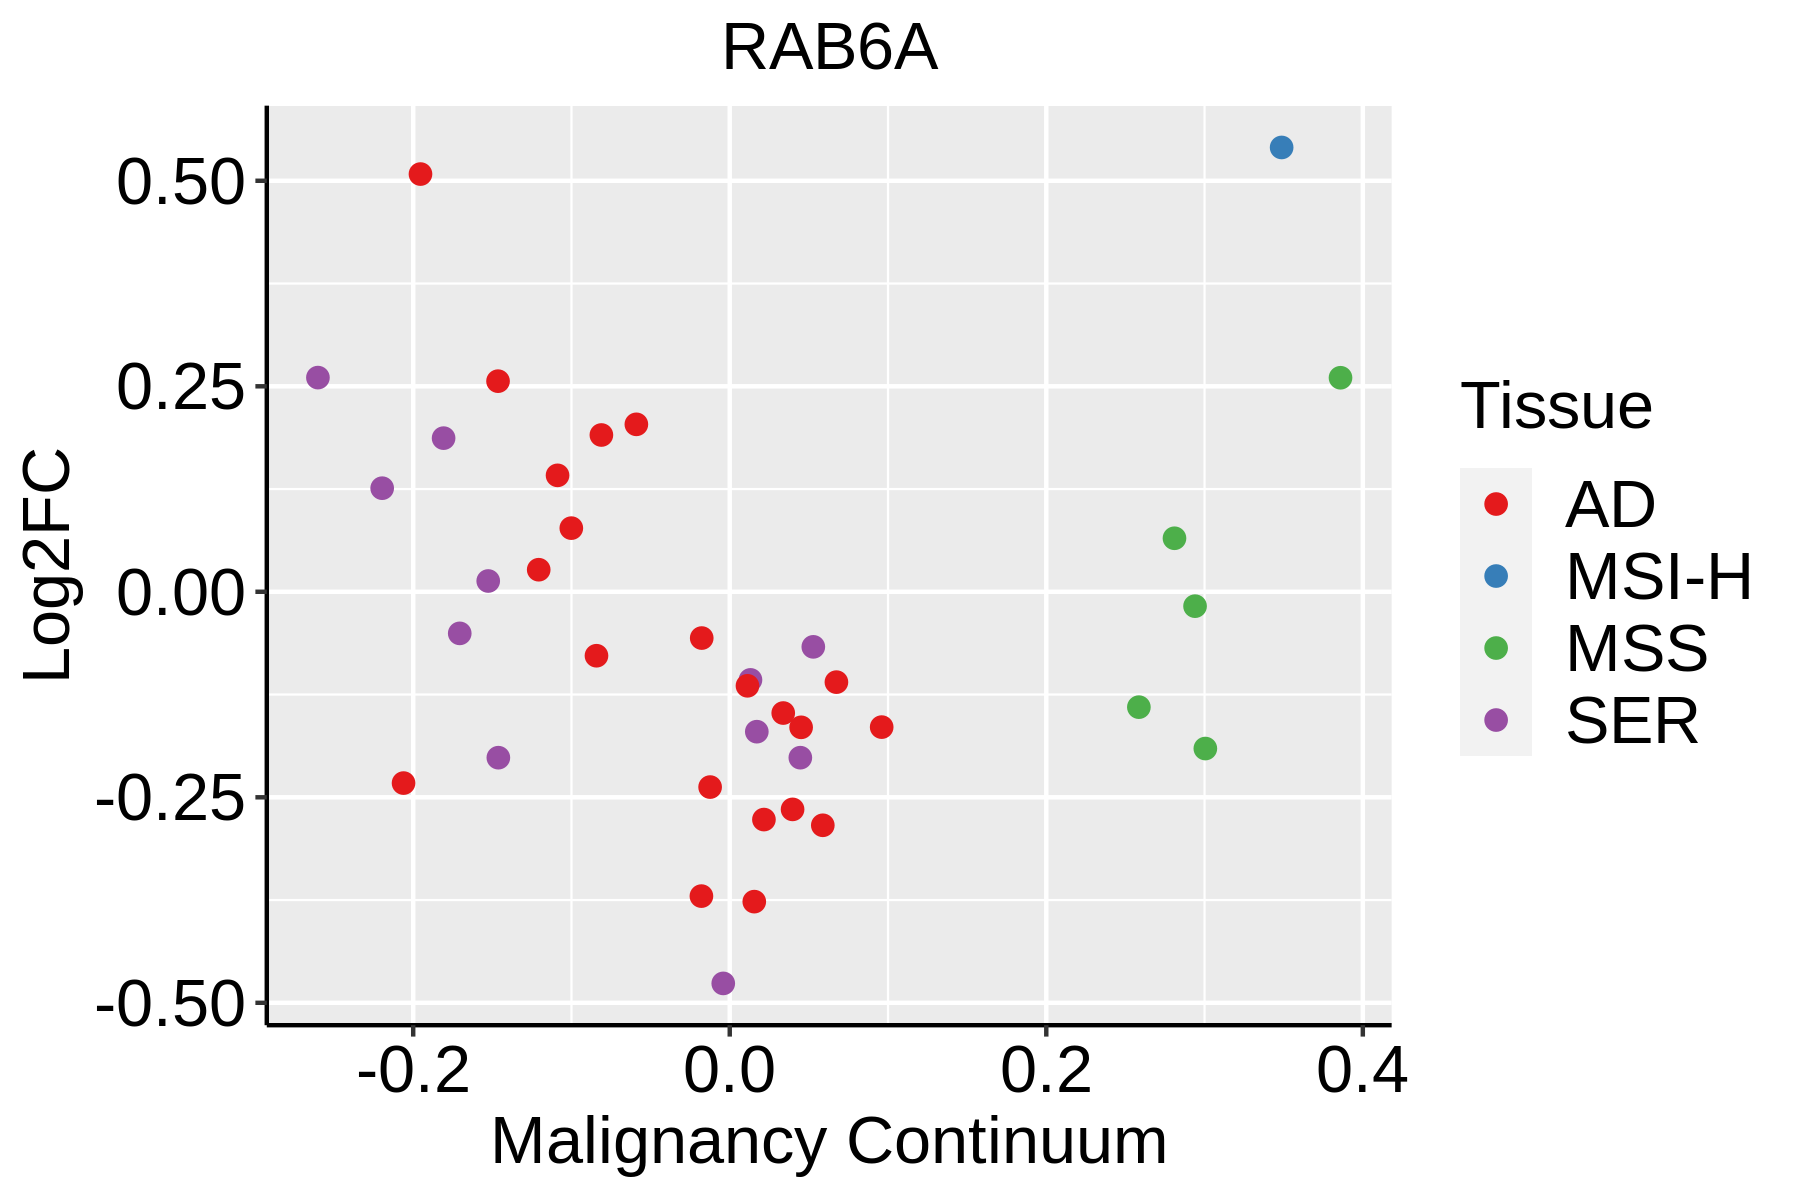 | AD: Adenomas |
| SER: Sessile serrated lesions | ||
| MSI-H: Microsatellite-high colorectal cancer | ||
| MSS: Microsatellite stable colorectal cancer | ||
| Esophagus | 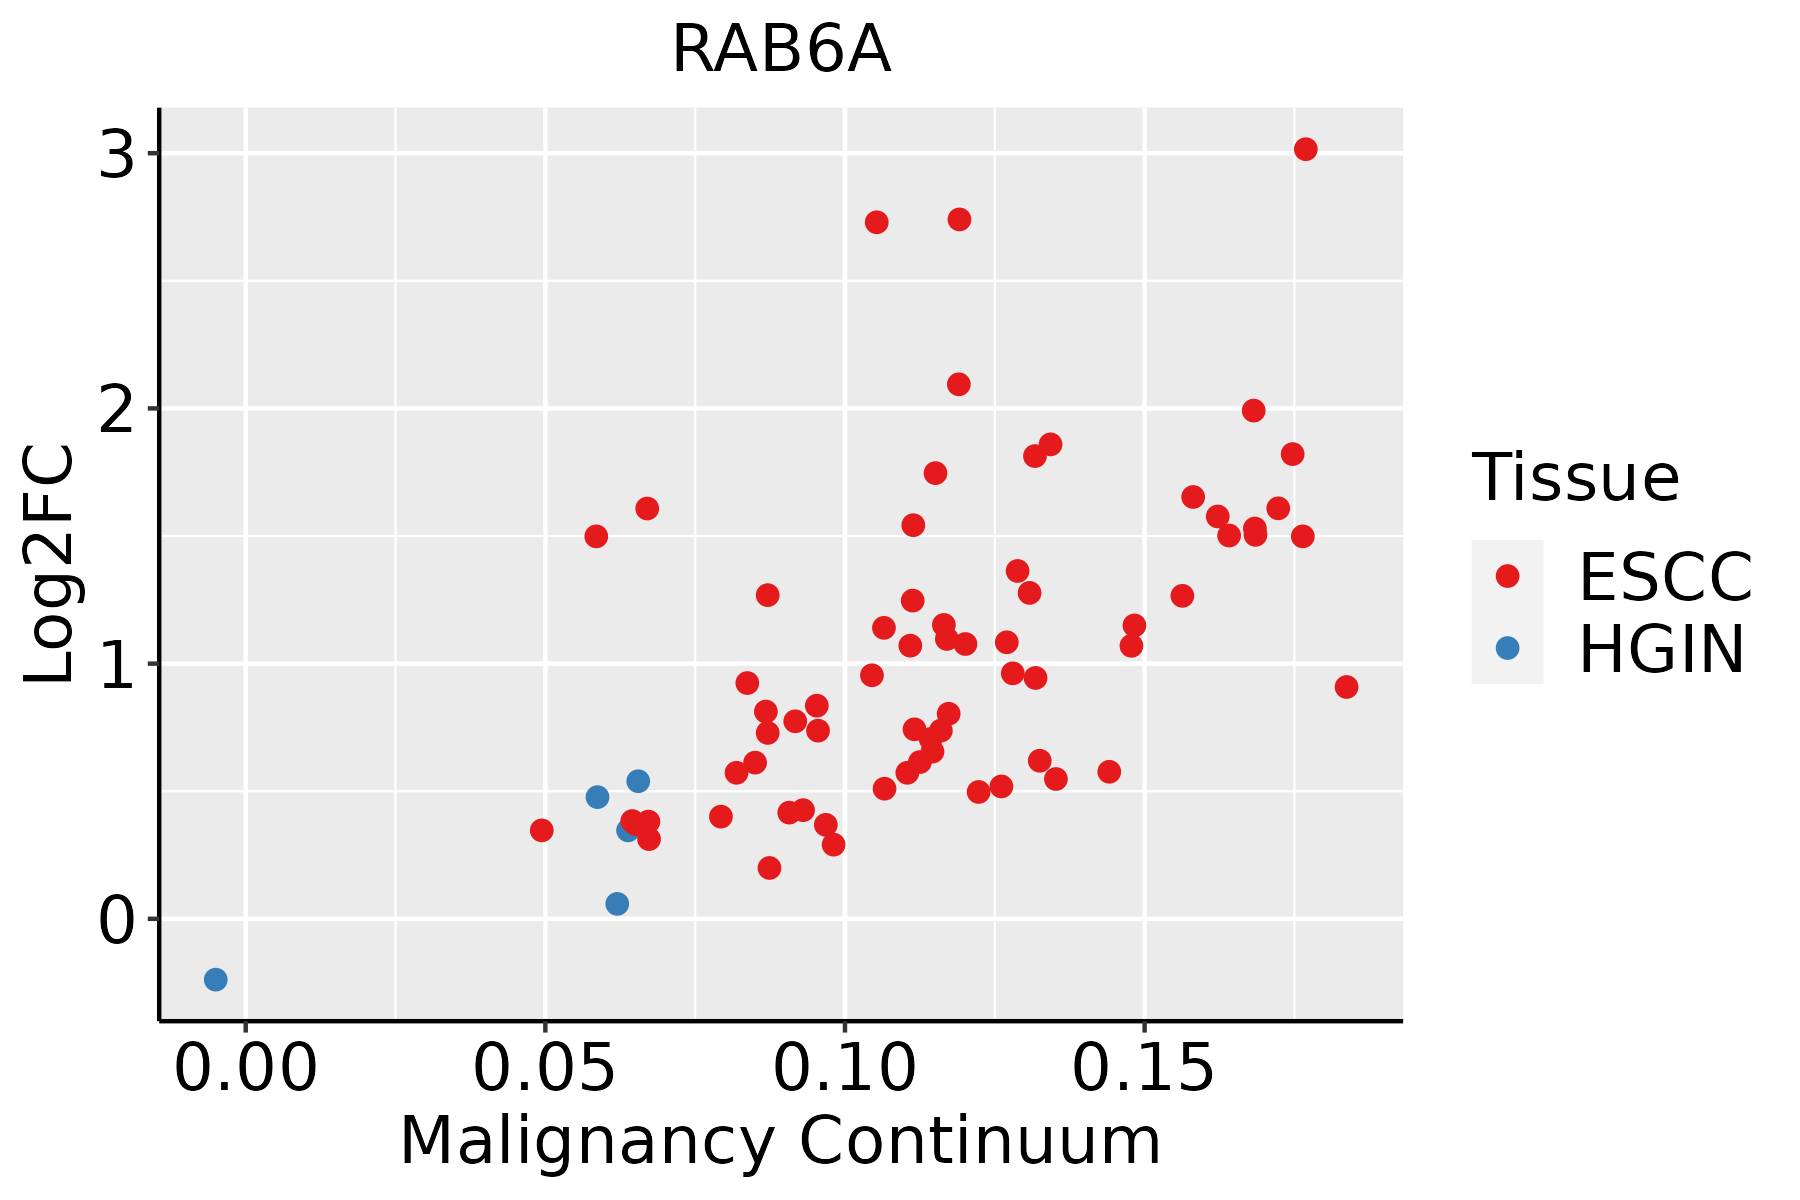 | ESCC: Esophageal squamous cell carcinoma |
| HGIN: High-grade intraepithelial neoplasias | ||
| LGIN: Low-grade intraepithelial neoplasias | ||
| Liver | 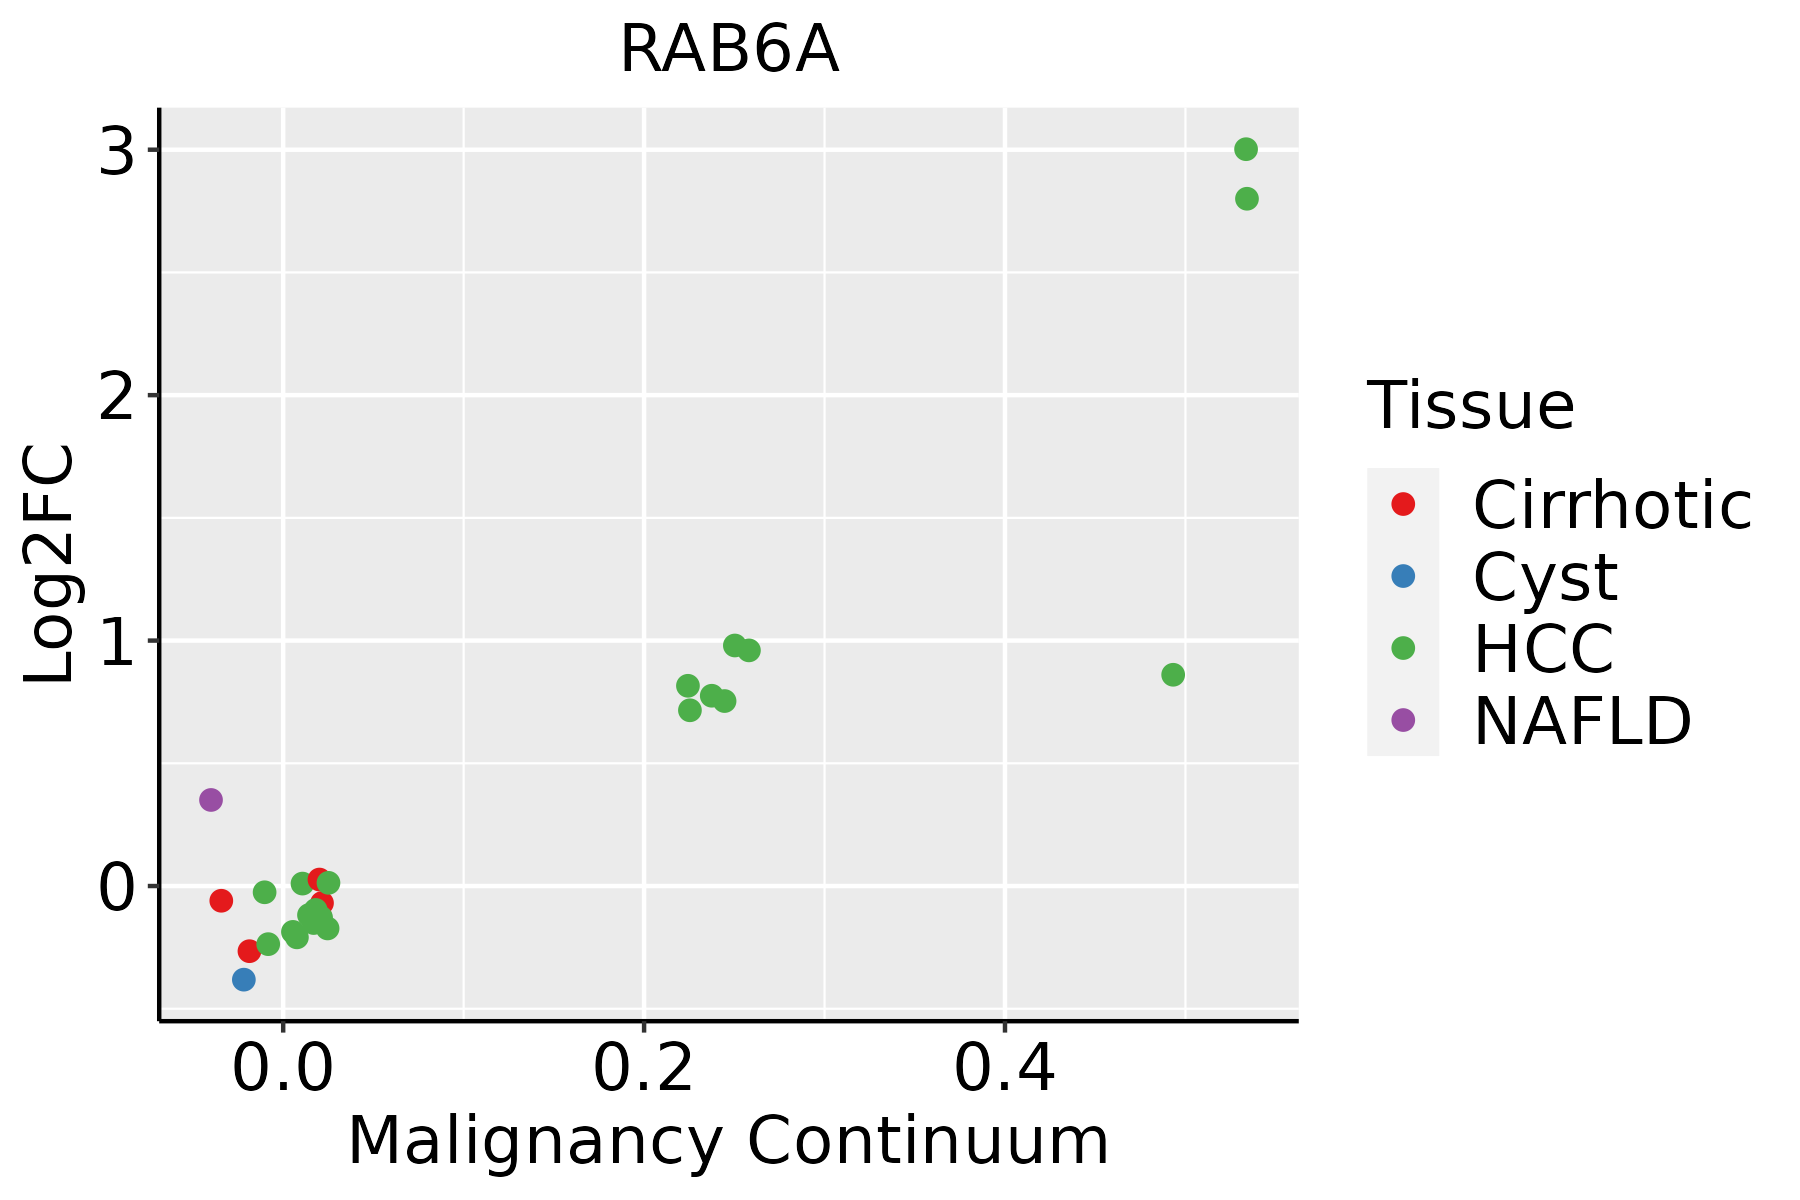 | HCC: Hepatocellular carcinoma |
| NAFLD: Non-alcoholic fatty liver disease | ||
| Oral Cavity | 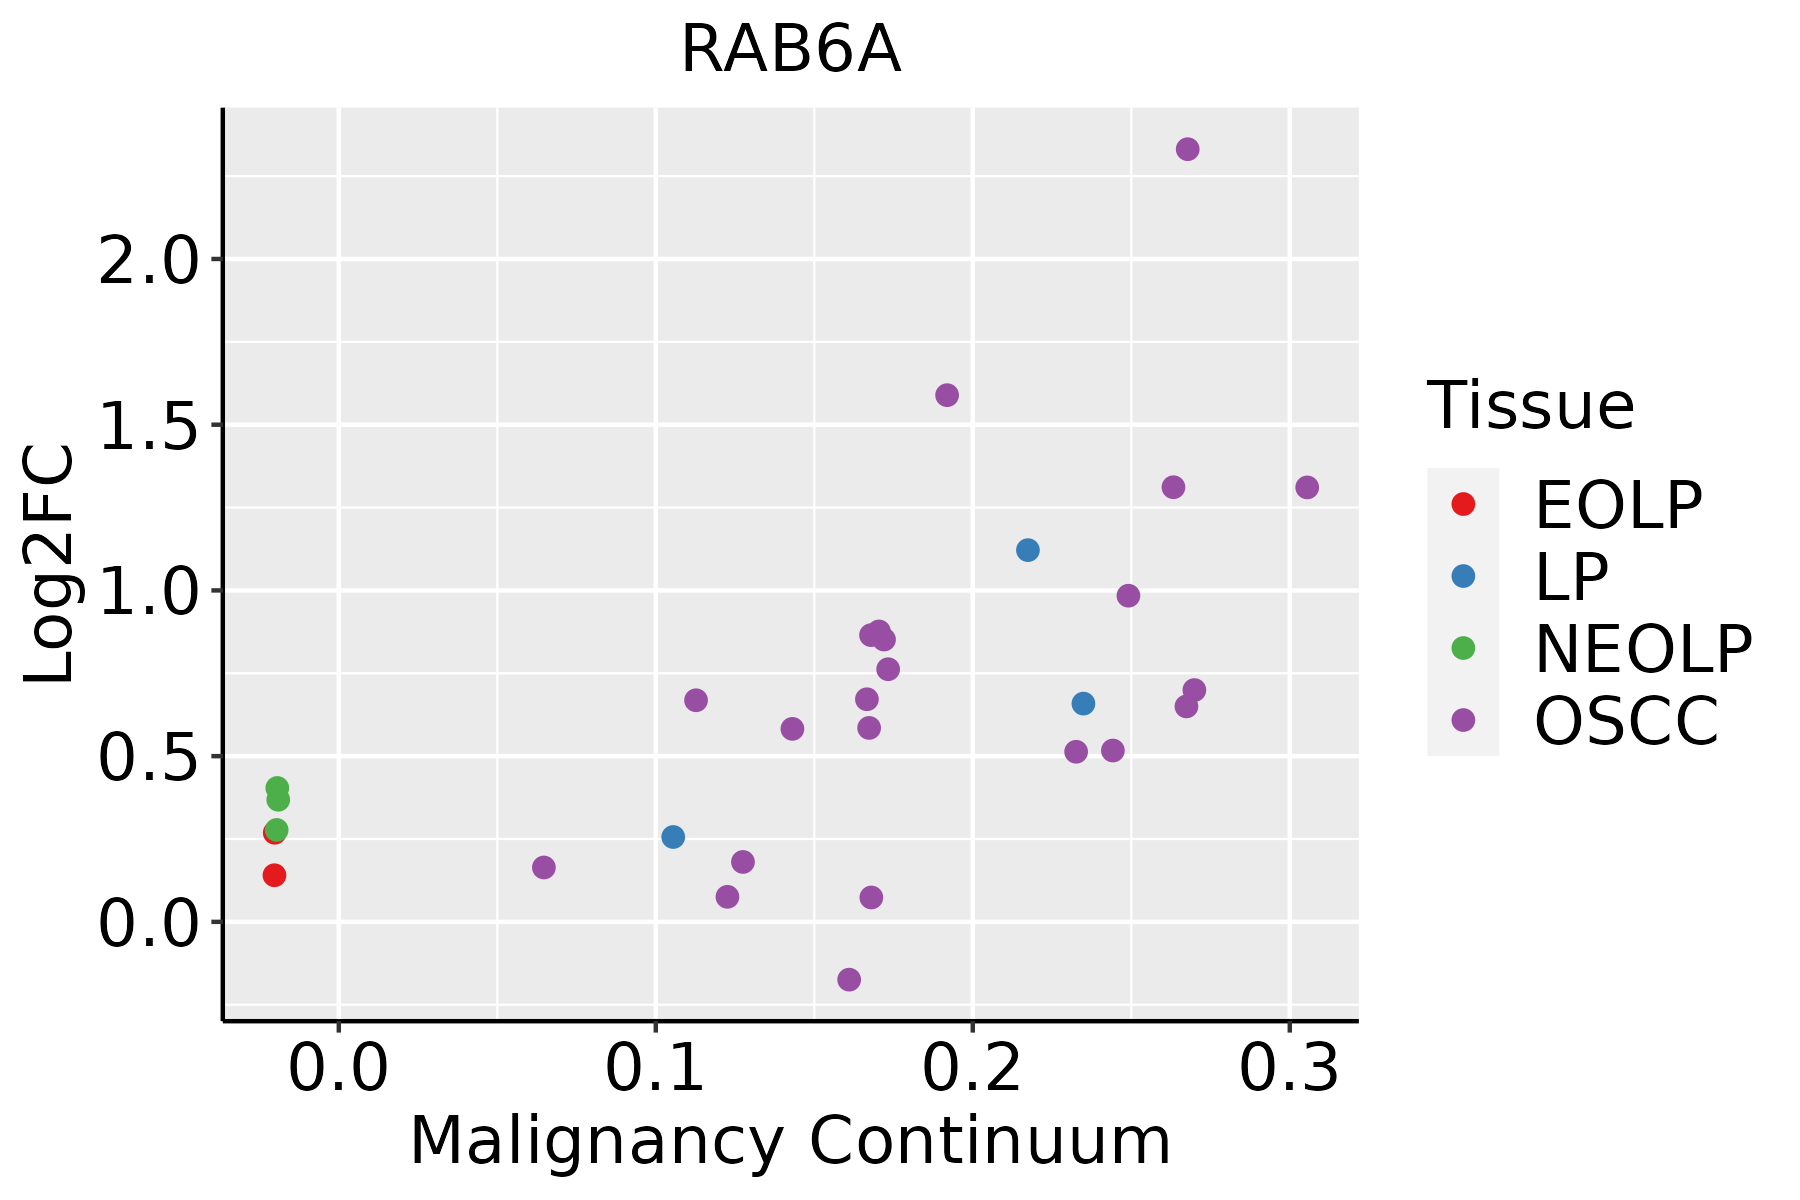 | EOLP: Erosive Oral lichen planus |
| LP: leukoplakia | ||
| NEOLP: Non-erosive oral lichen planus | ||
| OSCC: Oral squamous cell carcinoma | ||
| Prostate |  | BPH: Benign Prostatic Hyperplasia |
| Skin |  | AK: Actinic keratosis |
| cSCC: Cutaneous squamous cell carcinoma | ||
| SCCIS:squamous cell carcinoma in situ | ||
| Thyroid | 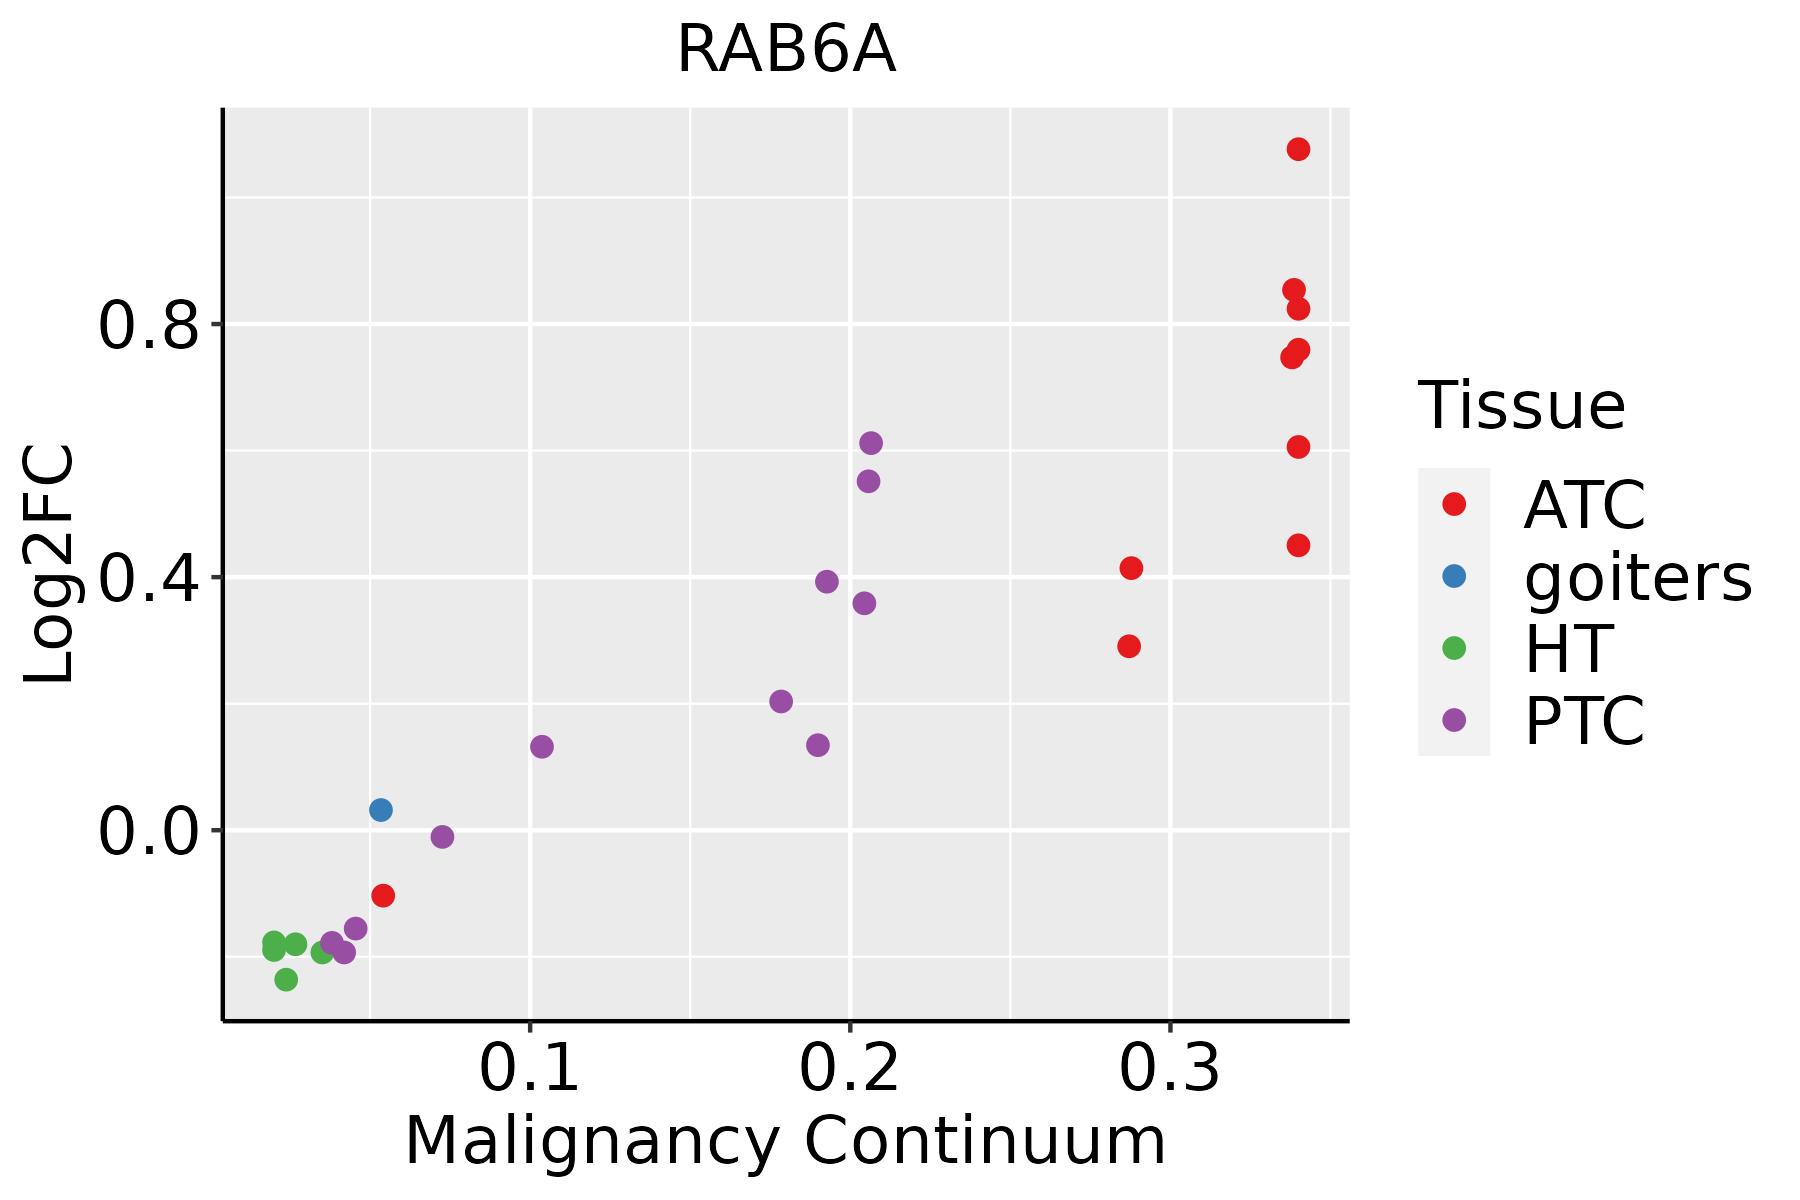 | ATC: Anaplastic thyroid cancer |
| HT: Hashimoto's thyroiditis | ||
| PTC: Papillary thyroid cancer |
| ∗log2FC in expression of this searched gene in stem-like cells from each diseased tissue sample relative to stem-like cells in normal samples in each tissue plotted against the malignancy continuum. Samples are colored based on if they are from different disease stage. |
Top |
Malignant transformation related pathway analysis |
| Find out the enriched GO biological processes and KEGG pathways involved in transition from healthy to precancer to cancer |
| Tissue | Disease Stage | Enriched GO biological Processes |
| Colorectum | AD |  |
| Colorectum | SER |  |
| Colorectum | MSS |  |
| Colorectum | MSI-H |  |
| Colorectum | FAP |  |
| ∗Top 15 enriched GO BP terms are showed in the bar plot of each disease state in each tissue. Each row represents a significant GO biological process which is colored according to the -log10(p.adjust). |
| Page: 1 2 3 4 5 6 7 8 9 |
| GO ID | Tissue | Disease Stage | Description | Gene Ratio | Bg Ratio | pvalue | p.adjust | Count |
| GO:0048193 | Colorectum | AD | Golgi vesicle transport | 109/3918 | 296/18723 | 1.80e-10 | 1.68e-08 | 109 |
| GO:0016197 | Colorectum | AD | endosomal transport | 90/3918 | 230/18723 | 1.88e-10 | 1.73e-08 | 90 |
| GO:0051656 | Colorectum | AD | establishment of organelle localization | 131/3918 | 390/18723 | 3.00e-09 | 2.06e-07 | 131 |
| GO:0016482 | Colorectum | AD | cytosolic transport | 68/3918 | 168/18723 | 6.00e-09 | 3.72e-07 | 68 |
| GO:0006890 | Colorectum | AD | retrograde vesicle-mediated transport, Golgi to endoplasmic reticulum | 27/3918 | 52/18723 | 7.67e-07 | 2.70e-05 | 27 |
| GO:0042147 | Colorectum | AD | retrograde transport, endosome to Golgi | 37/3918 | 91/18723 | 1.46e-05 | 3.14e-04 | 37 |
| GO:0030705 | Colorectum | AD | cytoskeleton-dependent intracellular transport | 60/3918 | 195/18723 | 7.56e-04 | 7.59e-03 | 60 |
| GO:0034067 | Colorectum | AD | protein localization to Golgi apparatus | 14/3918 | 29/18723 | 9.40e-04 | 8.92e-03 | 14 |
| GO:0072384 | Colorectum | AD | organelle transport along microtubule | 28/3918 | 85/18723 | 6.55e-03 | 4.07e-02 | 28 |
| GO:00516563 | Colorectum | FAP | establishment of organelle localization | 97/2622 | 390/18723 | 5.91e-09 | 9.48e-07 | 97 |
| GO:00481934 | Colorectum | FAP | Golgi vesicle transport | 77/2622 | 296/18723 | 2.86e-08 | 2.62e-06 | 77 |
| GO:00164823 | Colorectum | FAP | cytosolic transport | 47/2622 | 168/18723 | 1.58e-06 | 6.72e-05 | 47 |
| GO:00161973 | Colorectum | FAP | endosomal transport | 56/2622 | 230/18723 | 1.79e-05 | 4.53e-04 | 56 |
| GO:00307053 | Colorectum | FAP | cytoskeleton-dependent intracellular transport | 47/2622 | 195/18723 | 1.06e-04 | 1.76e-03 | 47 |
| GO:00068904 | Colorectum | FAP | retrograde vesicle-mediated transport, Golgi to endoplasmic reticulum | 18/2622 | 52/18723 | 1.48e-04 | 2.29e-03 | 18 |
| GO:00421472 | Colorectum | FAP | retrograde transport, endosome to Golgi | 26/2622 | 91/18723 | 2.21e-04 | 3.14e-03 | 26 |
| GO:00340671 | Colorectum | FAP | protein localization to Golgi apparatus | 11/2622 | 29/18723 | 1.20e-03 | 1.14e-02 | 11 |
| GO:00723841 | Colorectum | FAP | organelle transport along microtubule | 22/2622 | 85/18723 | 2.66e-03 | 2.07e-02 | 22 |
| GO:0006479 | Colorectum | FAP | protein methylation | 39/2622 | 181/18723 | 3.60e-03 | 2.58e-02 | 39 |
| GO:0008213 | Colorectum | FAP | protein alkylation | 39/2622 | 181/18723 | 3.60e-03 | 2.58e-02 | 39 |
| Page: 1 2 3 4 5 6 7 8 9 10 11 12 |
| Pathway ID | Tissue | Disease Stage | Description | Gene Ratio | Bg Ratio | pvalue | p.adjust | qvalue | Count |
| Page: 1 |
Top |
Cell-cell communication analysis |
| Identification of potential cell-cell interactions between two cell types and their ligand-receptor pairs for different disease states |
| Ligand | Receptor | LRpair | Pathway | Tissue | Disease Stage |
| Page: 1 |
Top |
Single-cell gene regulatory network inference analysis |
| Find out the significant the regulons (TFs) and the target genes of each regulon across cell types for different disease states |
| TF | Cell Type | Tissue | Disease Stage | Target Gene | RSS | Regulon Activity |
| ∗The dot plots of a searched regulon are shown for all cell subpopulations in each disease state of each tissue based on the regulon specific score inferred using pySCENIC and by calculating the average expression. |
| Page: 1 |
Top |
Somatic mutation of malignant transformation related genes |
| Annotation of somatic variants for genes involved in malignant transformation |
| Hugo Symbol | Variant Class | Variant Classification | dbSNP RS | HGVSc | HGVSp | HGVSp Short | SWISSPROT | BIOTYPE | SIFT | PolyPhen | Tumor Sample Barcode | Tissue | Histology | Sex | Age | Stage | Therapy Types | Drugs | Outcome |
| RAB6A | SNV | Missense_Mutation | novel | c.536N>A | p.Ser179Asn | p.S179N | P20340 | protein_coding | tolerated(0.44) | benign(0.005) | TCGA-AN-A046-01 | Breast | breast invasive carcinoma | Female | >=65 | I/II | Unknown | Unknown | SD |
| RAB6A | SNV | Missense_Mutation | c.335N>C | p.Arg112Thr | p.R112T | P20340 | protein_coding | deleterious(0) | probably_damaging(0.976) | TCGA-D8-A1JA-01 | Breast | breast invasive carcinoma | Female | <65 | III/IV | Chemotherapy | adriamycin | PD | |
| RAB6A | SNV | Missense_Mutation | c.281N>C | p.Asp94Ala | p.D94A | P20340 | protein_coding | deleterious(0.01) | possibly_damaging(0.787) | TCGA-D8-A1JA-01 | Breast | breast invasive carcinoma | Female | <65 | III/IV | Chemotherapy | adriamycin | PD | |
| RAB6A | SNV | Missense_Mutation | novel | c.430A>C | p.Lys144Gln | p.K144Q | P20340 | protein_coding | deleterious(0.03) | benign(0.103) | TCGA-E2-A14N-01 | Breast | breast invasive carcinoma | Female | <65 | I/II | Chemotherapy | cyclophosphamide | SD |
| RAB6A | SNV | Missense_Mutation | novel | c.429G>T | p.Arg143Ser | p.R143S | P20340 | protein_coding | tolerated(0.35) | benign(0.007) | TCGA-E2-A14N-01 | Breast | breast invasive carcinoma | Female | <65 | I/II | Chemotherapy | cyclophosphamide | SD |
| RAB6A | SNV | Missense_Mutation | c.172G>C | p.Glu58Gln | p.E58Q | P20340 | protein_coding | deleterious(0) | benign(0.164) | TCGA-EK-A2RJ-01 | Cervix | cervical & endocervical cancer | Female | <65 | I/II | Unknown | Unknown | SD | |
| RAB6A | insertion | Frame_Shift_Ins | novel | c.225_226insG | p.Arg76AlafsTer2 | p.R76Afs*2 | P20340 | protein_coding | TCGA-C5-A1BJ-01 | Cervix | cervical & endocervical cancer | Female | <65 | I/II | Unknown | Unknown | SD | ||
| RAB6A | deletion | Frame_Shift_Del | novel | c.312_313delTA | p.Thr105LysfsTer4 | p.T105Kfs*4 | P20340 | protein_coding | TCGA-DS-A1OD-01 | Cervix | cervical & endocervical cancer | Female | <65 | I/II | Chemotherapy | cisplatin | SD | ||
| RAB6A | SNV | Missense_Mutation | c.440N>C | p.Glu147Ala | p.E147A | P20340 | protein_coding | deleterious(0.02) | benign(0.049) | TCGA-AA-3713-01 | Colorectum | colon adenocarcinoma | Male | >=65 | III/IV | Chemotherapy | 5-fluorouracil | PR | |
| RAB6A | SNV | Missense_Mutation | c.572N>C | p.Ile191Thr | p.I191T | P20340 | protein_coding | deleterious(0.03) | benign(0.255) | TCGA-AA-A01R-01 | Colorectum | colon adenocarcinoma | Male | <65 | III/IV | Chemotherapy | 5-fluorouracil | PD |
| Page: 1 2 |
Top |
Related drugs of malignant transformation related genes |
| Identification of chemicals and drugs interact with genes involved in malignant transfromation |
| (DGIdb 4.0) |
| Entrez ID | Symbol | Category | Interaction Types | Drug Claim Name | Drug Name | PMIDs |
| Page: 1 |

Copyright 2023-Present -The University of Texas Health Science Center at Houston |