
|
|||||
|
 | |
| |
| |
| |
| |
| |
|
Gene: RAB42 |
Gene summary for RAB42 |
| Gene information | Species | Human | Gene symbol | RAB42 | Gene ID | 115273 |
| Gene name | RAB42, member RAS oncogene family | |
| Gene Alias | RAB42 | |
| Cytomap | 1p35.3 | |
| Gene Type | protein-coding | GO ID | GO:0007154 | UniProtAcc | Q8N4Z0 |
Top |
Malignant transformation analysis |
| Identification of the aberrant gene expression in precancerous and cancerous lesions by comparing the gene expression of stem-like cells in diseased tissues with normal stem cells |
| Entrez ID | Symbol | Replicates | Species | Organ | Tissue | Adj P-value | Log2FC | Malignancy |
| 115273 | RAB42 | HCC1 | Human | Liver | HCC | 6.11e-05 | 9.87e-01 | 0.5336 |
| 115273 | RAB42 | HCC2 | Human | Liver | HCC | 8.75e-16 | 1.19e+00 | 0.5341 |
| 115273 | RAB42 | HCC5 | Human | Liver | HCC | 2.68e-10 | 9.82e-01 | 0.4932 |
| 115273 | RAB42 | S014 | Human | Liver | HCC | 2.48e-12 | 5.55e-01 | 0.2254 |
| 115273 | RAB42 | S015 | Human | Liver | HCC | 2.05e-09 | 5.62e-01 | 0.2375 |
| 115273 | RAB42 | S016 | Human | Liver | HCC | 2.04e-18 | 6.31e-01 | 0.2243 |
| Page: 1 |
| Tissue | Expression Dynamics | Abbreviation |
| Liver | 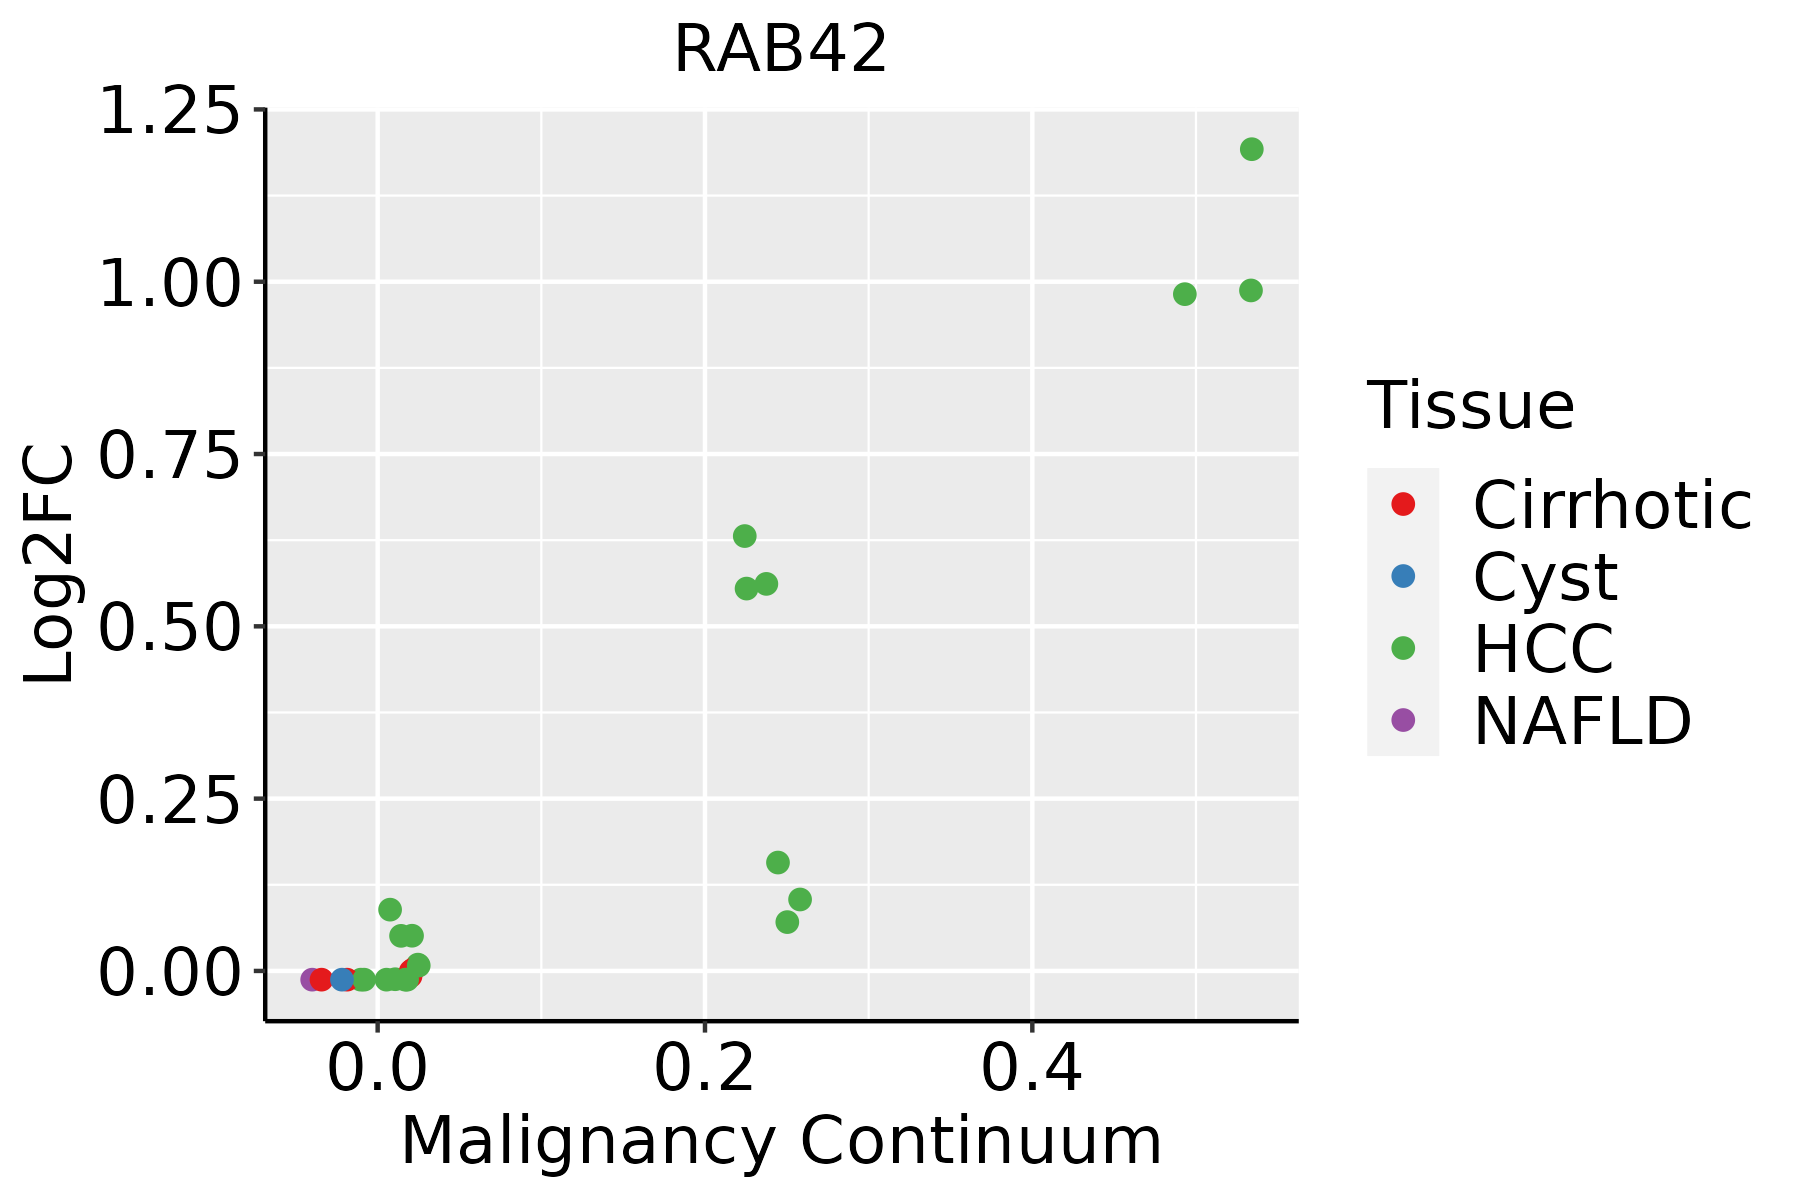 | HCC: Hepatocellular carcinoma |
| NAFLD: Non-alcoholic fatty liver disease |
| ∗log2FC in expression of this searched gene in stem-like cells from each diseased tissue sample relative to stem-like cells in normal samples in each tissue plotted against the malignancy continuum. Samples are colored based on if they are from different disease stage. |
Top |
Malignant transformation related pathway analysis |
| Find out the enriched GO biological processes and KEGG pathways involved in transition from healthy to precancer to cancer |
| Tissue | Disease Stage | Enriched GO biological Processes |
| Colorectum | AD |  |
| Colorectum | SER |  |
| Colorectum | MSS |  |
| Colorectum | MSI-H |  |
| Colorectum | FAP |  |
| ∗Top 15 enriched GO BP terms are showed in the bar plot of each disease state in each tissue. Each row represents a significant GO biological process which is colored according to the -log10(p.adjust). |
| Page: 1 2 3 4 5 6 7 8 9 |
| GO ID | Tissue | Disease Stage | Description | Gene Ratio | Bg Ratio | pvalue | p.adjust | Count |
| GO:000726521 | Liver | HCC | Ras protein signal transduction | 187/7958 | 337/18723 | 8.89e-07 | 1.35e-05 | 187 |
| Page: 1 |
| Pathway ID | Tissue | Disease Stage | Description | Gene Ratio | Bg Ratio | pvalue | p.adjust | qvalue | Count |
| Page: 1 |
Top |
Cell-cell communication analysis |
| Identification of potential cell-cell interactions between two cell types and their ligand-receptor pairs for different disease states |
| Ligand | Receptor | LRpair | Pathway | Tissue | Disease Stage |
| Page: 1 |
Top |
Single-cell gene regulatory network inference analysis |
| Find out the significant the regulons (TFs) and the target genes of each regulon across cell types for different disease states |
| TF | Cell Type | Tissue | Disease Stage | Target Gene | RSS | Regulon Activity |
| ∗The dot plots of a searched regulon are shown for all cell subpopulations in each disease state of each tissue based on the regulon specific score inferred using pySCENIC and by calculating the average expression. |
| Page: 1 |
Top |
Somatic mutation of malignant transformation related genes |
| Annotation of somatic variants for genes involved in malignant transformation |
| Hugo Symbol | Variant Class | Variant Classification | dbSNP RS | HGVSc | HGVSp | HGVSp Short | SWISSPROT | BIOTYPE | SIFT | PolyPhen | Tumor Sample Barcode | Tissue | Histology | Sex | Age | Stage | Therapy Types | Drugs | Outcome |
| RAB42 | SNV | Missense_Mutation | c.17N>A | p.Pro6Gln | p.P6Q | Q8N4Z0 | protein_coding | deleterious(0.01) | probably_damaging(0.961) | TCGA-B6-A0WX-01 | Breast | breast invasive carcinoma | Female | <65 | III/IV | Unknown | Unknown | PD | |
| RAB42 | SNV | Missense_Mutation | rs530073440 | c.127G>A | p.Val43Met | p.V43M | Q8N4Z0 | protein_coding | tolerated(0.52) | benign(0.05) | TCGA-AA-A022-01 | Colorectum | colon adenocarcinoma | Female | >=65 | I/II | Unknown | Unknown | SD |
| RAB42 | SNV | Missense_Mutation | novel | c.51N>C | p.Lys17Asn | p.K17N | Q8N4Z0 | protein_coding | deleterious(0) | probably_damaging(0.999) | TCGA-A5-A2K7-01 | Endometrium | uterine corpus endometrioid carcinoma | Female | <65 | I/II | Chemotherapy | taxol | SD |
| RAB42 | SNV | Missense_Mutation | rs765050696 | c.181G>A | p.Ala61Thr | p.A61T | Q8N4Z0 | protein_coding | tolerated(1) | benign(0) | TCGA-AX-A2HD-01 | Endometrium | uterine corpus endometrioid carcinoma | Female | >=65 | III/IV | Unknown | Unknown | SD |
| RAB42 | insertion | Frame_Shift_Ins | rs753536519 | c.235_236insG | p.Val82CysfsTer38 | p.V82Cfs*38 | Q8N4Z0 | protein_coding | TCGA-4R-AA8I-01 | Liver | liver hepatocellular carcinoma | Male | >=65 | I/II | Unknown | Unknown | PD | ||
| RAB42 | SNV | Missense_Mutation | rs765050696 | c.181G>A | p.Ala61Thr | p.A61T | Q8N4Z0 | protein_coding | tolerated(1) | benign(0) | TCGA-38-4632-01 | Lung | lung adenocarcinoma | Male | <65 | III/IV | Chemotherapy | gemcitabine | PD |
| RAB42 | SNV | Missense_Mutation | novel | c.241N>T | p.Gly81Cys | p.G81C | Q8N4Z0 | protein_coding | deleterious(0) | probably_damaging(0.991) | TCGA-43-A475-01 | Lung | lung squamous cell carcinoma | Female | >=65 | I/II | Chemotherapy | cisplatin | CR |
| RAB42 | SNV | Missense_Mutation | rs370099619 | c.94G>A | p.Glu32Lys | p.E32K | Q8N4Z0 | protein_coding | tolerated(0.05) | benign(0.102) | TCGA-96-A4JK-01 | Lung | lung squamous cell carcinoma | Male | >=65 | I/II | Chemotherapy | gemcitabine | CR |
| RAB42 | SNV | Missense_Mutation | novel | c.258N>A | p.His86Gln | p.H86Q | Q8N4Z0 | protein_coding | tolerated(0.21) | benign(0) | TCGA-MX-A5UJ-01 | Stomach | stomach adenocarcinoma | Female | >=65 | III/IV | Unknown | Unknown | SD |
| RAB42 | insertion | Frame_Shift_Ins | rs753536519 | c.235_236insG | p.Val82CysfsTer38 | p.V82Cfs*38 | Q8N4Z0 | protein_coding | TCGA-D7-A6EY-01 | Stomach | stomach adenocarcinoma | Female | >=65 | III/IV | Unknown | Unknown | PD |
| Page: 1 |
Top |
Related drugs of malignant transformation related genes |
| Identification of chemicals and drugs interact with genes involved in malignant transfromation |
| (DGIdb 4.0) |
| Entrez ID | Symbol | Category | Interaction Types | Drug Claim Name | Drug Name | PMIDs |
| Page: 1 |

Copyright 2023-Present -The University of Texas Health Science Center at Houston |