
|
|||||
|
 | |
| |
| |
| |
| |
| |
|
Gene: RAB40C |
Gene summary for RAB40C |
| Gene information | Species | Human | Gene symbol | RAB40C | Gene ID | 57799 |
| Gene name | RAB40C, member RAS oncogene family | |
| Gene Alias | RARL | |
| Cytomap | 16p13.3 | |
| Gene Type | protein-coding | GO ID | GO:0006464 | UniProtAcc | Q96S21 |
Top |
Malignant transformation analysis |
| Identification of the aberrant gene expression in precancerous and cancerous lesions by comparing the gene expression of stem-like cells in diseased tissues with normal stem cells |
| Entrez ID | Symbol | Replicates | Species | Organ | Tissue | Adj P-value | Log2FC | Malignancy |
| 57799 | RAB40C | CCI_1 | Human | Cervix | CC | 2.19e-09 | 5.56e-01 | 0.528 |
| 57799 | RAB40C | CCI_2 | Human | Cervix | CC | 1.48e-08 | 7.02e-01 | 0.5249 |
| 57799 | RAB40C | CCI_3 | Human | Cervix | CC | 9.54e-07 | 4.58e-01 | 0.516 |
| 57799 | RAB40C | LZE4T | Human | Esophagus | ESCC | 6.15e-03 | 1.13e-01 | 0.0811 |
| 57799 | RAB40C | LZE7T | Human | Esophagus | ESCC | 5.53e-03 | 1.40e-01 | 0.0667 |
| 57799 | RAB40C | LZE20T | Human | Esophagus | ESCC | 7.86e-08 | 2.53e-01 | 0.0662 |
| 57799 | RAB40C | LZE21D1 | Human | Esophagus | HGIN | 1.97e-05 | 3.76e-01 | 0.0632 |
| 57799 | RAB40C | LZE22D1 | Human | Esophagus | HGIN | 1.17e-02 | 1.44e-01 | 0.0595 |
| 57799 | RAB40C | LZE24T | Human | Esophagus | ESCC | 1.73e-11 | 2.73e-01 | 0.0596 |
| 57799 | RAB40C | LZE21T | Human | Esophagus | ESCC | 5.76e-07 | 4.31e-01 | 0.0655 |
| 57799 | RAB40C | P1T-E | Human | Esophagus | ESCC | 1.99e-15 | 5.52e-01 | 0.0875 |
| 57799 | RAB40C | P2T-E | Human | Esophagus | ESCC | 3.84e-33 | 5.11e-01 | 0.1177 |
| 57799 | RAB40C | P4T-E | Human | Esophagus | ESCC | 1.46e-20 | 4.30e-01 | 0.1323 |
| 57799 | RAB40C | P5T-E | Human | Esophagus | ESCC | 2.99e-12 | 2.22e-01 | 0.1327 |
| 57799 | RAB40C | P8T-E | Human | Esophagus | ESCC | 3.32e-23 | 3.77e-01 | 0.0889 |
| 57799 | RAB40C | P9T-E | Human | Esophagus | ESCC | 1.11e-03 | 1.04e-01 | 0.1131 |
| 57799 | RAB40C | P10T-E | Human | Esophagus | ESCC | 5.08e-16 | 2.10e-01 | 0.116 |
| 57799 | RAB40C | P11T-E | Human | Esophagus | ESCC | 4.63e-06 | 3.04e-01 | 0.1426 |
| 57799 | RAB40C | P12T-E | Human | Esophagus | ESCC | 9.53e-29 | 5.92e-01 | 0.1122 |
| 57799 | RAB40C | P15T-E | Human | Esophagus | ESCC | 7.43e-26 | 5.65e-01 | 0.1149 |
| Page: 1 2 3 4 |
| Tissue | Expression Dynamics | Abbreviation |
| Cervix | 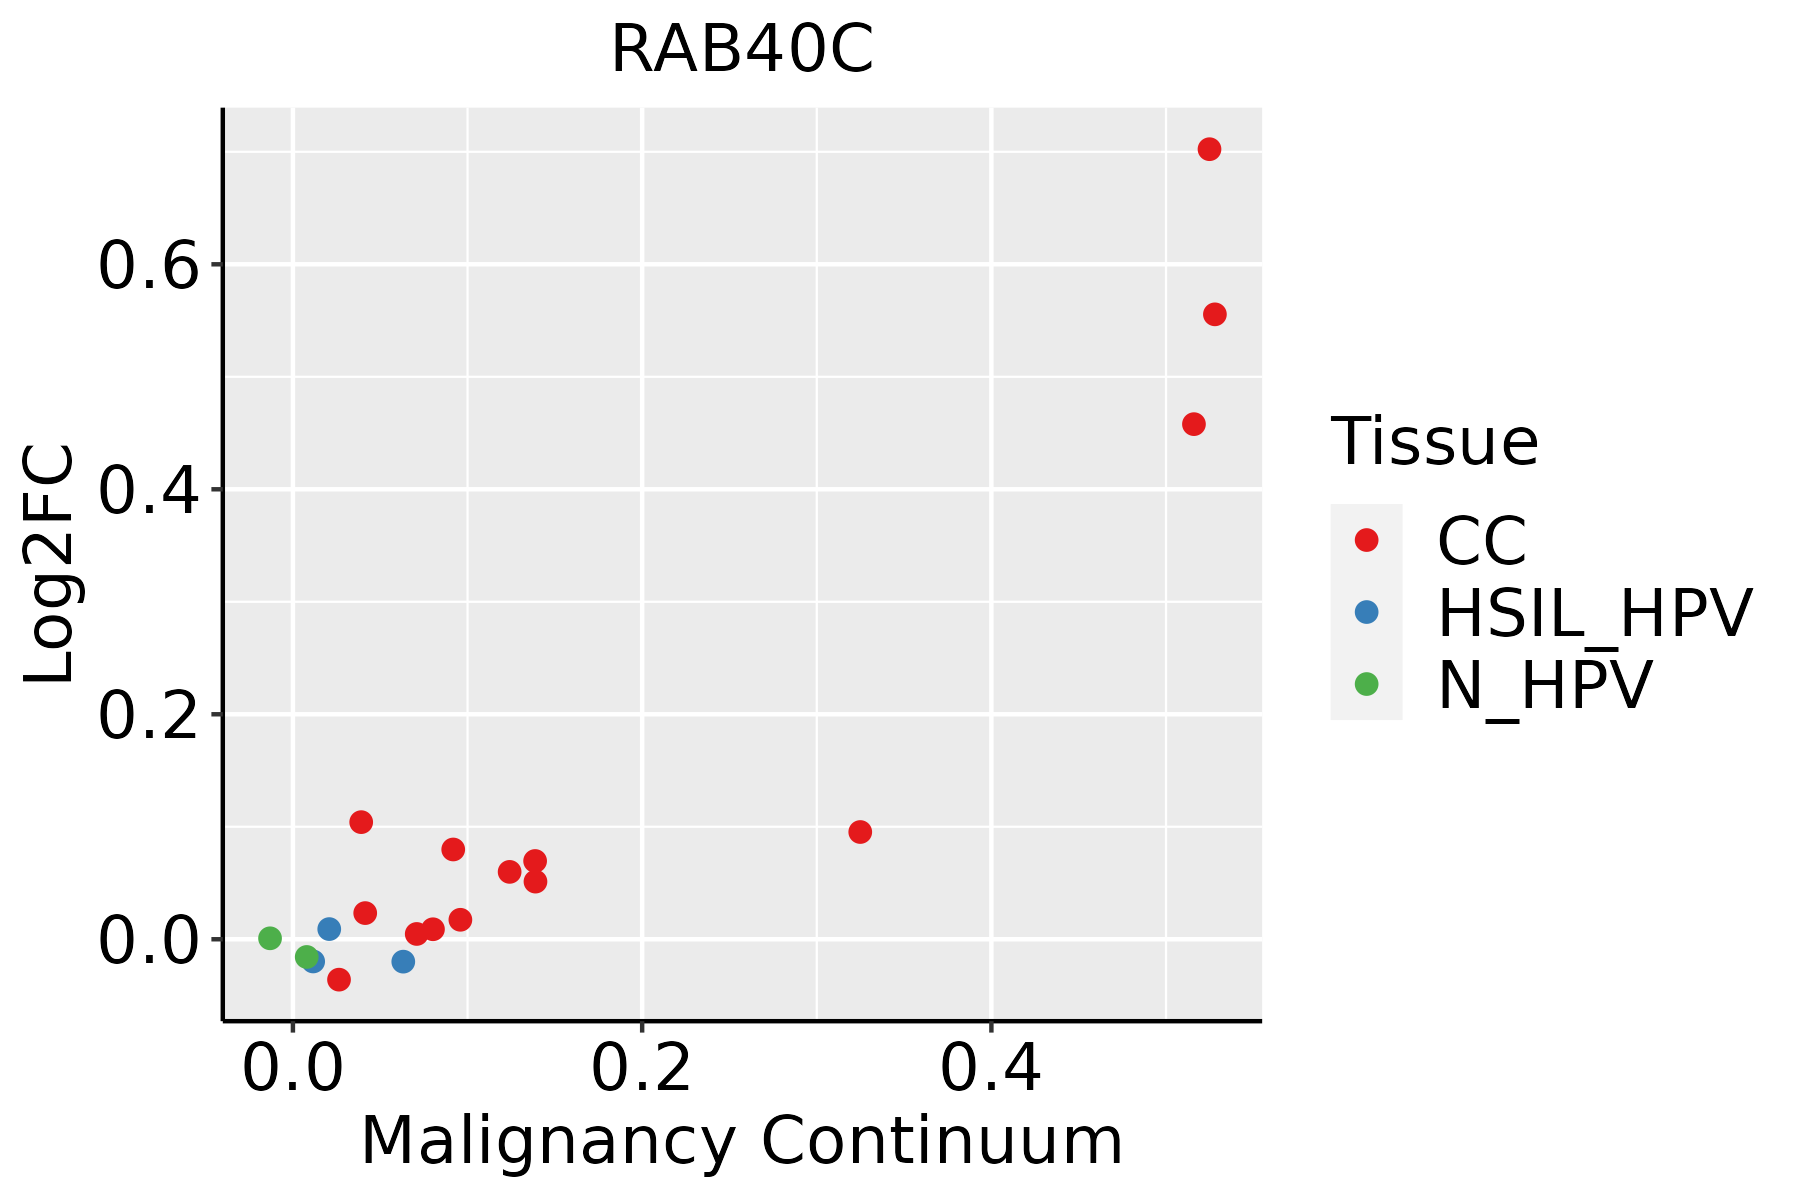 | CC: Cervix cancer |
| HSIL_HPV: HPV-infected high-grade squamous intraepithelial lesions | ||
| N_HPV: HPV-infected normal cervix | ||
| Esophagus |  | ESCC: Esophageal squamous cell carcinoma |
| HGIN: High-grade intraepithelial neoplasias | ||
| LGIN: Low-grade intraepithelial neoplasias | ||
| Oral Cavity | 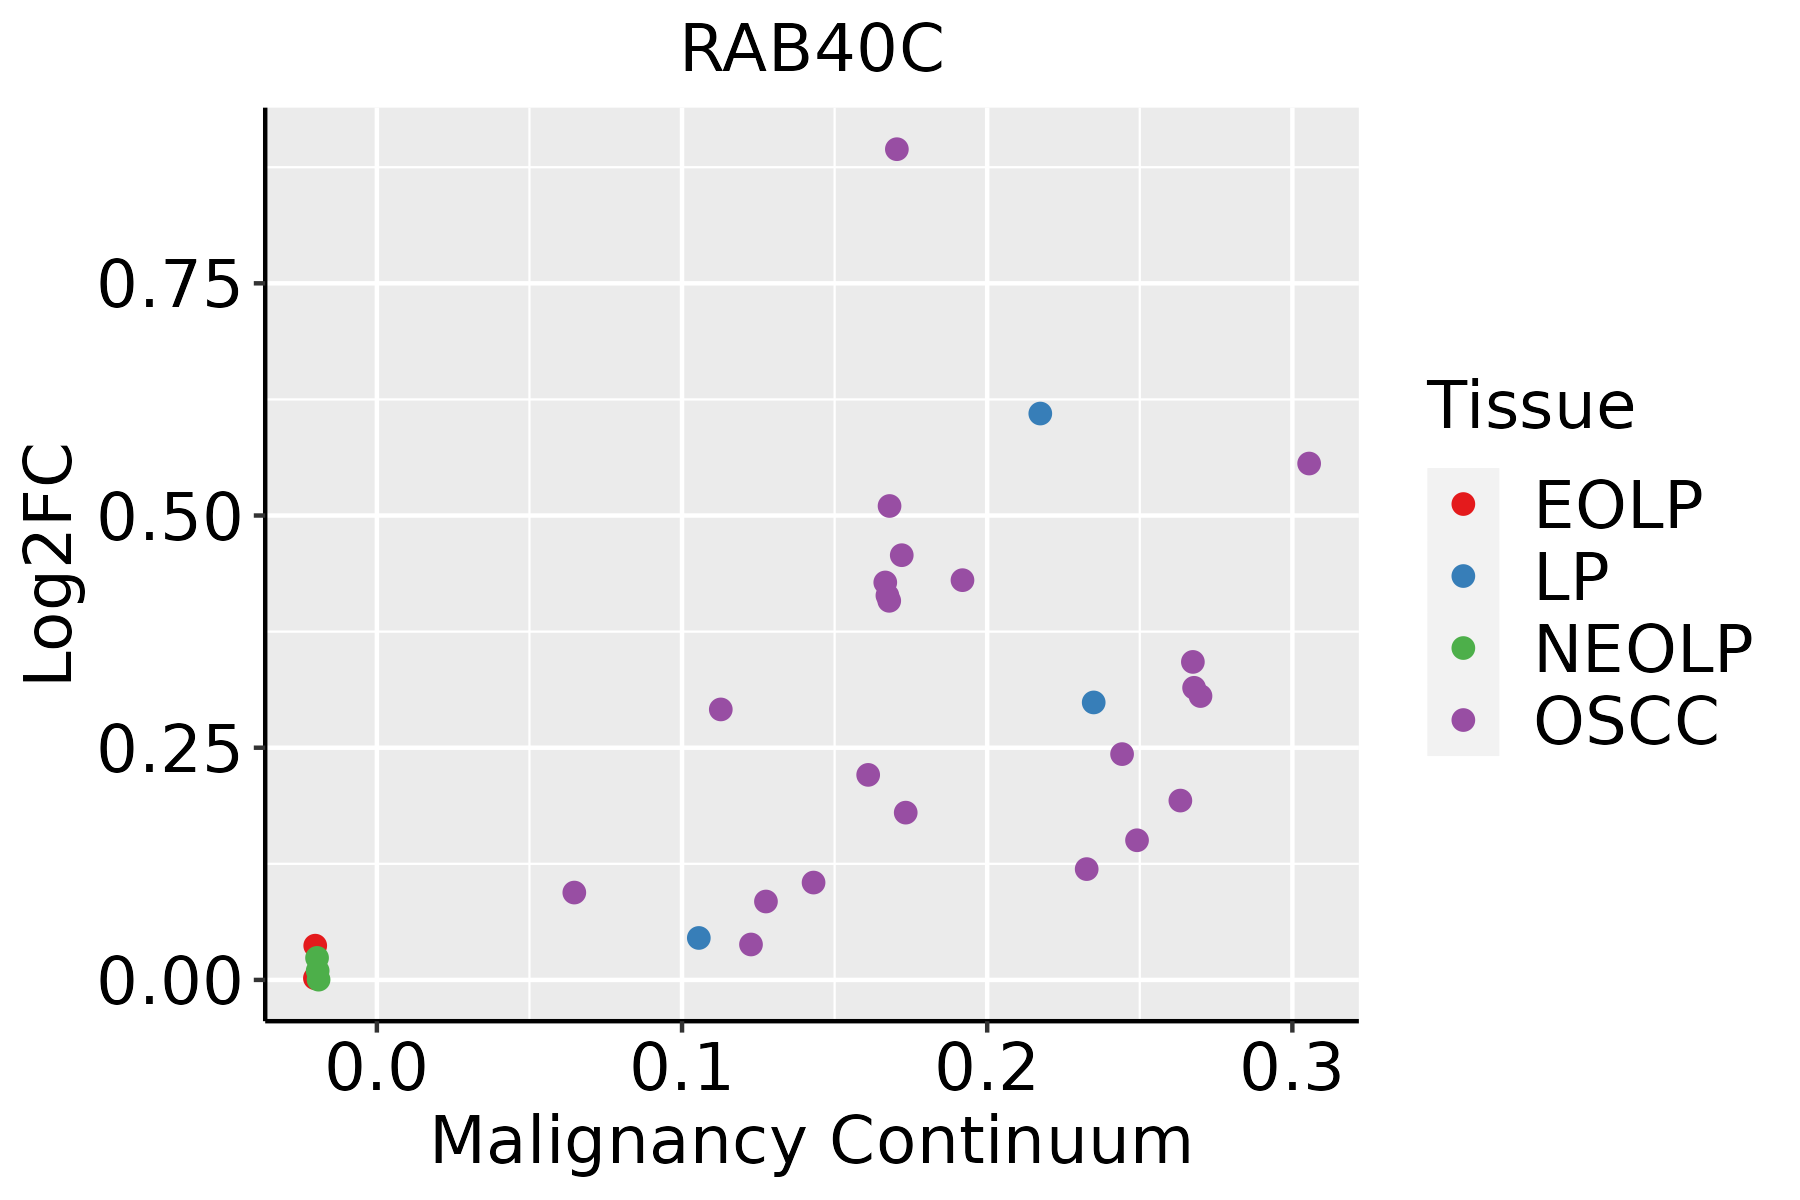 | EOLP: Erosive Oral lichen planus |
| LP: leukoplakia | ||
| NEOLP: Non-erosive oral lichen planus | ||
| OSCC: Oral squamous cell carcinoma |
| ∗log2FC in expression of this searched gene in stem-like cells from each diseased tissue sample relative to stem-like cells in normal samples in each tissue plotted against the malignancy continuum. Samples are colored based on if they are from different disease stage. |
Top |
Malignant transformation related pathway analysis |
| Find out the enriched GO biological processes and KEGG pathways involved in transition from healthy to precancer to cancer |
| Tissue | Disease Stage | Enriched GO biological Processes |
| Colorectum | AD |  |
| Colorectum | SER |  |
| Colorectum | MSS |  |
| Colorectum | MSI-H |  |
| Colorectum | FAP |  |
| ∗Top 15 enriched GO BP terms are showed in the bar plot of each disease state in each tissue. Each row represents a significant GO biological process which is colored according to the -log10(p.adjust). |
| Page: 1 2 3 4 5 6 7 8 9 |
| GO ID | Tissue | Disease Stage | Description | Gene Ratio | Bg Ratio | pvalue | p.adjust | Count |
| GO:007265910 | Cervix | CC | protein localization to plasma membrane | 73/2311 | 284/18723 | 4.95e-10 | 6.73e-08 | 73 |
| GO:19907788 | Cervix | CC | protein localization to cell periphery | 78/2311 | 333/18723 | 1.22e-08 | 9.73e-07 | 78 |
| GO:007265920 | Esophagus | HGIN | protein localization to plasma membrane | 66/2587 | 284/18723 | 1.11e-05 | 3.18e-04 | 66 |
| GO:199077818 | Esophagus | HGIN | protein localization to cell periphery | 71/2587 | 333/18723 | 1.05e-04 | 2.24e-03 | 71 |
| GO:0072659110 | Esophagus | ESCC | protein localization to plasma membrane | 193/8552 | 284/18723 | 1.95e-14 | 1.03e-12 | 193 |
| GO:199077819 | Esophagus | ESCC | protein localization to cell periphery | 217/8552 | 333/18723 | 4.08e-13 | 1.88e-11 | 217 |
| GO:007265918 | Oral cavity | OSCC | protein localization to plasma membrane | 169/7305 | 284/18723 | 1.69e-12 | 7.21e-11 | 169 |
| GO:199077816 | Oral cavity | OSCC | protein localization to cell periphery | 190/7305 | 333/18723 | 1.46e-11 | 5.13e-10 | 190 |
| Page: 1 |
| Pathway ID | Tissue | Disease Stage | Description | Gene Ratio | Bg Ratio | pvalue | p.adjust | qvalue | Count |
| Page: 1 |
Top |
Cell-cell communication analysis |
| Identification of potential cell-cell interactions between two cell types and their ligand-receptor pairs for different disease states |
| Ligand | Receptor | LRpair | Pathway | Tissue | Disease Stage |
| Page: 1 |
Top |
Single-cell gene regulatory network inference analysis |
| Find out the significant the regulons (TFs) and the target genes of each regulon across cell types for different disease states |
| TF | Cell Type | Tissue | Disease Stage | Target Gene | RSS | Regulon Activity |
| ∗The dot plots of a searched regulon are shown for all cell subpopulations in each disease state of each tissue based on the regulon specific score inferred using pySCENIC and by calculating the average expression. |
| Page: 1 |
Top |
Somatic mutation of malignant transformation related genes |
| Annotation of somatic variants for genes involved in malignant transformation |
| Hugo Symbol | Variant Class | Variant Classification | dbSNP RS | HGVSc | HGVSp | HGVSp Short | SWISSPROT | BIOTYPE | SIFT | PolyPhen | Tumor Sample Barcode | Tissue | Histology | Sex | Age | Stage | Therapy Types | Drugs | Outcome |
| RAB40C | insertion | Frame_Shift_Ins | rs769795950 | c.811dupC | p.Gln271ProfsTer7 | p.Q271Pfs*7 | Q96S21 | protein_coding | TCGA-BH-A18G-01 | Breast | breast invasive carcinoma | Female | >=65 | I/II | Unknown | Unknown | SD | ||
| RAB40C | SNV | Missense_Mutation | novel | c.493G>A | p.Glu165Lys | p.E165K | Q96S21 | protein_coding | tolerated(0.06) | probably_damaging(0.958) | TCGA-2W-A8YY-01 | Cervix | cervical & endocervical cancer | Female | <65 | I/II | Chemotherapy | cisplatin | CR |
| RAB40C | SNV | Missense_Mutation | c.361N>T | p.Arg121Trp | p.R121W | Q96S21 | protein_coding | deleterious(0) | probably_damaging(0.968) | TCGA-JW-A5VJ-01 | Cervix | cervical & endocervical cancer | Female | <65 | I/II | Unknown | Unknown | PD | |
| RAB40C | SNV | Missense_Mutation | c.58N>A | p.Val20Met | p.V20M | Q96S21 | protein_coding | deleterious(0) | probably_damaging(1) | TCGA-AA-3492-01 | Colorectum | colon adenocarcinoma | Female | >=65 | I/II | Unknown | Unknown | SD | |
| RAB40C | SNV | Missense_Mutation | c.425N>A | p.Arg142His | p.R142H | Q96S21 | protein_coding | deleterious(0.01) | possibly_damaging(0.575) | TCGA-AA-3815-01 | Colorectum | colon adenocarcinoma | Female | >=65 | I/II | Unknown | Unknown | SD | |
| RAB40C | SNV | Missense_Mutation | rs145997805 | c.751N>A | p.Gly251Ser | p.G251S | Q96S21 | protein_coding | tolerated_low_confidence(0.6) | benign(0) | TCGA-AU-6004-01 | Colorectum | colon adenocarcinoma | Female | >=65 | I/II | Unknown | Unknown | SD |
| RAB40C | insertion | Frame_Shift_Ins | rs769795950 | c.803_804insC | p.Gln271ProfsTer7 | p.Q271Pfs*7 | Q96S21 | protein_coding | TCGA-AD-6964-01 | Colorectum | colon adenocarcinoma | Male | <65 | III/IV | Chemotherapy | folfox | PD | ||
| RAB40C | SNV | Missense_Mutation | novel | c.311N>T | p.Gly104Val | p.G104V | Q96S21 | protein_coding | deleterious(0) | probably_damaging(0.999) | TCGA-AJ-A3BH-01 | Endometrium | uterine corpus endometrioid carcinoma | Female | Unknown | I/II | Unknown | Unknown | SD |
| RAB40C | SNV | Missense_Mutation | c.659N>A | p.Ser220Asn | p.S220N | Q96S21 | protein_coding | deleterious_low_confidence(0.03) | possibly_damaging(0.906) | TCGA-AP-A059-01 | Endometrium | uterine corpus endometrioid carcinoma | Female | >=65 | I/II | Unknown | Unknown | SD | |
| RAB40C | SNV | Missense_Mutation | c.520N>A | p.Val174Met | p.V174M | Q96S21 | protein_coding | deleterious(0.01) | probably_damaging(0.993) | TCGA-AP-A0LM-01 | Endometrium | uterine corpus endometrioid carcinoma | Female | <65 | III/IV | Chemotherapy | cisplatin | SD |
| Page: 1 2 3 4 |
Top |
Related drugs of malignant transformation related genes |
| Identification of chemicals and drugs interact with genes involved in malignant transfromation |
| (DGIdb 4.0) |
| Entrez ID | Symbol | Category | Interaction Types | Drug Claim Name | Drug Name | PMIDs |
| Page: 1 |

Copyright 2023-Present -The University of Texas Health Science Center at Houston |