
|
|||||
|
 | |
| |
| |
| |
| |
| |
|
Gene: RAB40B |
Gene summary for RAB40B |
| Gene information | Species | Human | Gene symbol | RAB40B | Gene ID | 10966 |
| Gene name | RAB40B, member RAS oncogene family | |
| Gene Alias | RAR | |
| Cytomap | 17q25.3 | |
| Gene Type | protein-coding | GO ID | GO:0006464 | UniProtAcc | Q12829 |
Top |
Malignant transformation analysis |
| Identification of the aberrant gene expression in precancerous and cancerous lesions by comparing the gene expression of stem-like cells in diseased tissues with normal stem cells |
| Entrez ID | Symbol | Replicates | Species | Organ | Tissue | Adj P-value | Log2FC | Malignancy |
| 10966 | RAB40B | LZE4T | Human | Esophagus | ESCC | 3.07e-02 | 1.08e-01 | 0.0811 |
| 10966 | RAB40B | LZE5T | Human | Esophagus | ESCC | 1.92e-02 | 2.58e-01 | 0.0514 |
| 10966 | RAB40B | LZE7T | Human | Esophagus | ESCC | 1.15e-04 | 3.57e-01 | 0.0667 |
| 10966 | RAB40B | LZE24T | Human | Esophagus | ESCC | 7.26e-30 | 1.02e+00 | 0.0596 |
| 10966 | RAB40B | LZE21T | Human | Esophagus | ESCC | 2.91e-02 | 5.53e-01 | 0.0655 |
| 10966 | RAB40B | P1T-E | Human | Esophagus | ESCC | 1.92e-05 | 3.90e-01 | 0.0875 |
| 10966 | RAB40B | P2T-E | Human | Esophagus | ESCC | 1.29e-34 | 6.39e-01 | 0.1177 |
| 10966 | RAB40B | P4T-E | Human | Esophagus | ESCC | 4.22e-14 | 3.88e-01 | 0.1323 |
| 10966 | RAB40B | P5T-E | Human | Esophagus | ESCC | 2.06e-09 | 2.13e-01 | 0.1327 |
| 10966 | RAB40B | P8T-E | Human | Esophagus | ESCC | 2.10e-20 | 3.51e-01 | 0.0889 |
| 10966 | RAB40B | P9T-E | Human | Esophagus | ESCC | 2.34e-13 | 4.01e-01 | 0.1131 |
| 10966 | RAB40B | P10T-E | Human | Esophagus | ESCC | 2.06e-20 | 2.21e-01 | 0.116 |
| 10966 | RAB40B | P11T-E | Human | Esophagus | ESCC | 6.51e-04 | 2.31e-01 | 0.1426 |
| 10966 | RAB40B | P12T-E | Human | Esophagus | ESCC | 4.14e-38 | 9.36e-01 | 0.1122 |
| 10966 | RAB40B | P15T-E | Human | Esophagus | ESCC | 1.84e-26 | 6.21e-01 | 0.1149 |
| 10966 | RAB40B | P16T-E | Human | Esophagus | ESCC | 6.37e-35 | 7.35e-01 | 0.1153 |
| 10966 | RAB40B | P19T-E | Human | Esophagus | ESCC | 2.68e-04 | 2.10e-01 | 0.1662 |
| 10966 | RAB40B | P20T-E | Human | Esophagus | ESCC | 1.46e-06 | 6.72e-02 | 0.1124 |
| 10966 | RAB40B | P21T-E | Human | Esophagus | ESCC | 1.50e-19 | 2.84e-01 | 0.1617 |
| 10966 | RAB40B | P22T-E | Human | Esophagus | ESCC | 3.35e-23 | 4.23e-01 | 0.1236 |
| Page: 1 2 3 4 |
| Tissue | Expression Dynamics | Abbreviation |
| Esophagus | 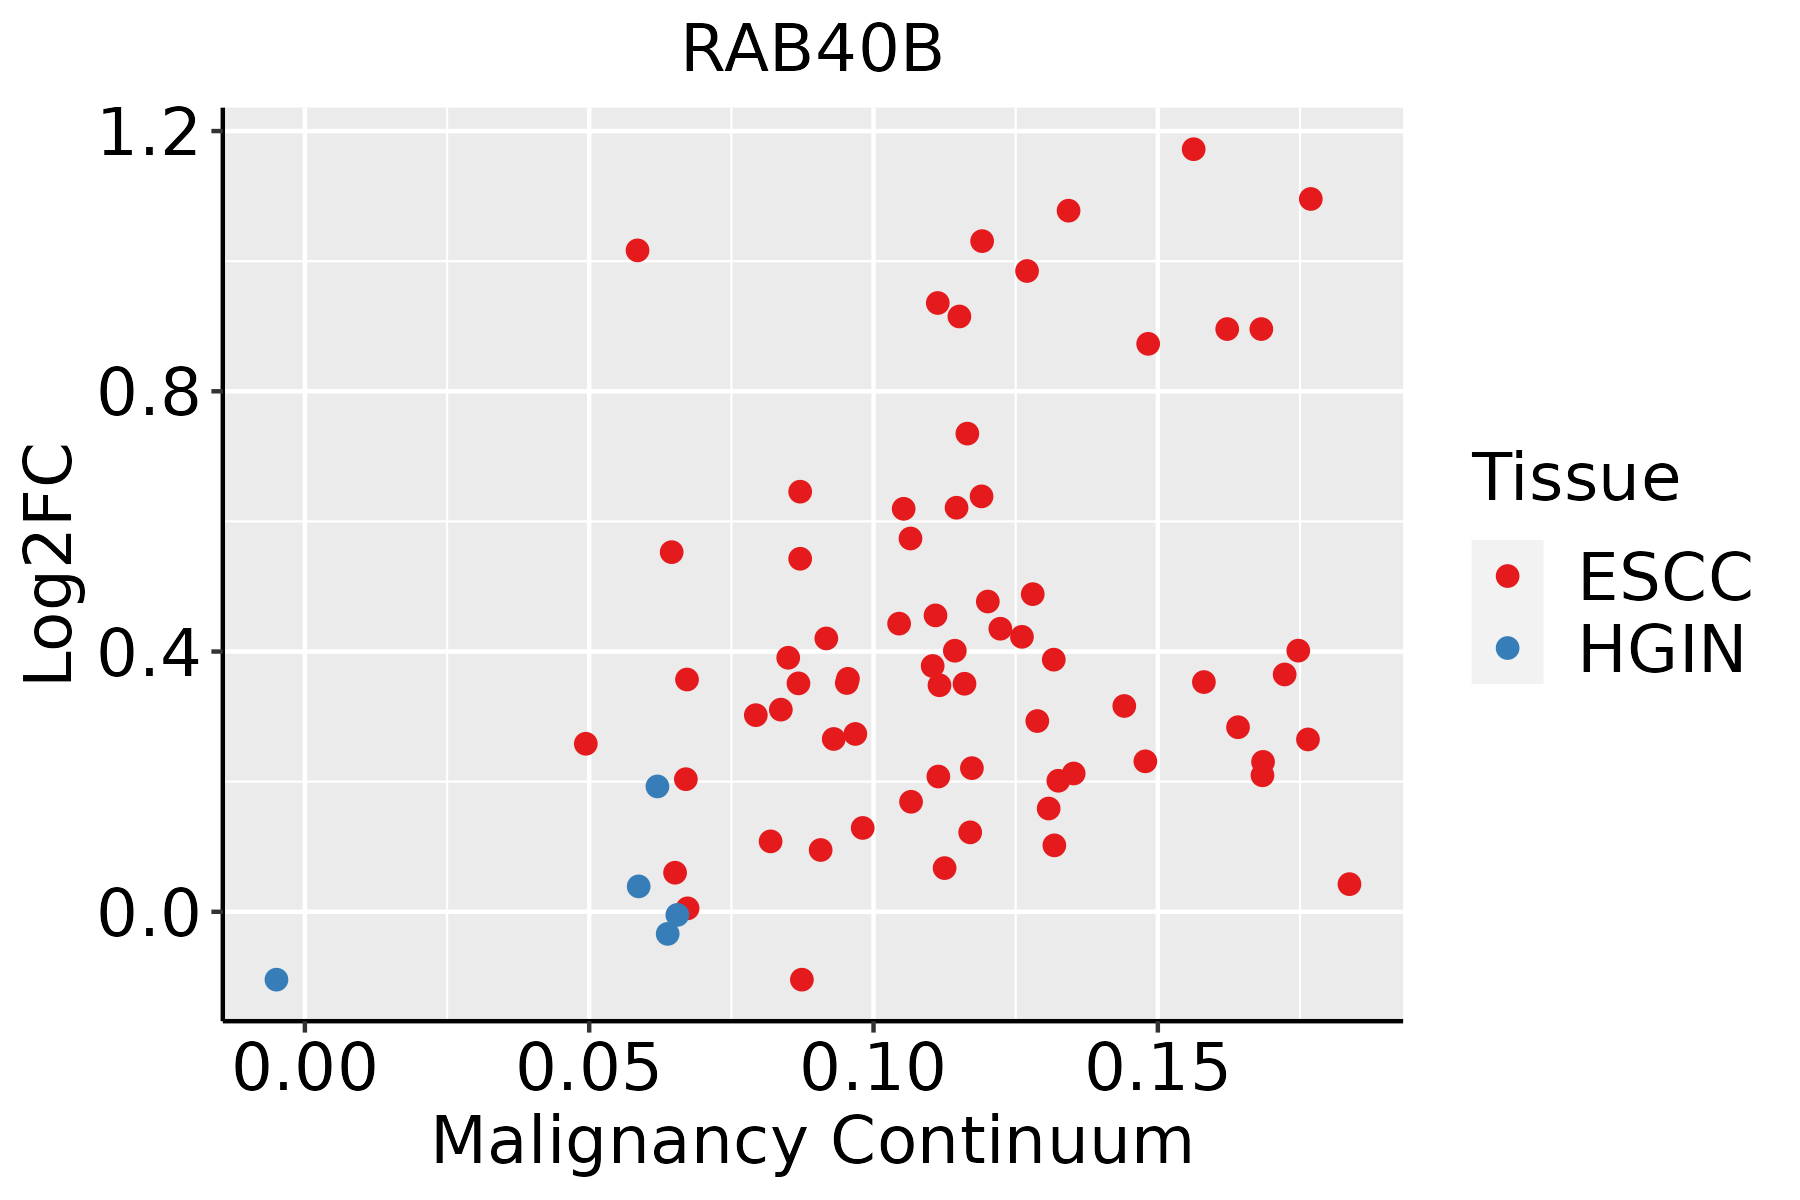 | ESCC: Esophageal squamous cell carcinoma |
| HGIN: High-grade intraepithelial neoplasias | ||
| LGIN: Low-grade intraepithelial neoplasias | ||
| Liver | 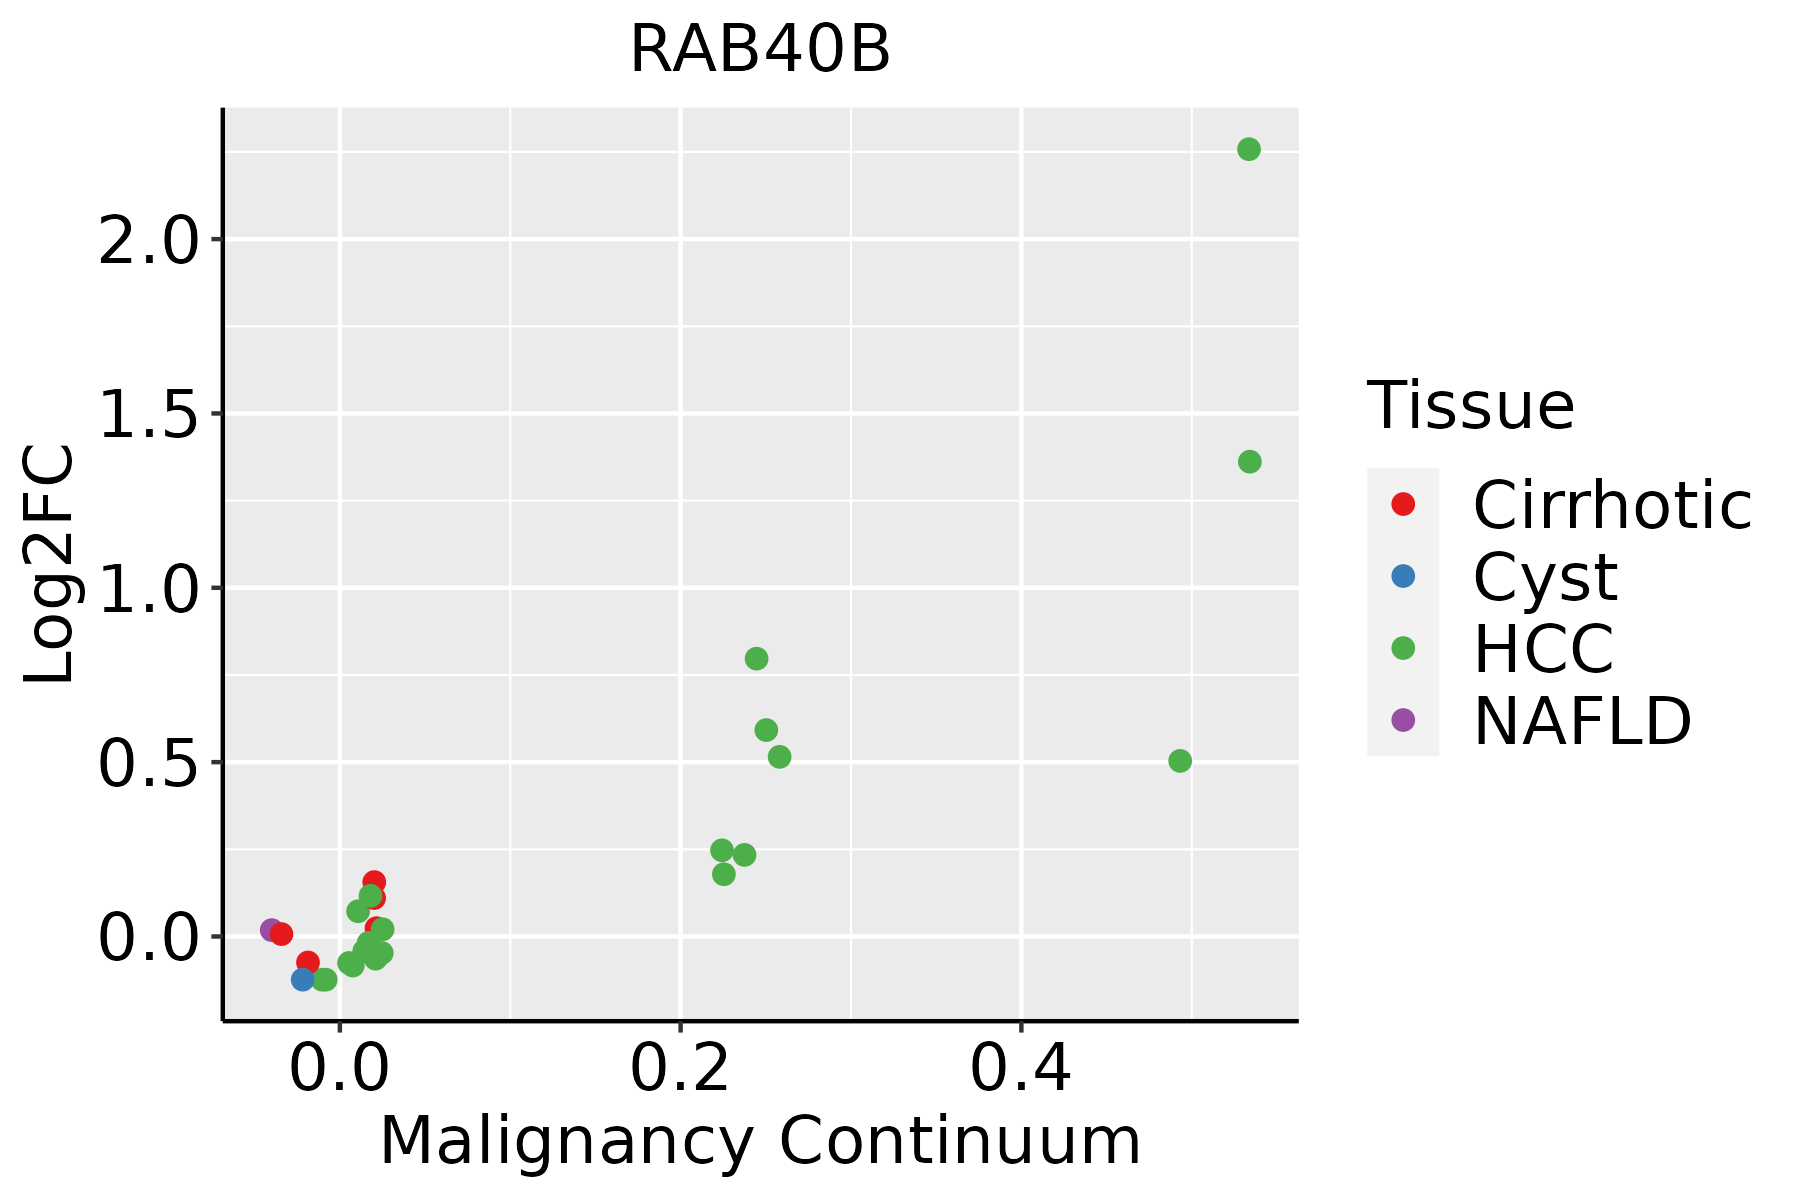 | HCC: Hepatocellular carcinoma |
| NAFLD: Non-alcoholic fatty liver disease | ||
| Oral Cavity | 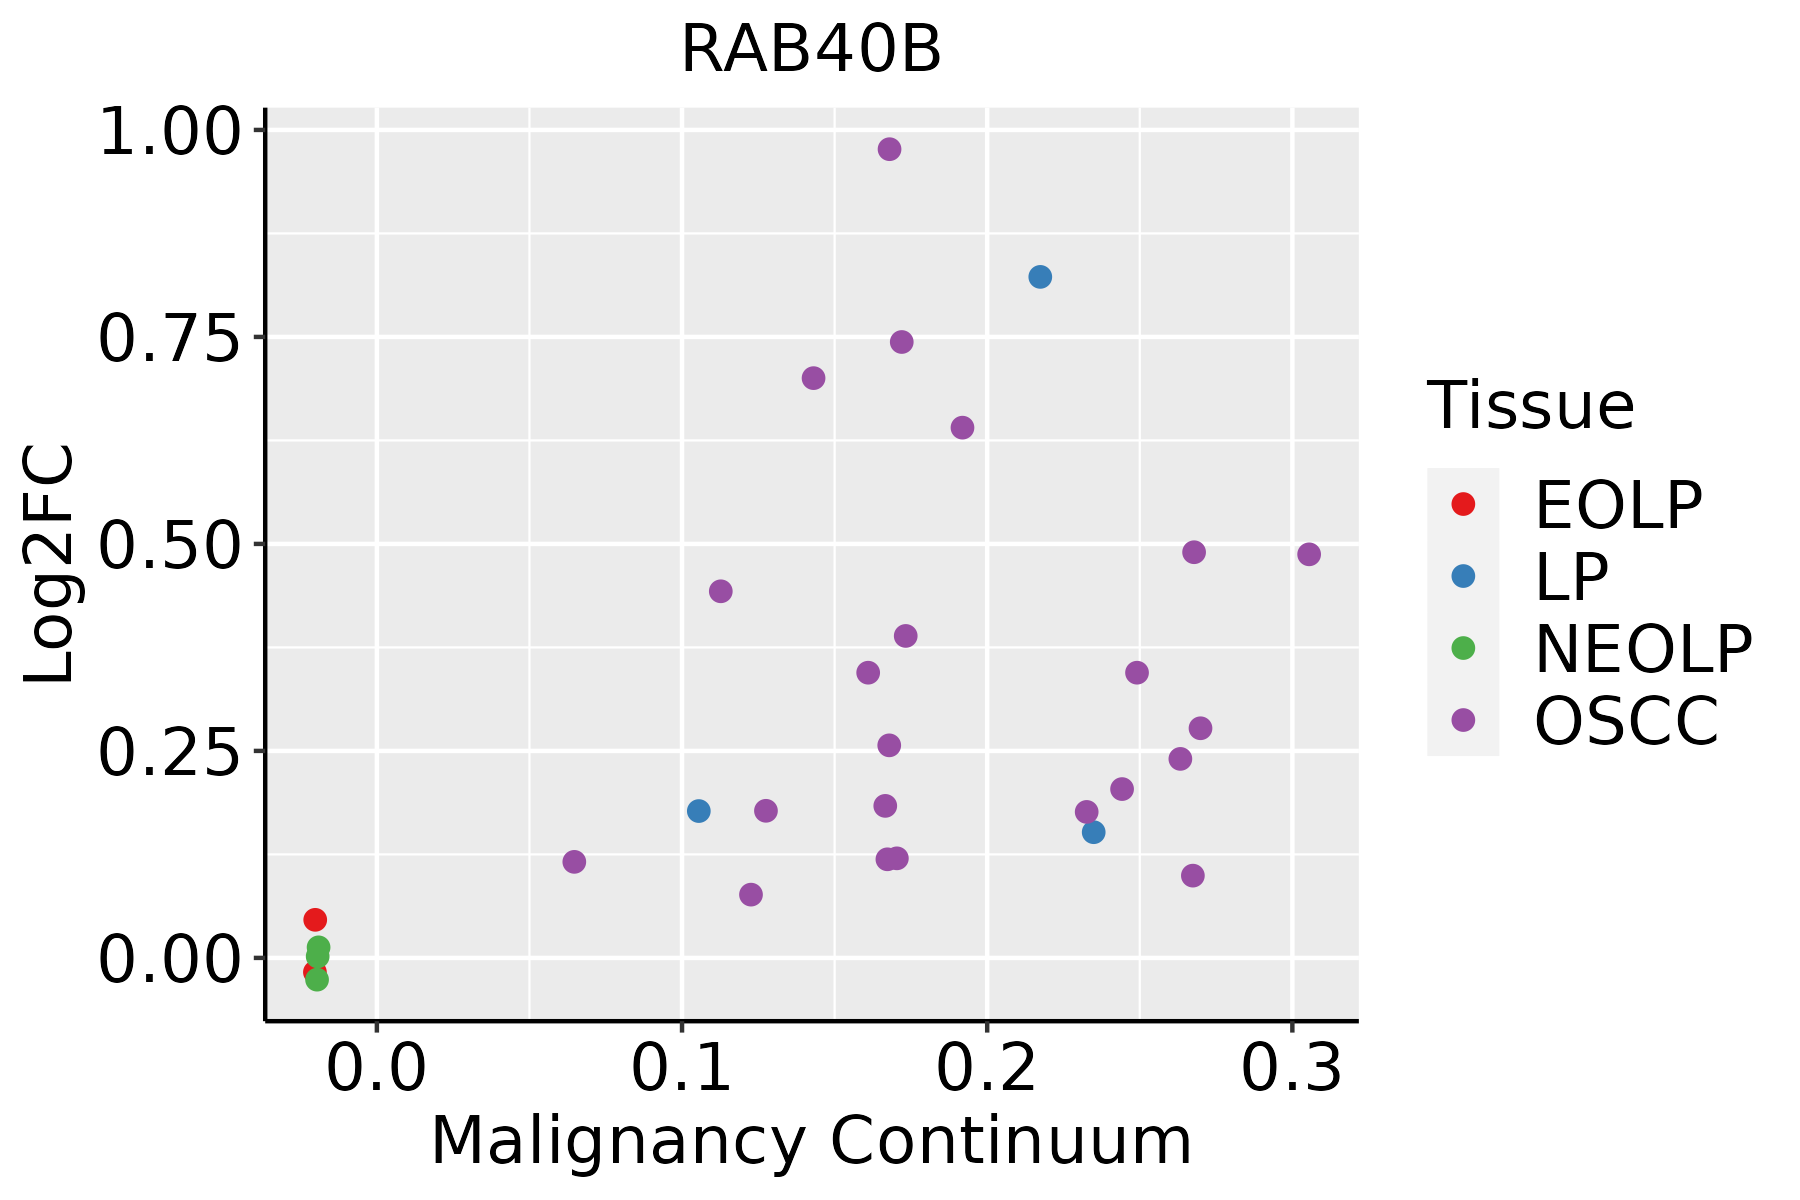 | EOLP: Erosive Oral lichen planus |
| LP: leukoplakia | ||
| NEOLP: Non-erosive oral lichen planus | ||
| OSCC: Oral squamous cell carcinoma |
| ∗log2FC in expression of this searched gene in stem-like cells from each diseased tissue sample relative to stem-like cells in normal samples in each tissue plotted against the malignancy continuum. Samples are colored based on if they are from different disease stage. |
Top |
Malignant transformation related pathway analysis |
| Find out the enriched GO biological processes and KEGG pathways involved in transition from healthy to precancer to cancer |
| Tissue | Disease Stage | Enriched GO biological Processes |
| Colorectum | AD |  |
| Colorectum | SER |  |
| Colorectum | MSS |  |
| Colorectum | MSI-H |  |
| Colorectum | FAP |  |
| ∗Top 15 enriched GO BP terms are showed in the bar plot of each disease state in each tissue. Each row represents a significant GO biological process which is colored according to the -log10(p.adjust). |
| Page: 1 2 3 4 5 6 7 8 9 |
| GO ID | Tissue | Disease Stage | Description | Gene Ratio | Bg Ratio | pvalue | p.adjust | Count |
| GO:0072659110 | Esophagus | ESCC | protein localization to plasma membrane | 193/8552 | 284/18723 | 1.95e-14 | 1.03e-12 | 193 |
| GO:199077819 | Esophagus | ESCC | protein localization to cell periphery | 217/8552 | 333/18723 | 4.08e-13 | 1.88e-11 | 217 |
| GO:19019987 | Esophagus | ESCC | toxin transport | 28/8552 | 40/18723 | 1.61e-03 | 7.50e-03 | 28 |
| GO:007265921 | Liver | HCC | protein localization to plasma membrane | 177/7958 | 284/18723 | 1.02e-11 | 4.18e-10 | 177 |
| GO:199077821 | Liver | HCC | protein localization to cell periphery | 200/7958 | 333/18723 | 6.07e-11 | 2.23e-09 | 200 |
| GO:007265918 | Oral cavity | OSCC | protein localization to plasma membrane | 169/7305 | 284/18723 | 1.69e-12 | 7.21e-11 | 169 |
| GO:199077816 | Oral cavity | OSCC | protein localization to cell periphery | 190/7305 | 333/18723 | 1.46e-11 | 5.13e-10 | 190 |
| GO:19019986 | Oral cavity | OSCC | toxin transport | 25/7305 | 40/18723 | 2.22e-03 | 1.00e-02 | 25 |
| GO:007265919 | Oral cavity | LP | protein localization to plasma membrane | 119/4623 | 284/18723 | 1.11e-10 | 6.44e-09 | 119 |
| GO:199077817 | Oral cavity | LP | protein localization to cell periphery | 133/4623 | 333/18723 | 4.42e-10 | 2.21e-08 | 133 |
| GO:190199812 | Oral cavity | LP | toxin transport | 19/4623 | 40/18723 | 1.44e-03 | 1.14e-02 | 19 |
| Page: 1 |
| Pathway ID | Tissue | Disease Stage | Description | Gene Ratio | Bg Ratio | pvalue | p.adjust | qvalue | Count |
| Page: 1 |
Top |
Cell-cell communication analysis |
| Identification of potential cell-cell interactions between two cell types and their ligand-receptor pairs for different disease states |
| Ligand | Receptor | LRpair | Pathway | Tissue | Disease Stage |
| Page: 1 |
Top |
Single-cell gene regulatory network inference analysis |
| Find out the significant the regulons (TFs) and the target genes of each regulon across cell types for different disease states |
| TF | Cell Type | Tissue | Disease Stage | Target Gene | RSS | Regulon Activity |
| ∗The dot plots of a searched regulon are shown for all cell subpopulations in each disease state of each tissue based on the regulon specific score inferred using pySCENIC and by calculating the average expression. |
| Page: 1 |
Top |
Somatic mutation of malignant transformation related genes |
| Annotation of somatic variants for genes involved in malignant transformation |
| Hugo Symbol | Variant Class | Variant Classification | dbSNP RS | HGVSc | HGVSp | HGVSp Short | SWISSPROT | BIOTYPE | SIFT | PolyPhen | Tumor Sample Barcode | Tissue | Histology | Sex | Age | Stage | Therapy Types | Drugs | Outcome |
| RAB40B | SNV | Missense_Mutation | rs755955648 | c.601N>A | p.Val201Met | p.V201M | Q12829 | protein_coding | deleterious(0) | probably_damaging(0.999) | TCGA-A8-A09B-01 | Breast | breast invasive carcinoma | Female | <65 | III/IV | Chemotherapy | 5-fluorouracil | SD |
| RAB40B | deletion | Frame_Shift_Del | novel | c.818delA | p.Asn273ThrfsTer79 | p.N273Tfs*79 | Q12829 | protein_coding | TCGA-EW-A2FV-01 | Breast | breast invasive carcinoma | Female | <65 | III/IV | Chemotherapy | docetaxel | SD | ||
| RAB40B | SNV | Missense_Mutation | c.392N>A | p.Ala131Glu | p.A131E | Q12829 | protein_coding | tolerated(0.51) | possibly_damaging(0.494) | TCGA-AA-3492-01 | Colorectum | colon adenocarcinoma | Female | >=65 | I/II | Unknown | Unknown | SD | |
| RAB40B | SNV | Missense_Mutation | rs749420184 | c.182N>A | p.Arg61Gln | p.R61Q | Q12829 | protein_coding | deleterious(0.04) | benign(0.109) | TCGA-D5-6924-01 | Colorectum | colon adenocarcinoma | Male | >=65 | I/II | Unknown | Unknown | SD |
| RAB40B | SNV | Missense_Mutation | novel | c.828N>C | p.Lys276Asn | p.K276N | Q12829 | protein_coding | deleterious_low_confidence(0.02) | benign(0.009) | TCGA-AG-3892-01 | Colorectum | rectum adenocarcinoma | Female | <65 | I/II | Unknown | Unknown | SD |
| RAB40B | SNV | Missense_Mutation | c.296N>A | p.Arg99His | p.R99H | Q12829 | protein_coding | deleterious(0.01) | probably_damaging(0.977) | TCGA-AP-A1DV-01 | Endometrium | uterine corpus endometrioid carcinoma | Female | <65 | I/II | Unknown | Unknown | SD | |
| RAB40B | SNV | Missense_Mutation | novel | c.148N>A | p.Asp50Asn | p.D50N | Q12829 | protein_coding | deleterious(0.01) | probably_damaging(0.929) | TCGA-AX-A1C4-01 | Endometrium | uterine corpus endometrioid carcinoma | Female | <65 | I/II | Unknown | Unknown | SD |
| RAB40B | SNV | Missense_Mutation | c.677C>T | p.Ser226Leu | p.S226L | Q12829 | protein_coding | deleterious_low_confidence(0.03) | possibly_damaging(0.745) | TCGA-D1-A17Q-01 | Endometrium | uterine corpus endometrioid carcinoma | Female | <65 | I/II | Unknown | Unknown | SD | |
| RAB40B | SNV | Missense_Mutation | c.677N>T | p.Ser226Leu | p.S226L | Q12829 | protein_coding | deleterious_low_confidence(0.03) | possibly_damaging(0.745) | TCGA-DF-A2KU-01 | Endometrium | uterine corpus endometrioid carcinoma | Female | Unknown | I/II | Unknown | Unknown | SD | |
| RAB40B | SNV | Missense_Mutation | novel | c.310N>A | p.Gly104Ser | p.G104S | Q12829 | protein_coding | deleterious(0.05) | probably_damaging(0.98) | TCGA-DF-A2KU-01 | Endometrium | uterine corpus endometrioid carcinoma | Female | Unknown | I/II | Unknown | Unknown | SD |
| Page: 1 2 3 |
Top |
Related drugs of malignant transformation related genes |
| Identification of chemicals and drugs interact with genes involved in malignant transfromation |
| (DGIdb 4.0) |
| Entrez ID | Symbol | Category | Interaction Types | Drug Claim Name | Drug Name | PMIDs |
| Page: 1 |

Copyright 2023-Present -The University of Texas Health Science Center at Houston |