
|
|||||
|
 | |
| |
| |
| |
| |
| |
|
Gene: RAB3IP |
Gene summary for RAB3IP |
| Gene information | Species | Human | Gene symbol | RAB3IP | Gene ID | 117177 |
| Gene name | RAB3A interacting protein | |
| Gene Alias | RABIN3 | |
| Cytomap | 12q15 | |
| Gene Type | protein-coding | GO ID | GO:0006605 | UniProtAcc | Q96QF0 |
Top |
Malignant transformation analysis |
| Identification of the aberrant gene expression in precancerous and cancerous lesions by comparing the gene expression of stem-like cells in diseased tissues with normal stem cells |
| Entrez ID | Symbol | Replicates | Species | Organ | Tissue | Adj P-value | Log2FC | Malignancy |
| 117177 | RAB3IP | AEH-subject1 | Human | Endometrium | AEH | 1.03e-21 | 6.15e-01 | -0.3059 |
| 117177 | RAB3IP | AEH-subject4 | Human | Endometrium | AEH | 8.16e-04 | 3.40e-01 | -0.2657 |
| 117177 | RAB3IP | AEH-subject5 | Human | Endometrium | AEH | 1.08e-26 | 7.03e-01 | -0.2953 |
| 117177 | RAB3IP | EEC-subject1 | Human | Endometrium | EEC | 3.36e-10 | 4.98e-01 | -0.2682 |
| 117177 | RAB3IP | GSM6177620_NYU_UCEC1_lib1_lib1 | Human | Endometrium | EEC | 1.40e-02 | 1.85e-01 | -0.1869 |
| 117177 | RAB3IP | GSM6177621_NYU_UCEC2_lib1_lib1 | Human | Endometrium | EEC | 1.07e-03 | 1.87e-01 | -0.1934 |
| 117177 | RAB3IP | GSM6177622_NYU_UCEC3_lib1_lib1 | Human | Endometrium | EEC | 4.86e-09 | 2.44e-01 | -0.1917 |
| 117177 | RAB3IP | GSM6177622_NYU_UCEC3_lib2_lib2 | Human | Endometrium | EEC | 8.70e-11 | 3.50e-01 | -0.1916 |
| 117177 | RAB3IP | LZE4T | Human | Esophagus | ESCC | 7.62e-16 | 3.61e-01 | 0.0811 |
| 117177 | RAB3IP | LZE5T | Human | Esophagus | ESCC | 2.57e-03 | 3.61e-01 | 0.0514 |
| 117177 | RAB3IP | LZE7T | Human | Esophagus | ESCC | 5.76e-22 | 8.60e-01 | 0.0667 |
| 117177 | RAB3IP | LZE8T | Human | Esophagus | ESCC | 1.48e-12 | 3.71e-01 | 0.067 |
| 117177 | RAB3IP | LZE20T | Human | Esophagus | ESCC | 1.84e-02 | 1.86e-01 | 0.0662 |
| 117177 | RAB3IP | LZE22T | Human | Esophagus | ESCC | 3.27e-02 | 3.87e-01 | 0.068 |
| 117177 | RAB3IP | LZE24T | Human | Esophagus | ESCC | 2.48e-30 | 7.30e-01 | 0.0596 |
| 117177 | RAB3IP | LZE21T | Human | Esophagus | ESCC | 3.56e-02 | 3.33e-01 | 0.0655 |
| 117177 | RAB3IP | LZE6T | Human | Esophagus | ESCC | 5.15e-06 | 2.57e-01 | 0.0845 |
| 117177 | RAB3IP | P1T-E | Human | Esophagus | ESCC | 1.58e-18 | 1.16e+00 | 0.0875 |
| 117177 | RAB3IP | P2T-E | Human | Esophagus | ESCC | 3.71e-75 | 1.41e+00 | 0.1177 |
| 117177 | RAB3IP | P4T-E | Human | Esophagus | ESCC | 4.51e-42 | 9.54e-01 | 0.1323 |
| Page: 1 2 3 4 5 6 |
| Tissue | Expression Dynamics | Abbreviation |
| Endometrium | 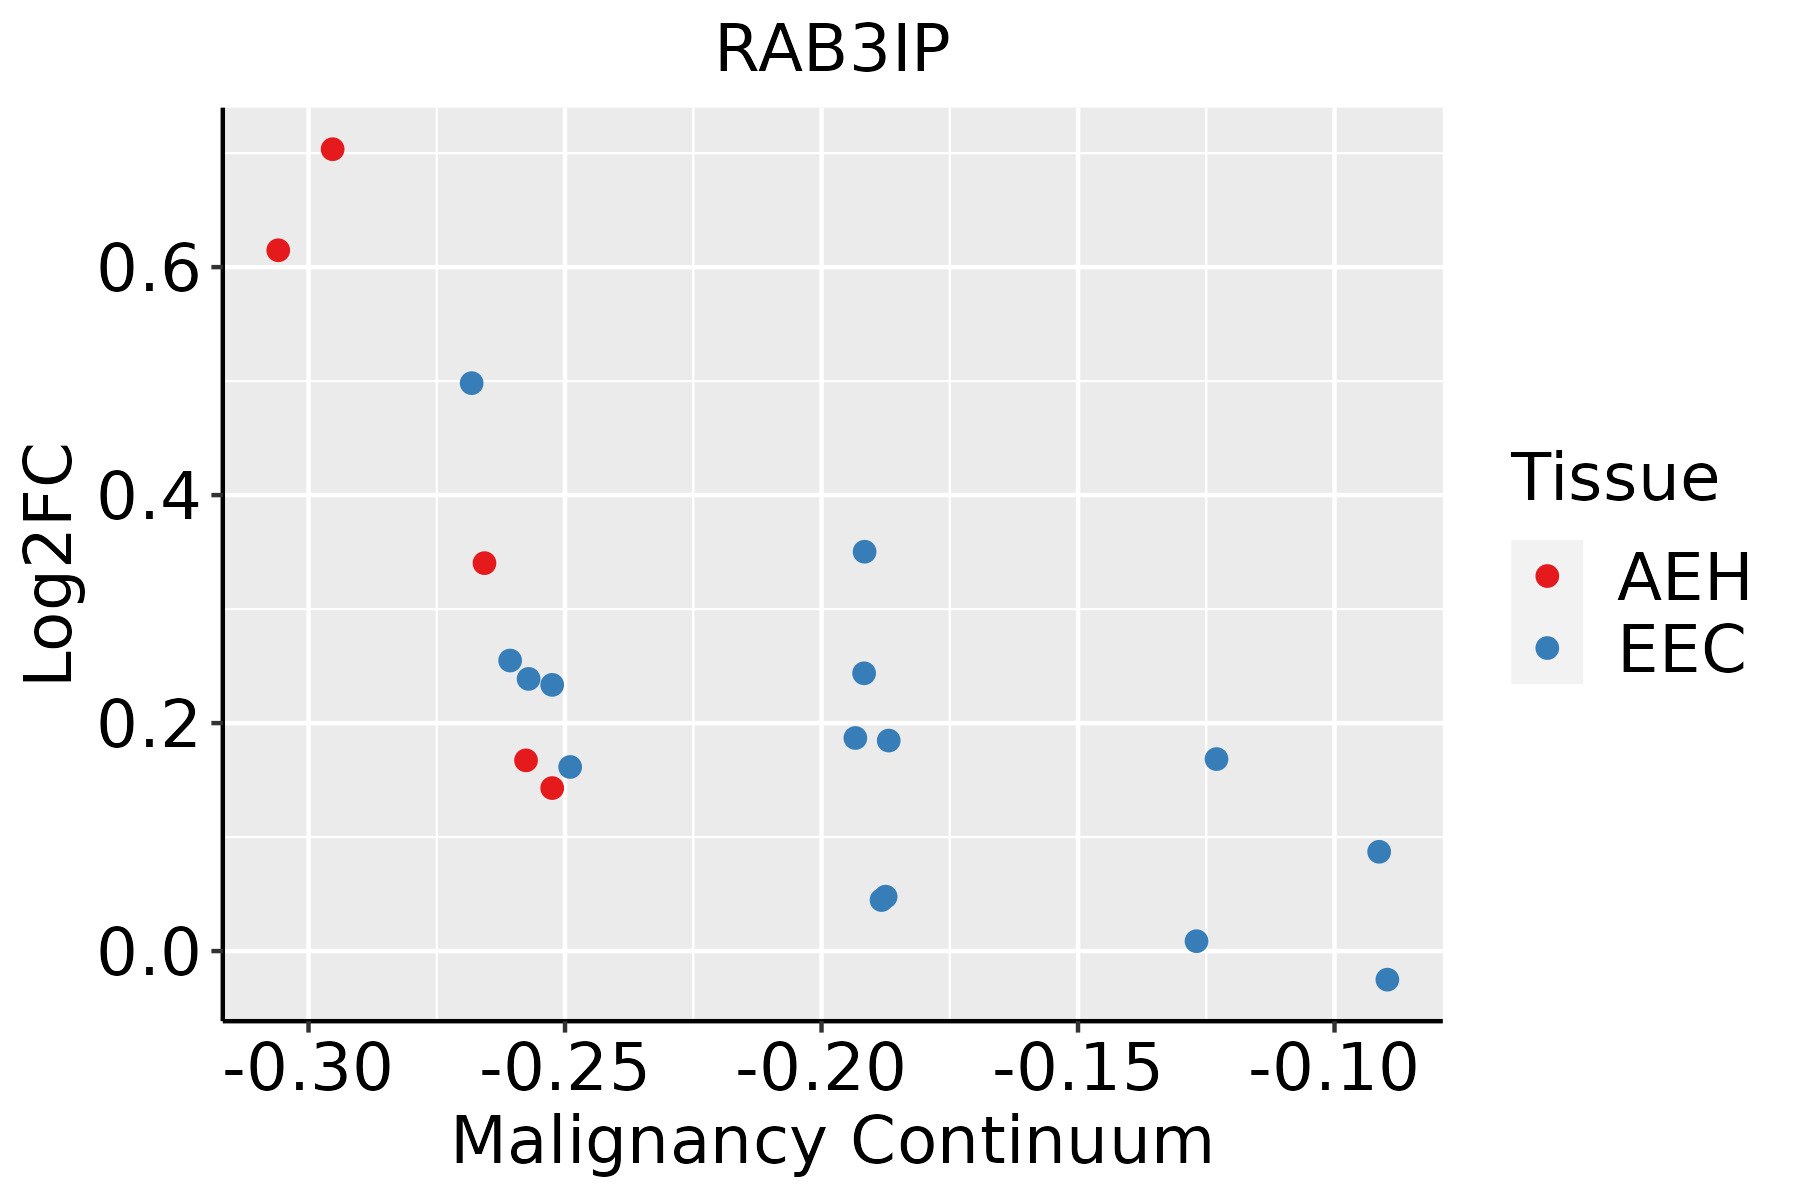 | AEH: Atypical endometrial hyperplasia |
| EEC: Endometrioid Cancer | ||
| Esophagus |  | ESCC: Esophageal squamous cell carcinoma |
| HGIN: High-grade intraepithelial neoplasias | ||
| LGIN: Low-grade intraepithelial neoplasias | ||
| Liver |  | HCC: Hepatocellular carcinoma |
| NAFLD: Non-alcoholic fatty liver disease | ||
| Oral Cavity | 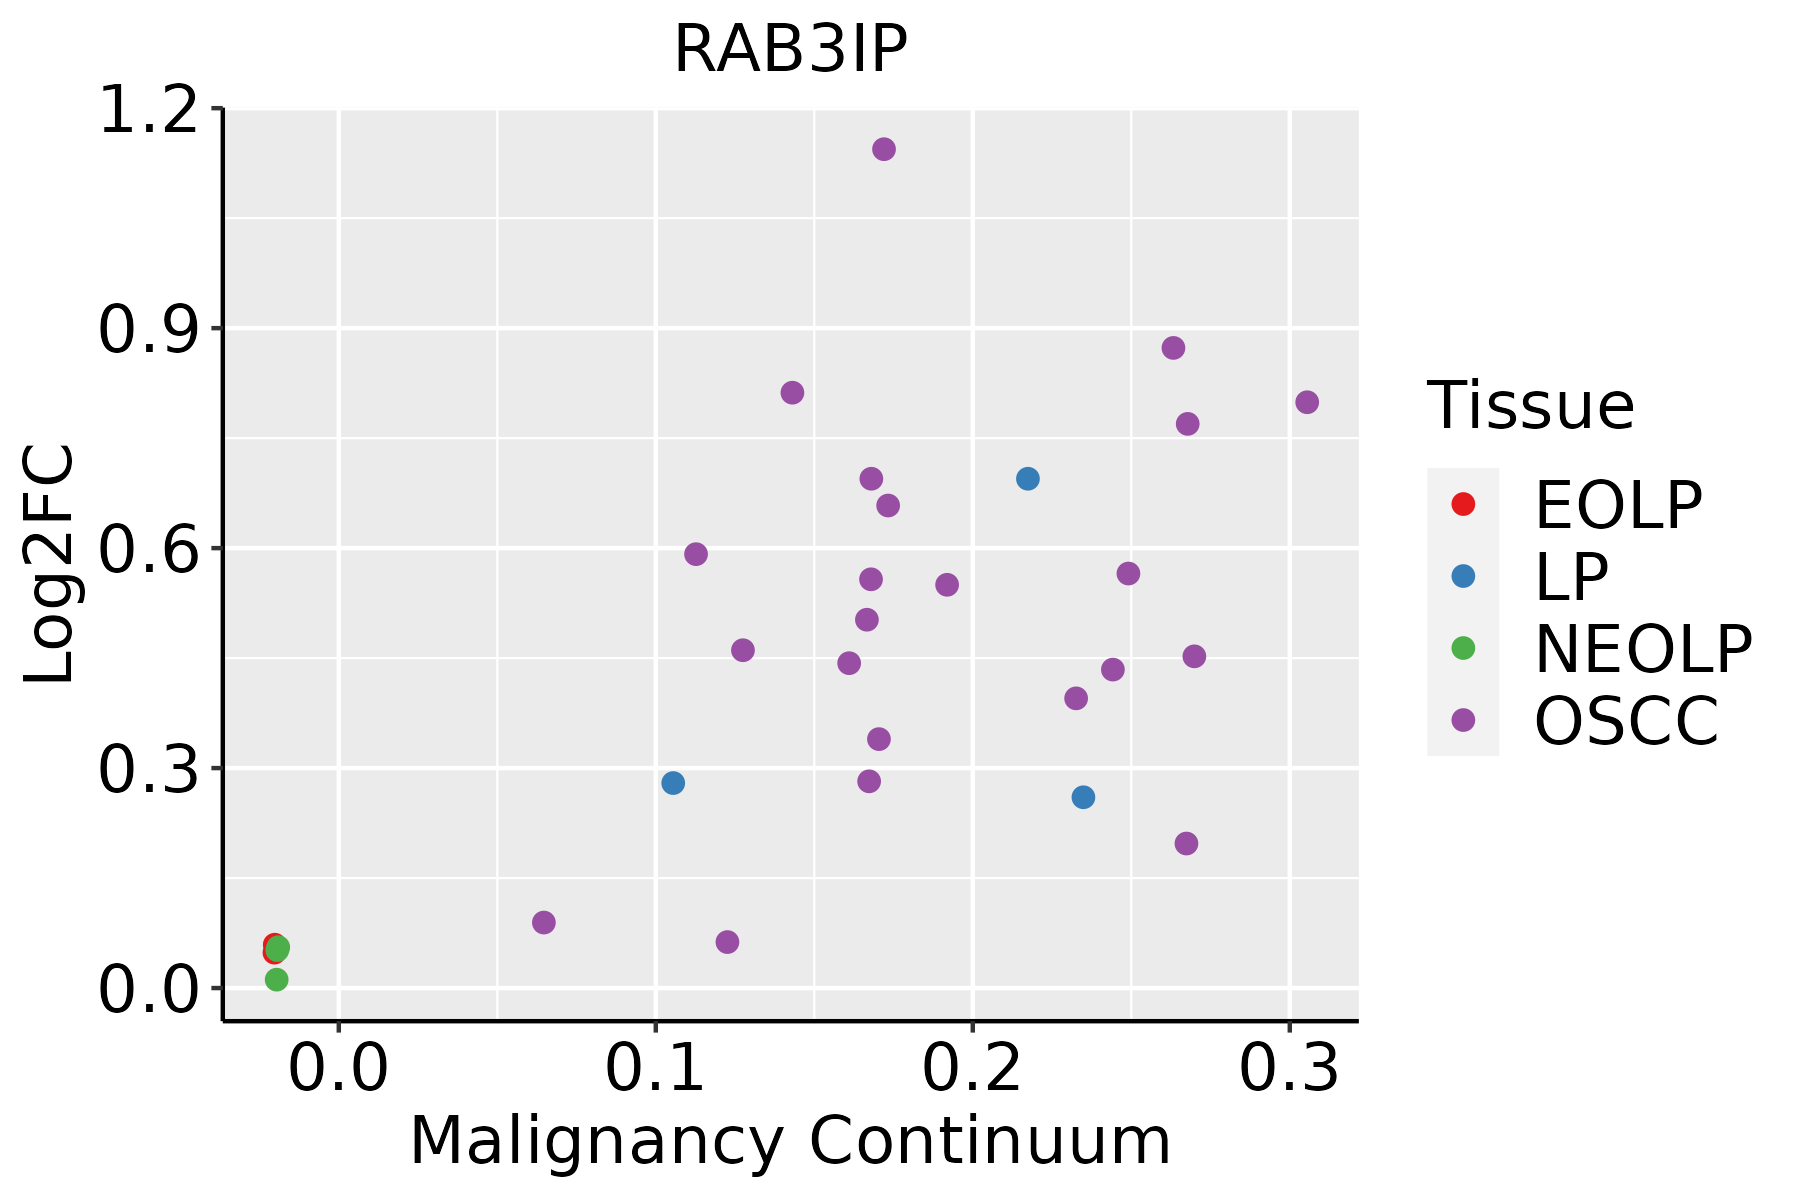 | EOLP: Erosive Oral lichen planus |
| LP: leukoplakia | ||
| NEOLP: Non-erosive oral lichen planus | ||
| OSCC: Oral squamous cell carcinoma | ||
| Thyroid | 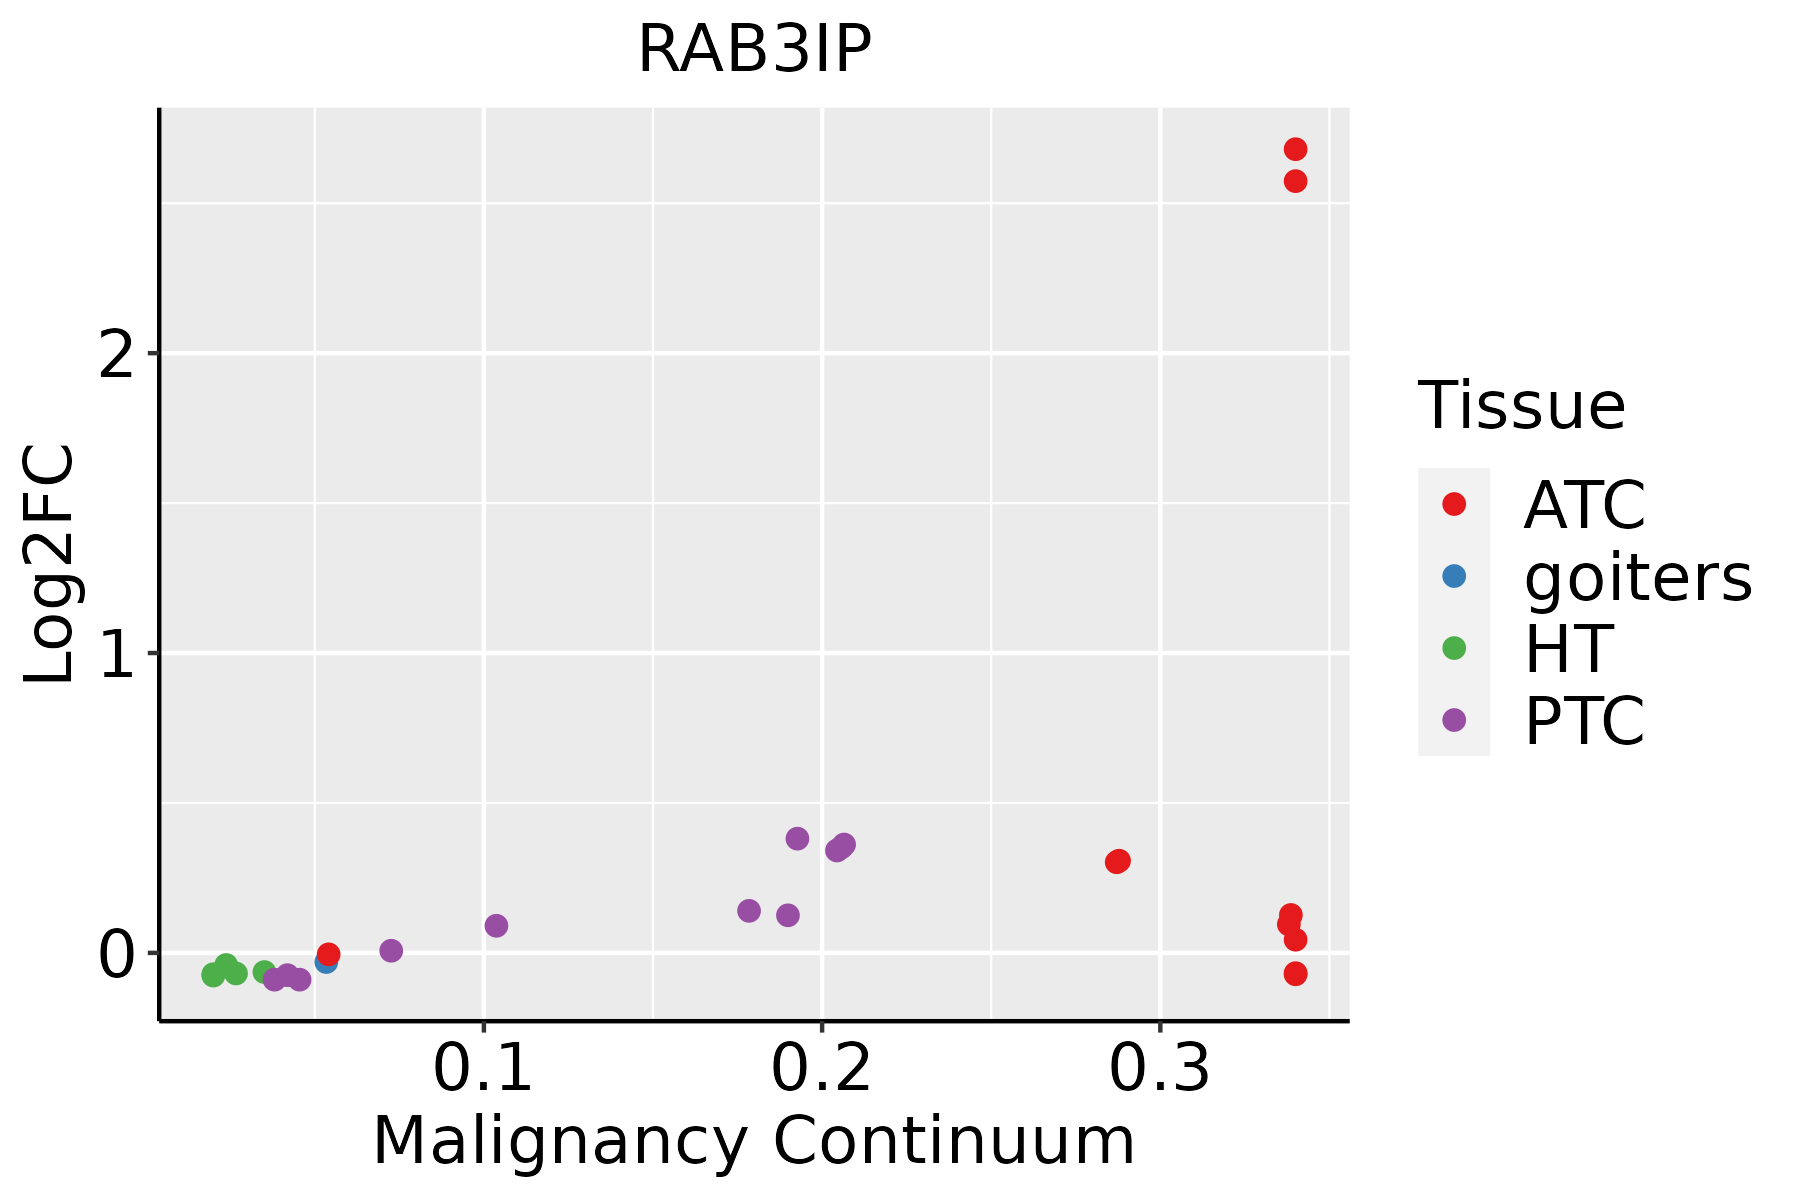 | ATC: Anaplastic thyroid cancer |
| HT: Hashimoto's thyroiditis | ||
| PTC: Papillary thyroid cancer |
| ∗log2FC in expression of this searched gene in stem-like cells from each diseased tissue sample relative to stem-like cells in normal samples in each tissue plotted against the malignancy continuum. Samples are colored based on if they are from different disease stage. |
Top |
Malignant transformation related pathway analysis |
| Find out the enriched GO biological processes and KEGG pathways involved in transition from healthy to precancer to cancer |
| Tissue | Disease Stage | Enriched GO biological Processes |
| Colorectum | AD |  |
| Colorectum | SER |  |
| Colorectum | MSS |  |
| Colorectum | MSI-H |  |
| Colorectum | FAP |  |
| ∗Top 15 enriched GO BP terms are showed in the bar plot of each disease state in each tissue. Each row represents a significant GO biological process which is colored according to the -log10(p.adjust). |
| Page: 1 2 3 4 5 6 7 8 9 |
| GO ID | Tissue | Disease Stage | Description | Gene Ratio | Bg Ratio | pvalue | p.adjust | Count |
| GO:000660516 | Endometrium | AEH | protein targeting | 68/2100 | 314/18723 | 6.30e-08 | 3.38e-06 | 68 |
| GO:009015010 | Endometrium | AEH | establishment of protein localization to membrane | 51/2100 | 260/18723 | 4.74e-05 | 7.85e-04 | 51 |
| GO:000660517 | Endometrium | EEC | protein targeting | 69/2168 | 314/18723 | 9.61e-08 | 4.69e-06 | 69 |
| GO:009015015 | Endometrium | EEC | establishment of protein localization to membrane | 52/2168 | 260/18723 | 5.46e-05 | 8.64e-04 | 52 |
| GO:0006605111 | Esophagus | ESCC | protein targeting | 229/8552 | 314/18723 | 4.93e-23 | 1.01e-20 | 229 |
| GO:0090150110 | Esophagus | ESCC | establishment of protein localization to membrane | 182/8552 | 260/18723 | 1.27e-15 | 8.19e-14 | 182 |
| GO:00224069 | Esophagus | ESCC | membrane docking | 62/8552 | 86/18723 | 5.93e-07 | 7.79e-06 | 62 |
| GO:00066124 | Esophagus | ESCC | protein targeting to membrane | 83/8552 | 131/18723 | 3.31e-05 | 2.73e-04 | 83 |
| GO:01400567 | Esophagus | ESCC | organelle localization by membrane tethering | 53/8552 | 77/18723 | 3.33e-05 | 2.74e-04 | 53 |
| GO:00066057 | Liver | Cirrhotic | protein targeting | 148/4634 | 314/18723 | 3.86e-18 | 6.20e-16 | 148 |
| GO:00901507 | Liver | Cirrhotic | establishment of protein localization to membrane | 123/4634 | 260/18723 | 1.85e-15 | 2.15e-13 | 123 |
| GO:00224065 | Liver | Cirrhotic | membrane docking | 39/4634 | 86/18723 | 2.47e-05 | 3.22e-04 | 39 |
| GO:00066122 | Liver | Cirrhotic | protein targeting to membrane | 53/4634 | 131/18723 | 5.17e-05 | 5.95e-04 | 53 |
| GO:01400565 | Liver | Cirrhotic | organelle localization by membrane tethering | 32/4634 | 77/18723 | 8.65e-04 | 6.23e-03 | 32 |
| GO:000660512 | Liver | HCC | protein targeting | 219/7958 | 314/18723 | 7.74e-23 | 1.49e-20 | 219 |
| GO:009015012 | Liver | HCC | establishment of protein localization to membrane | 168/7958 | 260/18723 | 4.07e-13 | 2.13e-11 | 168 |
| GO:002240611 | Liver | HCC | membrane docking | 57/7958 | 86/18723 | 7.14e-06 | 8.47e-05 | 57 |
| GO:014005611 | Liver | HCC | organelle localization by membrane tethering | 49/7958 | 77/18723 | 1.46e-04 | 1.18e-03 | 49 |
| GO:00066121 | Liver | HCC | protein targeting to membrane | 75/7958 | 131/18723 | 4.58e-04 | 3.04e-03 | 75 |
| GO:000660520 | Oral cavity | OSCC | protein targeting | 204/7305 | 314/18723 | 6.78e-21 | 1.13e-18 | 204 |
| Page: 1 2 |
| Pathway ID | Tissue | Disease Stage | Description | Gene Ratio | Bg Ratio | pvalue | p.adjust | qvalue | Count |
| Page: 1 |
Top |
Cell-cell communication analysis |
| Identification of potential cell-cell interactions between two cell types and their ligand-receptor pairs for different disease states |
| Ligand | Receptor | LRpair | Pathway | Tissue | Disease Stage |
| Page: 1 |
Top |
Single-cell gene regulatory network inference analysis |
| Find out the significant the regulons (TFs) and the target genes of each regulon across cell types for different disease states |
| TF | Cell Type | Tissue | Disease Stage | Target Gene | RSS | Regulon Activity |
| ∗The dot plots of a searched regulon are shown for all cell subpopulations in each disease state of each tissue based on the regulon specific score inferred using pySCENIC and by calculating the average expression. |
| Page: 1 |
Top |
Somatic mutation of malignant transformation related genes |
| Annotation of somatic variants for genes involved in malignant transformation |
| Hugo Symbol | Variant Class | Variant Classification | dbSNP RS | HGVSc | HGVSp | HGVSp Short | SWISSPROT | BIOTYPE | SIFT | PolyPhen | Tumor Sample Barcode | Tissue | Histology | Sex | Age | Stage | Therapy Types | Drugs | Outcome |
| RAB3IP | SNV | Missense_Mutation | novel | c.1380N>C | p.Leu460Phe | p.L460F | Q96QF0 | protein_coding | deleterious(0.01) | probably_damaging(0.994) | TCGA-BH-A0B6-01 | Breast | breast invasive carcinoma | Female | <65 | I/II | Unknown | Unknown | SD |
| RAB3IP | SNV | Missense_Mutation | c.139C>G | p.Gln47Glu | p.Q47E | Q96QF0 | protein_coding | tolerated_low_confidence(0.24) | benign(0.039) | TCGA-GM-A2DH-01 | Breast | breast invasive carcinoma | Female | <65 | I/II | Chemotherapy | taxol | CR | |
| RAB3IP | insertion | In_Frame_Ins | novel | c.1055_1056insTCTACCTTTTGATGTTTTTTGTCAATTTTT | p.Ser352_Lys353insLeuProPheAspValPheCysGlnPheLeu | p.S352_K353insLPFDVFCQFL | Q96QF0 | protein_coding | TCGA-A8-A0A6-01 | Breast | breast invasive carcinoma | Female | <65 | III/IV | Chemotherapy | epirubicin | CR | ||
| RAB3IP | SNV | Missense_Mutation | c.582N>C | p.Glu194Asp | p.E194D | Q96QF0 | protein_coding | deleterious(0) | probably_damaging(0.989) | TCGA-C5-A1ME-01 | Cervix | cervical & endocervical cancer | Female | <65 | I/II | Unknown | Unknown | SD | |
| RAB3IP | SNV | Missense_Mutation | rs575263311 | c.803N>T | p.Thr268Met | p.T268M | Q96QF0 | protein_coding | tolerated(0.1) | possibly_damaging(0.806) | TCGA-EA-A410-01 | Cervix | cervical & endocervical cancer | Female | <65 | I/II | Unknown | Unknown | SD |
| RAB3IP | SNV | Missense_Mutation | c.751N>C | p.Glu251Gln | p.E251Q | Q96QF0 | protein_coding | deleterious(0) | probably_damaging(0.996) | TCGA-VS-A958-01 | Cervix | cervical & endocervical cancer | Female | <65 | I/II | Chemotherapy | cisplatin | CR | |
| RAB3IP | SNV | Missense_Mutation | c.790N>A | p.Pro264Thr | p.P264T | Q96QF0 | protein_coding | deleterious(0) | probably_damaging(0.999) | TCGA-A6-6653-01 | Colorectum | colon adenocarcinoma | Male | >=65 | I/II | Unknown | Unknown | SD | |
| RAB3IP | SNV | Missense_Mutation | novel | c.1063N>C | p.Glu355Gln | p.E355Q | Q96QF0 | protein_coding | deleterious(0.03) | probably_damaging(0.986) | TCGA-AM-5820-01 | Colorectum | colon adenocarcinoma | Female | <65 | I/II | Unknown | Unknown | SD |
| RAB3IP | SNV | Missense_Mutation | novel | c.12N>C | p.Lys4Asn | p.K4N | Q96QF0 | protein_coding | tolerated_low_confidence(0.21) | benign(0) | TCGA-AZ-4315-01 | Colorectum | colon adenocarcinoma | Male | <65 | I/II | Unknown | Unknown | SD |
| RAB3IP | SNV | Missense_Mutation | rs200501608 | c.479N>A | p.Arg160His | p.R160H | Q96QF0 | protein_coding | tolerated(0.11) | benign(0.007) | TCGA-AZ-6601-01 | Colorectum | colon adenocarcinoma | Male | >=65 | I/II | Unknown | Unknown | PD |
| Page: 1 2 3 4 5 6 7 |
Top |
Related drugs of malignant transformation related genes |
| Identification of chemicals and drugs interact with genes involved in malignant transfromation |
| (DGIdb 4.0) |
| Entrez ID | Symbol | Category | Interaction Types | Drug Claim Name | Drug Name | PMIDs |
| Page: 1 |

Copyright 2023-Present -The University of Texas Health Science Center at Houston |