
|
|||||
|
 | |
| |
| |
| |
| |
| |
|
Gene: RAB3B |
Gene summary for RAB3B |
| Gene information | Species | Human | Gene symbol | RAB3B | Gene ID | 5865 |
| Gene name | RAB3B, member RAS oncogene family | |
| Gene Alias | RAB3B | |
| Cytomap | 1p32.3 | |
| Gene Type | protein-coding | GO ID | GO:0001504 | UniProtAcc | P20337 |
Top |
Malignant transformation analysis |
| Identification of the aberrant gene expression in precancerous and cancerous lesions by comparing the gene expression of stem-like cells in diseased tissues with normal stem cells |
| Entrez ID | Symbol | Replicates | Species | Organ | Tissue | Adj P-value | Log2FC | Malignancy |
| 5865 | RAB3B | HTA11_2487_2000001011 | Human | Colorectum | SER | 5.80e-07 | 2.24e-01 | -0.1808 |
| 5865 | RAB3B | HTA11_411_2000001011 | Human | Colorectum | SER | 2.50e-11 | 1.36e+00 | -0.2602 |
| 5865 | RAB3B | HTA11_2112_2000001011 | Human | Colorectum | SER | 1.08e-06 | 6.75e-01 | -0.2196 |
| 5865 | RAB3B | HTA11_99999970781_79442 | Human | Colorectum | MSS | 5.27e-16 | 4.24e-01 | 0.294 |
| 5865 | RAB3B | LZE4T | Human | Esophagus | ESCC | 1.25e-18 | 6.15e-01 | 0.0811 |
| 5865 | RAB3B | LZE7T | Human | Esophagus | ESCC | 6.11e-12 | 5.78e-01 | 0.0667 |
| 5865 | RAB3B | P4T-E | Human | Esophagus | ESCC | 8.00e-03 | 1.15e-01 | 0.1323 |
| 5865 | RAB3B | P12T-E | Human | Esophagus | ESCC | 8.08e-19 | 3.82e-01 | 0.1122 |
| 5865 | RAB3B | P15T-E | Human | Esophagus | ESCC | 1.57e-28 | 6.94e-01 | 0.1149 |
| 5865 | RAB3B | P19T-E | Human | Esophagus | ESCC | 7.48e-03 | 2.50e-01 | 0.1662 |
| 5865 | RAB3B | P27T-E | Human | Esophagus | ESCC | 3.75e-03 | 1.56e-01 | 0.1055 |
| 5865 | RAB3B | P28T-E | Human | Esophagus | ESCC | 5.00e-17 | 3.75e-01 | 0.1149 |
| 5865 | RAB3B | P30T-E | Human | Esophagus | ESCC | 1.56e-07 | 3.92e-01 | 0.137 |
| 5865 | RAB3B | P48T-E | Human | Esophagus | ESCC | 3.97e-04 | 1.54e-01 | 0.0959 |
| 5865 | RAB3B | P52T-E | Human | Esophagus | ESCC | 4.12e-11 | 4.19e-01 | 0.1555 |
| 5865 | RAB3B | P61T-E | Human | Esophagus | ESCC | 2.42e-03 | 1.33e-01 | 0.099 |
| 5865 | RAB3B | P104T-E | Human | Esophagus | ESCC | 2.70e-02 | 1.48e-01 | 0.0931 |
| 5865 | RAB3B | P107T-E | Human | Esophagus | ESCC | 1.80e-06 | 2.34e-01 | 0.171 |
| 5865 | RAB3B | P127T-E | Human | Esophagus | ESCC | 1.72e-04 | 1.43e-01 | 0.0826 |
| 5865 | RAB3B | HCC1_Meng | Human | Liver | HCC | 1.25e-15 | 6.04e-02 | 0.0246 |
| Page: 1 2 |
| Tissue | Expression Dynamics | Abbreviation |
| Colorectum (GSE201348) | 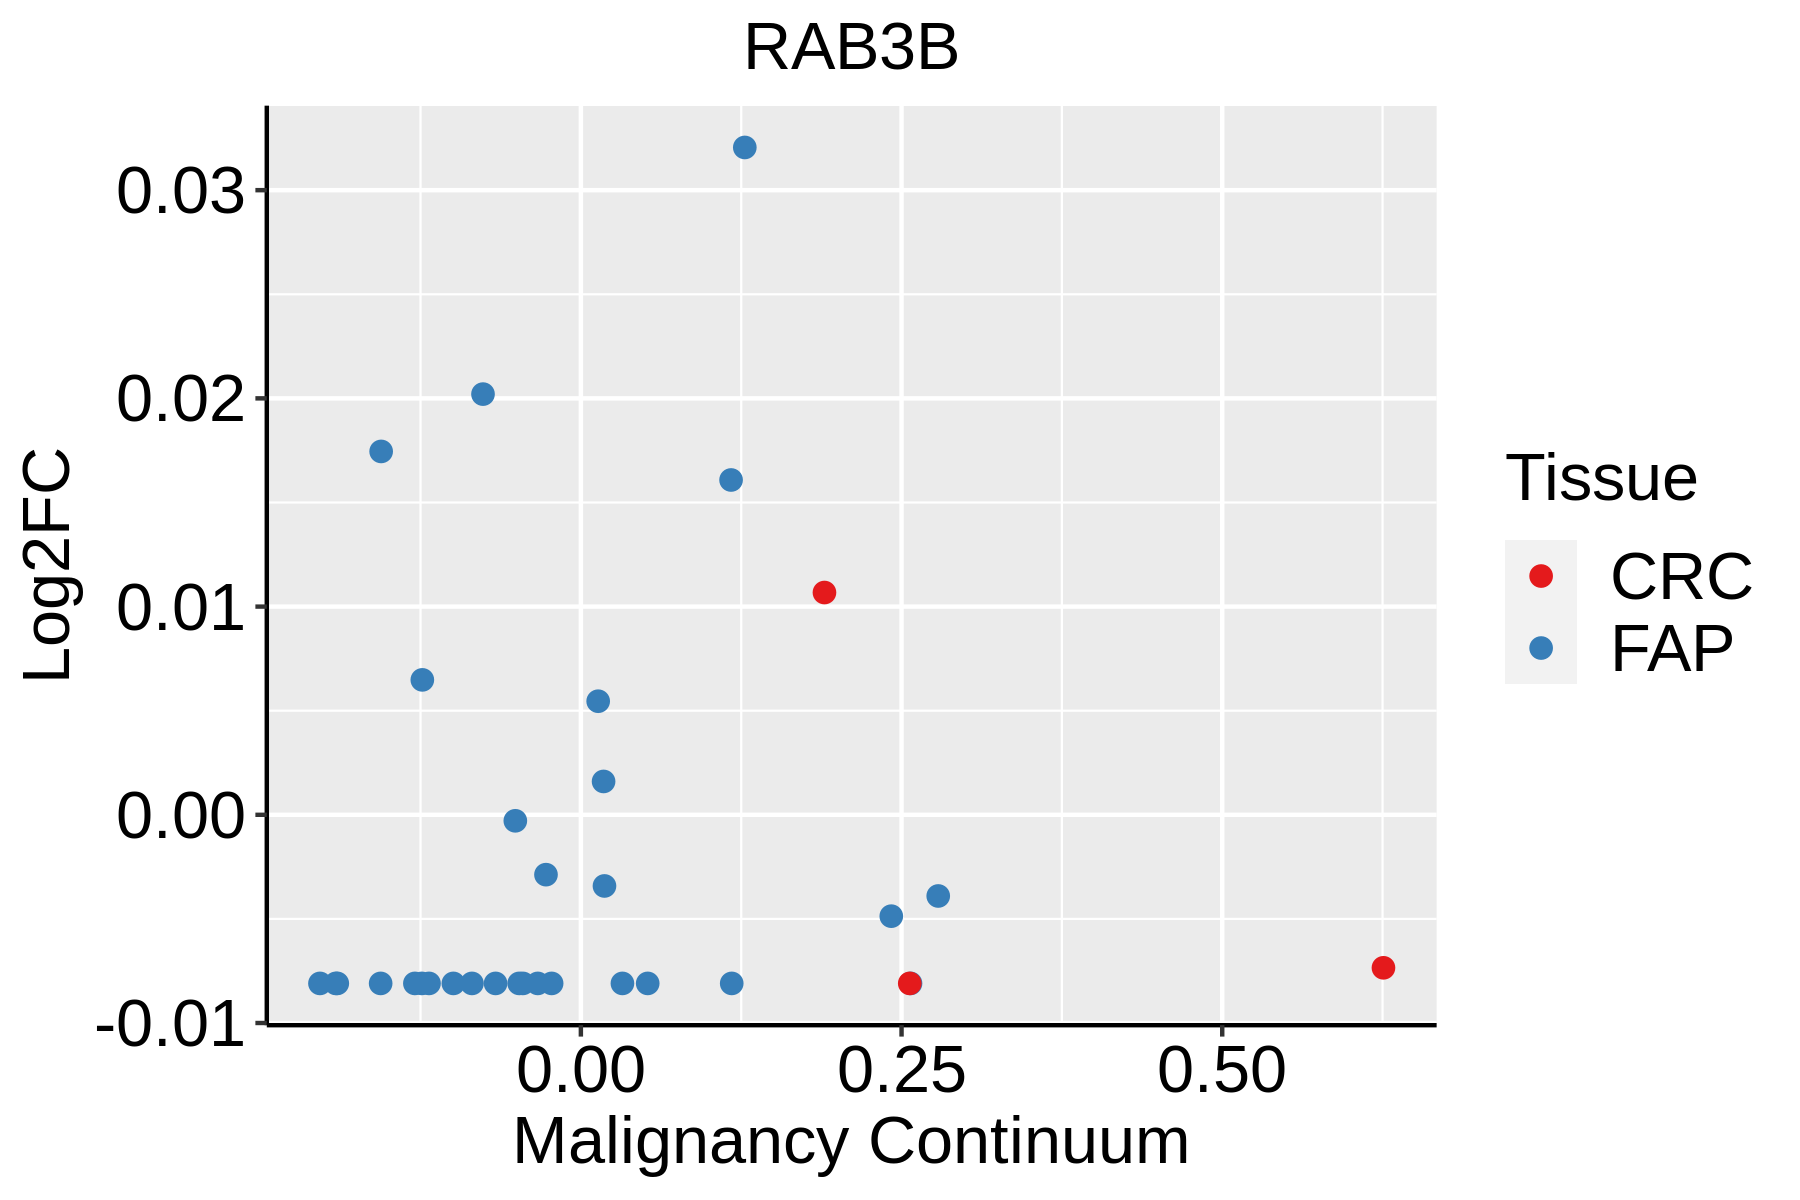 | FAP: Familial adenomatous polyposis |
| CRC: Colorectal cancer | ||
| Colorectum (HTA11) |  | AD: Adenomas |
| SER: Sessile serrated lesions | ||
| MSI-H: Microsatellite-high colorectal cancer | ||
| MSS: Microsatellite stable colorectal cancer | ||
| Esophagus | 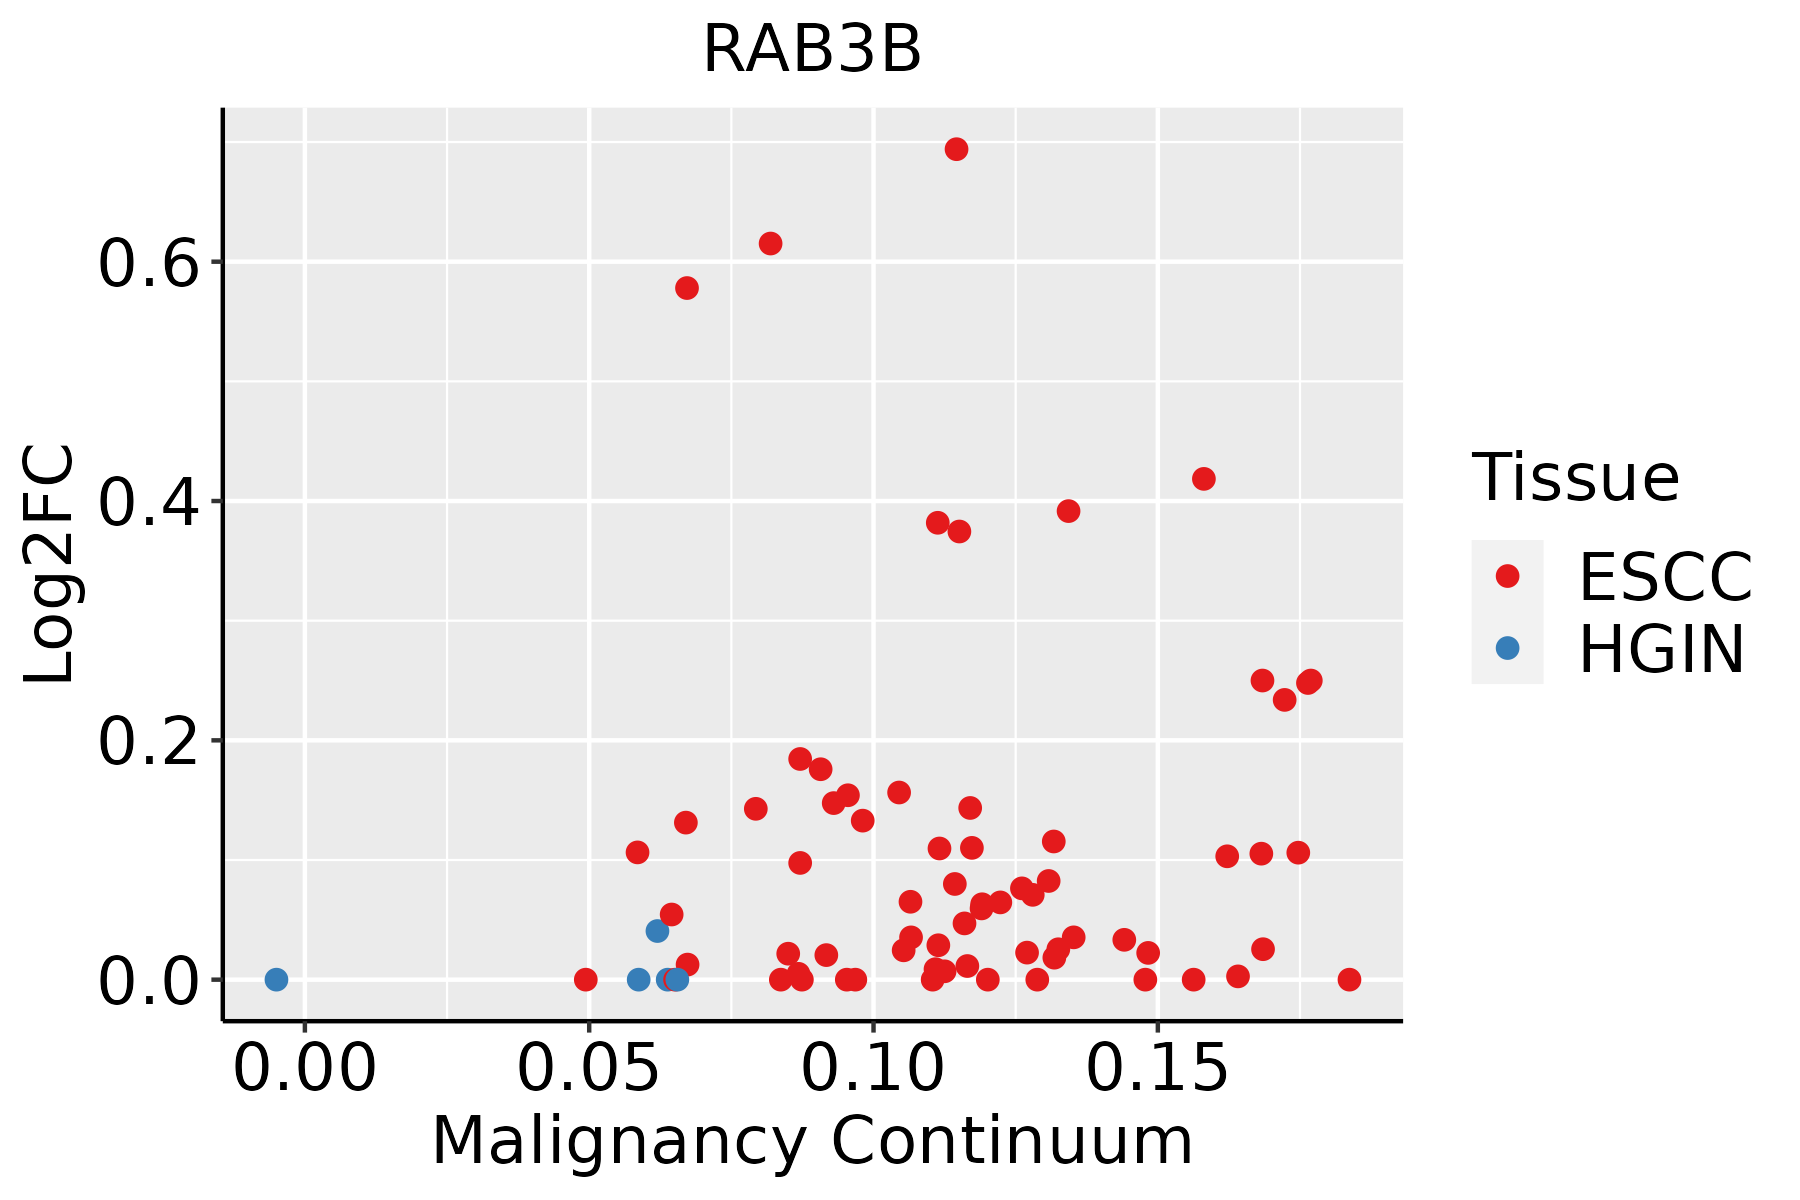 | ESCC: Esophageal squamous cell carcinoma |
| HGIN: High-grade intraepithelial neoplasias | ||
| LGIN: Low-grade intraepithelial neoplasias | ||
| Liver |  | HCC: Hepatocellular carcinoma |
| NAFLD: Non-alcoholic fatty liver disease | ||
| Prostate |  | BPH: Benign Prostatic Hyperplasia |
| Thyroid | 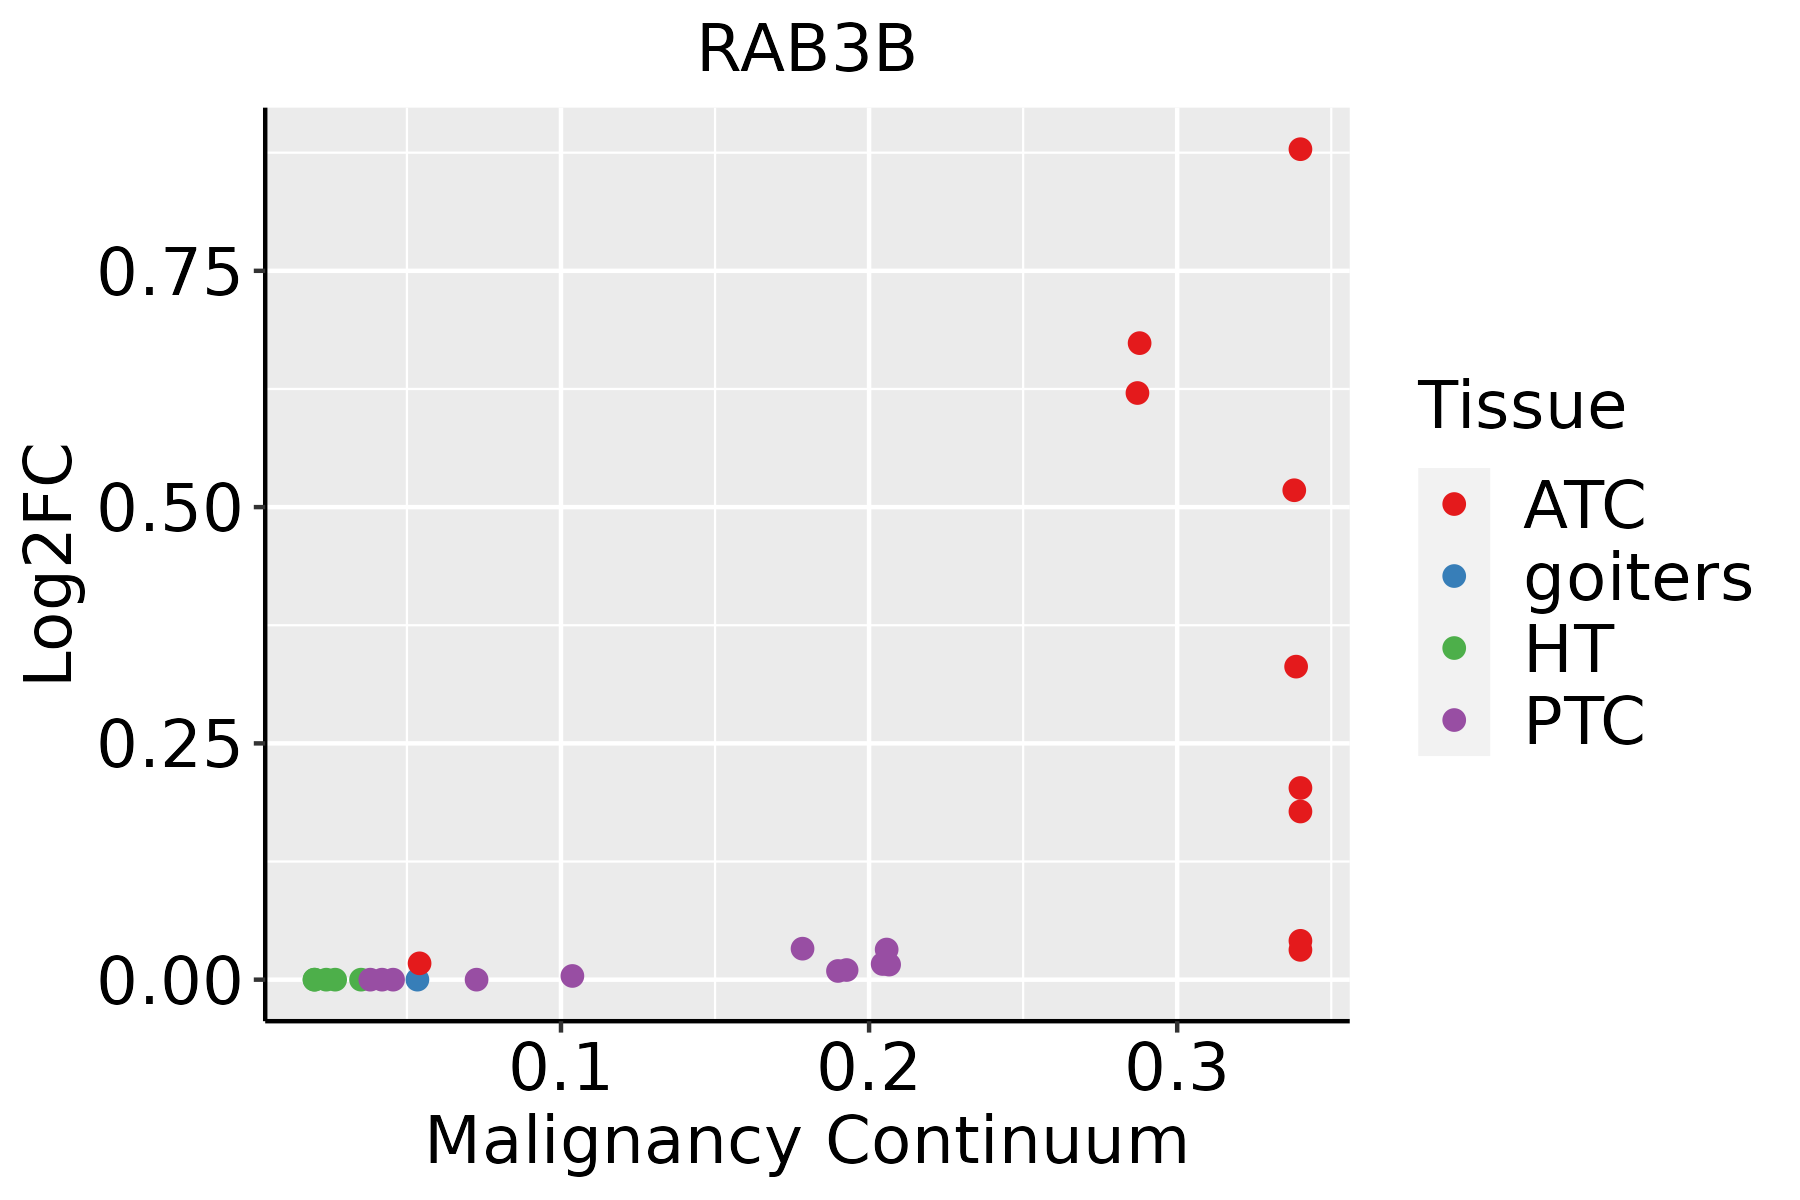 | ATC: Anaplastic thyroid cancer |
| HT: Hashimoto's thyroiditis | ||
| PTC: Papillary thyroid cancer |
| ∗log2FC in expression of this searched gene in stem-like cells from each diseased tissue sample relative to stem-like cells in normal samples in each tissue plotted against the malignancy continuum. Samples are colored based on if they are from different disease stage. |
Top |
Malignant transformation related pathway analysis |
| Find out the enriched GO biological processes and KEGG pathways involved in transition from healthy to precancer to cancer |
| Tissue | Disease Stage | Enriched GO biological Processes |
| Colorectum | AD |  |
| Colorectum | SER |  |
| Colorectum | MSS |  |
| Colorectum | MSI-H |  |
| Colorectum | FAP |  |
| ∗Top 15 enriched GO BP terms are showed in the bar plot of each disease state in each tissue. Each row represents a significant GO biological process which is colored according to the -log10(p.adjust). |
| Page: 1 2 3 4 5 6 7 8 9 |
| GO ID | Tissue | Disease Stage | Description | Gene Ratio | Bg Ratio | pvalue | p.adjust | Count |
| GO:00325351 | Colorectum | SER | regulation of cellular component size | 115/2897 | 383/18723 | 3.04e-13 | 1.10e-10 | 115 |
| GO:00726591 | Colorectum | SER | protein localization to plasma membrane | 92/2897 | 284/18723 | 6.36e-13 | 1.86e-10 | 92 |
| GO:19907781 | Colorectum | SER | protein localization to cell periphery | 98/2897 | 333/18723 | 6.09e-11 | 9.57e-09 | 98 |
| GO:00093061 | Colorectum | SER | protein secretion | 79/2897 | 359/18723 | 5.99e-04 | 8.19e-03 | 79 |
| GO:00355921 | Colorectum | SER | establishment of protein localization to extracellular region | 79/2897 | 360/18723 | 6.54e-04 | 8.77e-03 | 79 |
| GO:00716921 | Colorectum | SER | protein localization to extracellular region | 80/2897 | 368/18723 | 8.13e-04 | 1.01e-02 | 80 |
| GO:00224061 | Colorectum | SER | membrane docking | 25/2897 | 86/18723 | 9.88e-04 | 1.17e-02 | 25 |
| GO:00068871 | Colorectum | SER | exocytosis | 75/2897 | 352/18723 | 2.05e-03 | 2.03e-02 | 75 |
| GO:01400561 | Colorectum | SER | organelle localization by membrane tethering | 22/2897 | 77/18723 | 2.46e-03 | 2.32e-02 | 22 |
| GO:0019882 | Colorectum | SER | antigen processing and presentation | 28/2897 | 106/18723 | 2.52e-03 | 2.34e-02 | 28 |
| GO:00171571 | Colorectum | SER | regulation of exocytosis | 45/2897 | 202/18723 | 6.46e-03 | 4.63e-02 | 45 |
| GO:00726592 | Colorectum | MSS | protein localization to plasma membrane | 113/3467 | 284/18723 | 3.23e-17 | 1.55e-14 | 113 |
| GO:19907782 | Colorectum | MSS | protein localization to cell periphery | 120/3467 | 333/18723 | 2.02e-14 | 5.47e-12 | 120 |
| GO:00325352 | Colorectum | MSS | regulation of cellular component size | 127/3467 | 383/18723 | 3.44e-12 | 5.79e-10 | 127 |
| GO:00093062 | Colorectum | MSS | protein secretion | 98/3467 | 359/18723 | 2.43e-05 | 5.09e-04 | 98 |
| GO:00355922 | Colorectum | MSS | establishment of protein localization to extracellular region | 98/3467 | 360/18723 | 2.75e-05 | 5.58e-04 | 98 |
| GO:00716922 | Colorectum | MSS | protein localization to extracellular region | 99/3467 | 368/18723 | 4.17e-05 | 7.83e-04 | 99 |
| GO:00224062 | Colorectum | MSS | membrane docking | 28/3467 | 86/18723 | 1.27e-03 | 1.21e-02 | 28 |
| GO:00990031 | Colorectum | MSS | vesicle-mediated transport in synapse | 54/3467 | 200/18723 | 1.94e-03 | 1.67e-02 | 54 |
| GO:01400562 | Colorectum | MSS | organelle localization by membrane tethering | 25/3467 | 77/18723 | 2.34e-03 | 1.91e-02 | 25 |
| Page: 1 2 3 |
| Pathway ID | Tissue | Disease Stage | Description | Gene Ratio | Bg Ratio | pvalue | p.adjust | qvalue | Count |
| Page: 1 |
Top |
Cell-cell communication analysis |
| Identification of potential cell-cell interactions between two cell types and their ligand-receptor pairs for different disease states |
| Ligand | Receptor | LRpair | Pathway | Tissue | Disease Stage |
| Page: 1 |
Top |
Single-cell gene regulatory network inference analysis |
| Find out the significant the regulons (TFs) and the target genes of each regulon across cell types for different disease states |
| TF | Cell Type | Tissue | Disease Stage | Target Gene | RSS | Regulon Activity |
| ∗The dot plots of a searched regulon are shown for all cell subpopulations in each disease state of each tissue based on the regulon specific score inferred using pySCENIC and by calculating the average expression. |
| Page: 1 |
Top |
Somatic mutation of malignant transformation related genes |
| Annotation of somatic variants for genes involved in malignant transformation |
| Hugo Symbol | Variant Class | Variant Classification | dbSNP RS | HGVSc | HGVSp | HGVSp Short | SWISSPROT | BIOTYPE | SIFT | PolyPhen | Tumor Sample Barcode | Tissue | Histology | Sex | Age | Stage | Therapy Types | Drugs | Outcome |
| RAB3B | SNV | Missense_Mutation | rs755679595 | c.137C>T | p.Thr46Met | p.T46M | P20337 | protein_coding | deleterious(0.01) | probably_damaging(0.971) | TCGA-2W-A8YY-01 | Cervix | cervical & endocervical cancer | Female | <65 | I/II | Chemotherapy | cisplatin | CR |
| RAB3B | SNV | Missense_Mutation | novel | c.130G>A | p.Asp44Asn | p.D44N | P20337 | protein_coding | deleterious(0.03) | probably_damaging(0.986) | TCGA-VS-A958-01 | Cervix | cervical & endocervical cancer | Female | <65 | I/II | Chemotherapy | cisplatin | CR |
| RAB3B | SNV | Missense_Mutation | novel | c.204N>T | p.Glu68Asp | p.E68D | P20337 | protein_coding | tolerated(0.53) | benign(0) | TCGA-AA-3984-01 | Colorectum | colon adenocarcinoma | Female | <65 | I/II | Unknown | Unknown | SD |
| RAB3B | SNV | Missense_Mutation | novel | c.322G>A | p.Glu108Lys | p.E108K | P20337 | protein_coding | tolerated(0.43) | possibly_damaging(0.798) | TCGA-AZ-4315-01 | Colorectum | colon adenocarcinoma | Male | <65 | I/II | Unknown | Unknown | SD |
| RAB3B | SNV | Missense_Mutation | rs367856145 | c.614G>A | p.Arg205His | p.R205H | P20337 | protein_coding | tolerated(0.06) | benign(0.015) | TCGA-CK-4951-01 | Colorectum | colon adenocarcinoma | Female | >=65 | I/II | Unknown | Unknown | PD |
| RAB3B | SNV | Missense_Mutation | rs764753734 | c.197G>A | p.Arg66His | p.R66H | P20337 | protein_coding | tolerated(0.11) | probably_damaging(0.986) | TCGA-WS-AB45-01 | Colorectum | colon adenocarcinoma | Female | <65 | I/II | Unknown | Unknown | SD |
| RAB3B | SNV | Missense_Mutation | novel | c.101G>A | p.Gly34Asp | p.G34D | P20337 | protein_coding | deleterious(0) | probably_damaging(0.999) | TCGA-F5-6814-01 | Colorectum | rectum adenocarcinoma | Male | <65 | I/II | Unknown | Unknown | SD |
| RAB3B | SNV | Missense_Mutation | novel | c.37N>T | p.Asp13Tyr | p.D13Y | P20337 | protein_coding | deleterious(0) | possibly_damaging(0.897) | TCGA-AJ-A3EL-01 | Endometrium | uterine corpus endometrioid carcinoma | Female | <65 | I/II | Unknown | Unknown | SD |
| RAB3B | SNV | Missense_Mutation | novel | c.322G>A | p.Glu108Lys | p.E108K | P20337 | protein_coding | tolerated(0.43) | possibly_damaging(0.798) | TCGA-AP-A1E0-01 | Endometrium | uterine corpus endometrioid carcinoma | Female | <65 | III/IV | Chemotherapy | paclitaxel | SD |
| RAB3B | SNV | Missense_Mutation | rs368797055 | c.587N>T | p.Ser196Leu | p.S196L | P20337 | protein_coding | tolerated(0.07) | benign(0.028) | TCGA-AX-A05Z-01 | Endometrium | uterine corpus endometrioid carcinoma | Female | <65 | III/IV | Chemotherapy | adriamycin | SD |
| Page: 1 2 3 |
Top |
Related drugs of malignant transformation related genes |
| Identification of chemicals and drugs interact with genes involved in malignant transfromation |
| (DGIdb 4.0) |
| Entrez ID | Symbol | Category | Interaction Types | Drug Claim Name | Drug Name | PMIDs |
| Page: 1 |

Copyright 2023-Present -The University of Texas Health Science Center at Houston |