Schematic overview of the cellular and molecular mechanisms involved in the cancer progression, including the proposed cellular and molecular mechanisms in cancer cells trajectory. AT1: alveolar type 1 cells; AT2: alveolar type 2 cells; AAH: atypical adenomatous hyperplasia; AIS: adenocarcinoma in situ; MIA: minimally invasive adenocarcinoma; IA: invasive adenocarcinoma; EMT: epithelial-mesenchymal transition

Home

Download

Statistics

Help

Contact

Center for Computational Systems Medicine
leaf

Gene summary

leaf

Malignant transformation analysis

leaf

Malignant transformation related pathway analysis

leaf

Cell-cell communication analysis

leaf

Single-cell gene regulatory network inference analysis

leaf

Somatic mutation of malignant transformation related genes

leaf

Related drugs of malignant transformation related genes

Gene: RAB38

Gene summary for RAB38

check button Gene summary.

Gene informationSpeciesHuman
Gene symbol

RAB38

Gene ID

23682

Gene nameRAB38, member RAS oncogene family
Gene AliasNY-MEL-1
Cytomap11q14.2
Gene Typeprotein-coding
GO ID

GO:0006629

UniProtAcc

A0A024R191


Top

Malignant transformation analysis

check button Identification of the aberrant gene expression in precancerous and cancerous lesions by comparing the gene expression of stem-like cells in diseased tissues with normal stem cells
check button Malignant transformation involving gene list.
Entrez IDSymbolReplicatesSpeciesOrganTissueAdj P-valueLog2FCMalignancy
23682RAB38TumorHumanCervixCC3.99e-528.88e-010.1241
23682RAB38sample3HumanCervixCC1.68e-507.90e-010.1387
23682RAB38T3HumanCervixCC1.76e-488.21e-010.1389
23682RAB38LZE2THumanEsophagusESCC1.97e-033.91e-010.082
23682RAB38LZE4THumanEsophagusESCC5.62e-134.15e-010.0811
23682RAB38LZE8THumanEsophagusESCC8.90e-053.87e-010.067
23682RAB38LZE20THumanEsophagusESCC1.85e-091.96e-010.0662
23682RAB38LZE24THumanEsophagusESCC4.40e-062.36e-010.0596
23682RAB38LZE6THumanEsophagusESCC7.52e-033.90e-010.0845
23682RAB38P1T-EHumanEsophagusESCC1.74e-084.04e-010.0875
23682RAB38P2T-EHumanEsophagusESCC2.38e-102.70e-010.1177
23682RAB38P4T-EHumanEsophagusESCC8.15e-339.91e-010.1323
23682RAB38P5T-EHumanEsophagusESCC2.27e-327.92e-010.1327
23682RAB38P8T-EHumanEsophagusESCC1.26e-083.00e-010.0889
23682RAB38P9T-EHumanEsophagusESCC3.14e-328.52e-010.1131
23682RAB38P10T-EHumanEsophagusESCC2.42e-061.33e-010.116
23682RAB38P11T-EHumanEsophagusESCC3.16e-171.11e+000.1426
23682RAB38P12T-EHumanEsophagusESCC1.82e-072.87e-010.1122
23682RAB38P15T-EHumanEsophagusESCC1.52e-133.16e-010.1149
23682RAB38P16T-EHumanEsophagusESCC2.37e-164.17e-010.1153
Page: 1 2 3 4 5 

check button Transcriptomic changes along malignancy continuum.
TissueExpression DynamicsAbbreviation
CervixThe image shows the transcriptomic changes along malignancy continuum.log2FC in expression of this searched gene in stem-like cells from each diseased tissue sample relative to stem-like cells in normal samples in each tissue plotted against the malignancy continuum. Samples are colored based on if they are from different disease stage.CC: Cervix cancer
HSIL_HPV: HPV-infected high-grade squamous intraepithelial lesions
N_HPV: HPV-infected normal cervix
EsophagusThe image shows the transcriptomic changes along malignancy continuum.log2FC in expression of this searched gene in stem-like cells from each diseased tissue sample relative to stem-like cells in normal samples in each tissue plotted against the malignancy continuum. Samples are colored based on if they are from different disease stage.ESCC: Esophageal squamous cell carcinoma
HGIN: High-grade intraepithelial neoplasias
LGIN: Low-grade intraepithelial neoplasias
Oral CavityThe image shows the transcriptomic changes along malignancy continuum.log2FC in expression of this searched gene in stem-like cells from each diseased tissue sample relative to stem-like cells in normal samples in each tissue plotted against the malignancy continuum. Samples are colored based on if they are from different disease stage.
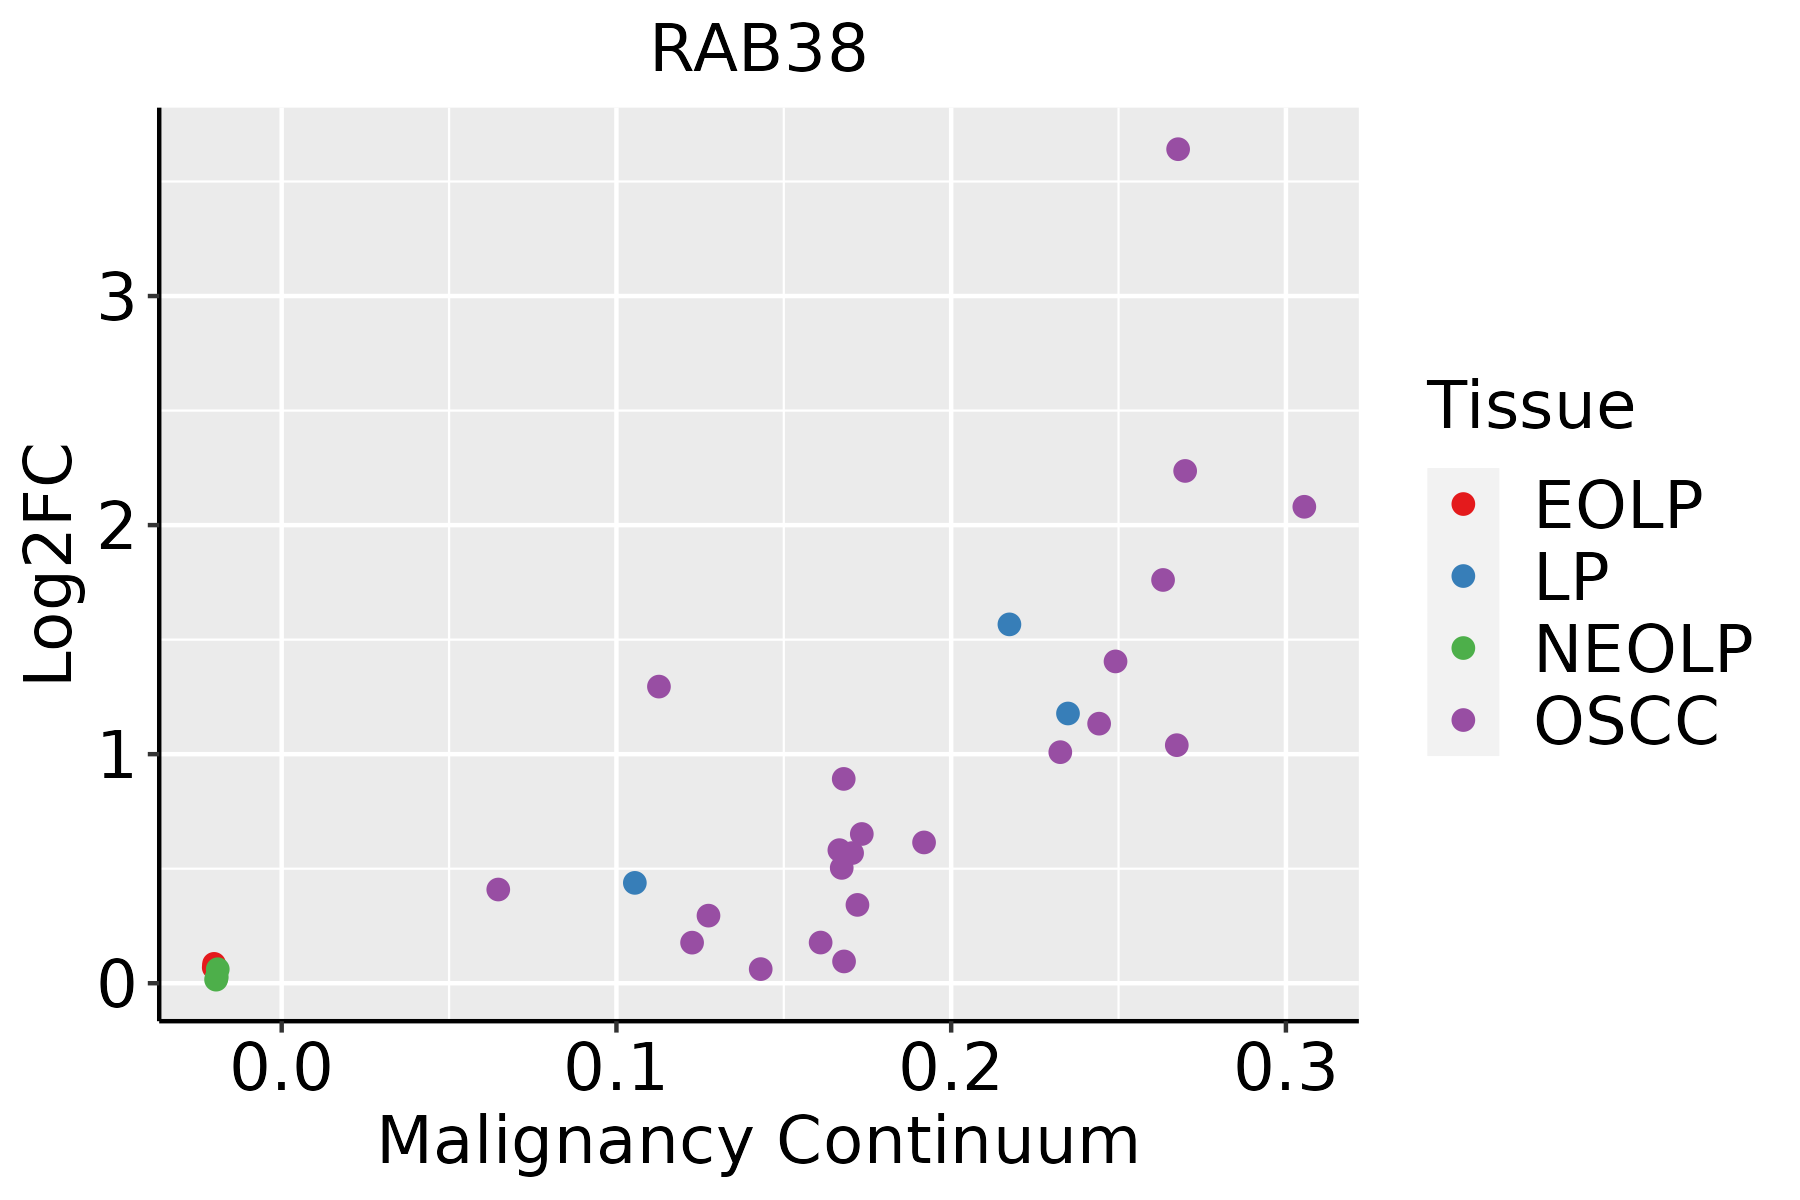
EOLP: Erosive Oral lichen planus
LP: leukoplakia
NEOLP: Non-erosive oral lichen planus
OSCC: Oral squamous cell carcinoma
SkinThe image shows the transcriptomic changes along malignancy continuum.log2FC in expression of this searched gene in stem-like cells from each diseased tissue sample relative to stem-like cells in normal samples in each tissue plotted against the malignancy continuum. Samples are colored based on if they are from different disease stage.
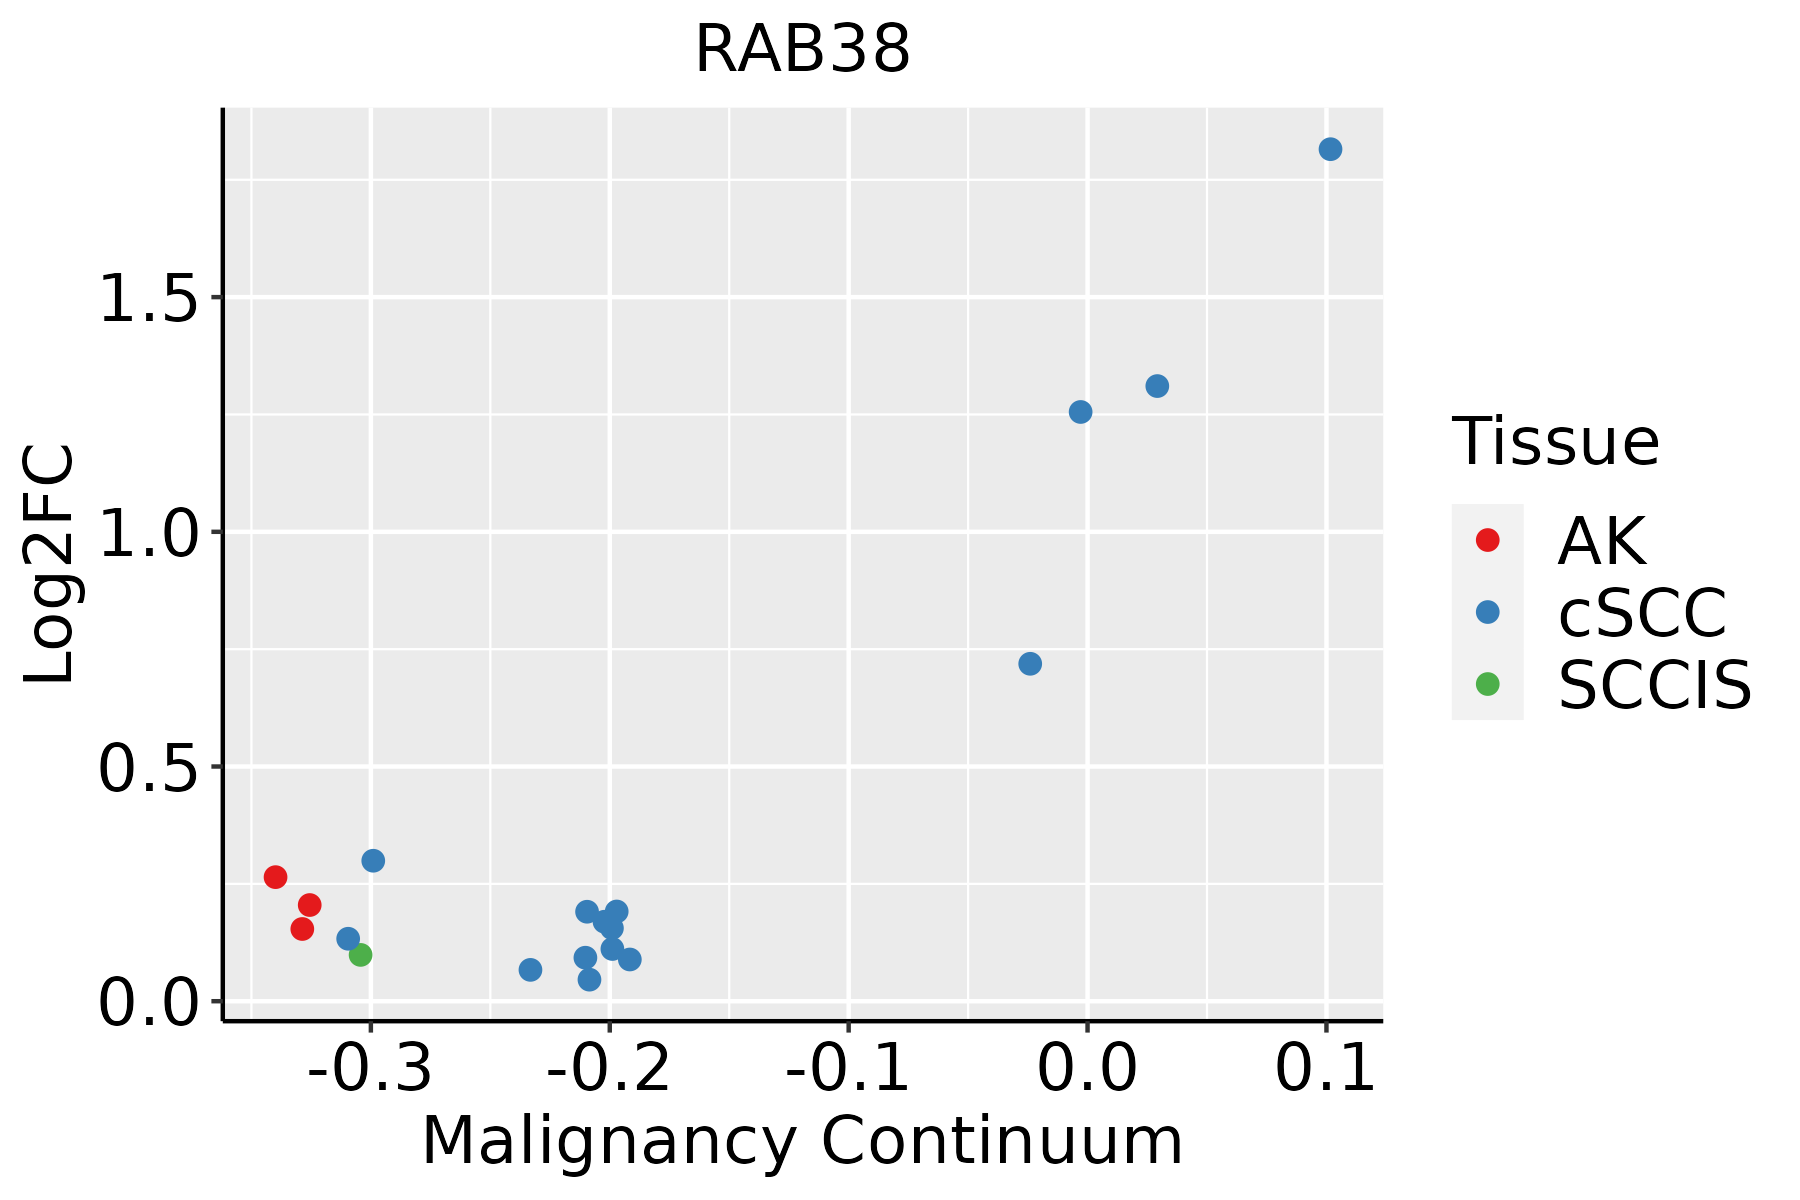
AK: Actinic keratosis
cSCC: Cutaneous squamous cell carcinoma
SCCIS:squamous cell carcinoma in situ
∗log2FC in expression of this searched gene in stem-like cells from each diseased tissue sample relative to stem-like cells in normal samples in each tissue plotted against the malignancy continuum. Samples are colored based on if they are from different disease stage.

Top

Malignant transformation related pathway analysis

check buttonFind out the enriched GO biological processes and KEGG pathways involved in transition from healthy to precancer to cancer
check button Figure of enriched GO biological processes.
TissueDisease StageEnriched GO biological Processes
ColorectumADGO analysis - Figure of enriched GO biological processes: Top 15 enriched GO BP terms are showed in the bar plot of each disease state in each tissue. Each row represents a significant GO biological process which is colored according to the -log10(p.adjust).
ColorectumSERGO analysis - Figure of enriched GO biological processes: Top 15 enriched GO BP terms are showed in the bar plot of each disease state in each tissue. Each row represents a significant GO biological process which is colored according to the -log10(p.adjust).
ColorectumMSSGO analysis - Figure of enriched GO biological processes: Top 15 enriched GO BP terms are showed in the bar plot of each disease state in each tissue. Each row represents a significant GO biological process which is colored according to the -log10(p.adjust).
ColorectumMSI-HGO analysis - Figure of enriched GO biological processes: Top 15 enriched GO BP terms are showed in the bar plot of each disease state in each tissue. Each row represents a significant GO biological process which is colored according to the -log10(p.adjust).
ColorectumFAPGO analysis - Figure of enriched GO biological processes: Top 15 enriched GO BP terms are showed in the bar plot of each disease state in each tissue. Each row represents a significant GO biological process which is colored according to the -log10(p.adjust).
∗Top 15 enriched GO BP terms are showed in the bar plot of each disease state in each tissue. Each row represents a significant GO biological process which is colored according to the -log10(p.adjust).
Page: 1 2 3 4 5 6 7 8 9 

check button Enriched GO biological processes.
GO IDTissueDisease StageDescriptionGene RatioBg Ratiopvaluep.adjustCount
GO:00160506CervixCCvesicle organization54/2311300/187232.71e-031.85e-0254
GO:001605014EsophagusESCCvesicle organization211/8552300/187232.85e-182.87e-16211
GO:00086544EsophagusESCCphospholipid biosynthetic process162/8552253/187232.59e-095.73e-08162
GO:00464744EsophagusESCCglycerophospholipid biosynthetic process135/8552211/187235.75e-081.02e-06135
GO:00450175EsophagusESCCglycerolipid biosynthetic process154/8552252/187235.20e-076.96e-06154
GO:00066446EsophagusESCCphospholipid metabolic process218/8552383/187235.37e-065.59e-05218
GO:00330593EsophagusESCCcellular pigmentation40/855253/187239.67e-069.21e-0540
GO:00066561EsophagusESCCphosphatidylcholine biosynthetic process24/855229/187234.50e-053.55e-0424
GO:00066505EsophagusESCCglycerophospholipid metabolic process174/8552306/187234.92e-053.85e-04174
GO:00487531EsophagusESCCpigment granule organization23/855229/187232.25e-041.40e-0323
GO:00324381EsophagusESCCmelanosome organization22/855228/187233.95e-042.26e-0322
GO:00464864EsophagusESCCglycerolipid metabolic process211/8552392/187236.51e-043.46e-03211
GO:00514521EsophagusESCCintracellular pH reduction29/855242/187231.87e-038.46e-0329
GO:0090382EsophagusESCCphagosome maturation19/855225/187232.03e-039.08e-0319
GO:00458511EsophagusESCCpH reduction31/855246/187232.42e-031.06e-0231
GO:00434731EsophagusESCCpigmentation59/855298/187232.64e-031.12e-0259
GO:0035646EsophagusESCCendosome to melanosome transport9/855210/187235.09e-031.92e-029
GO:0043485EsophagusESCCendosome to pigment granule transport9/855210/187235.09e-031.92e-029
GO:0048757EsophagusESCCpigment granule maturation9/855210/187235.09e-031.92e-029
GO:01501724EsophagusESCCregulation of phosphatidylcholine metabolic process9/855210/187235.09e-031.92e-029
Page: 1 2 3 

check button Enriched KEGG pathways.
Pathway IDTissueDisease StageDescriptionGene RatioBg Ratiopvaluep.adjustqvalueCount
Page: 1 

Top

Cell-cell communication analysis

check buttonIdentification of potential cell-cell interactions between two cell types and their ligand-receptor pairs for different disease states
LigandReceptorLRpairPathwayTissueDisease Stage
Page: 1 

Top

Single-cell gene regulatory network inference analysis

check buttonFind out the significant the regulons (TFs) and the target genes of each regulon across cell types for different disease states
TFCell TypeTissueDisease StageTarget GeneRSSRegulon Activity
∗The dot plots of a searched regulon are shown for all cell subpopulations in each disease state of each tissue based on the regulon specific score inferred using pySCENIC and by calculating the average expression.
Page: 1 

Top

Somatic mutation of malignant transformation related genes

check buttonAnnotation of somatic variants for genes involved in malignant transformation
Hugo SymbolVariant ClassVariant ClassificationdbSNP RSHGVScHGVSpHGVSp ShortSWISSPROTBIOTYPESIFTPolyPhenTumor Sample BarcodeTissueHistologySexAgeStageTherapy TypesDrugsOutcome
RAB38SNVMissense_Mutationnovelc.118N>Tp.Ala40Serp.A40SP57729protein_codingtolerated(0.27)possibly_damaging(0.859)TCGA-A7-A0DB-01Breastbreast invasive carcinomaFemale<65I/IIHormone TherapyarimidexSD
RAB38SNVMissense_Mutationc.8N>Tp.Ala3Valp.A3VP57729protein_codingtolerated(0.15)benign(0.02)TCGA-BH-A0HF-01Breastbreast invasive carcinomaFemale>=65I/IIHormone TherapyarimidexSD
RAB38SNVMissense_Mutationc.149N>Ap.Val50Glup.V50EP57729protein_codingdeleterious(0.03)probably_damaging(0.98)TCGA-BH-A1FM-01Breastbreast invasive carcinomaFemale<65III/IVUnknownUnknownSD
RAB38insertionFrame_Shift_Insnovelc.66_67insGAGCAATTTAACTCCCp.Thr23GlufsTer82p.T23Efs*82P57729protein_codingTCGA-AN-A0FV-01Breastbreast invasive carcinomaFemale<65I/IIUnknownUnknownSD
RAB38SNVMissense_Mutationnovelc.548N>Gp.Asp183Glyp.D183GP57729protein_codingtolerated(0.21)benign(0)TCGA-2W-A8YY-01Cervixcervical & endocervical cancerFemale<65I/IIChemotherapycisplatinCR
RAB38SNVMissense_Mutationc.272A>Tp.Asp91Valp.D91VP57729protein_codingdeleterious(0)probably_damaging(1)TCGA-AA-A02R-01Colorectumcolon adenocarcinomaFemale>=65I/IIUnknownUnknownPD
RAB38SNVMissense_Mutationrs765696305c.313N>Gp.Lys105Glup.K105EP57729protein_codingdeleterious(0)probably_damaging(1)TCGA-AZ-6598-01Colorectumcolon adenocarcinomaFemale>=65I/IIUnknownUnknownSD
RAB38SNVMissense_Mutationrs777409146c.505N>Ap.Ala169Thrp.A169TP57729protein_codingdeleterious(0.01)probably_damaging(0.997)TCGA-A5-A0G2-01Endometriumuterine corpus endometrioid carcinomaFemale<65III/IVUnknownUnknownSD
RAB38SNVMissense_Mutationnovelc.483N>Tp.Lys161Asnp.K161NP57729protein_codingdeleterious(0)probably_damaging(0.998)TCGA-AX-A05Z-01Endometriumuterine corpus endometrioid carcinomaFemale<65III/IVChemotherapyadriamycinSD
RAB38SNVMissense_Mutationnovelc.230G>Ap.Arg77Lysp.R77KP57729protein_codingdeleterious(0)probably_damaging(0.919)TCGA-AX-A06F-01Endometriumuterine corpus endometrioid carcinomaFemale<65III/IVChemotherapycarboplatinSD
Page: 1 2 3 

Top

Related drugs of malignant transformation related genes

check buttonIdentification of chemicals and drugs interact with genes involved in malignant transfromation
(DGIdb 4.0)
Entrez IDSymbolCategoryInteraction TypesDrug Claim NameDrug NamePMIDs
Page: 1