
|
|||||
|
 | |
| |
| |
| |
| |
| |
|
Gene: RAB34 |
Gene summary for RAB34 |
| Gene information | Species | Human | Gene symbol | RAB34 | Gene ID | 83871 |
| Gene name | RAB34, member RAS oncogene family | |
| Gene Alias | NARR | |
| Cytomap | 17q11.2 | |
| Gene Type | protein-coding | GO ID | GO:0001845 | UniProtAcc | B4DNC0 |
Top |
Malignant transformation analysis |
| Identification of the aberrant gene expression in precancerous and cancerous lesions by comparing the gene expression of stem-like cells in diseased tissues with normal stem cells |
| Entrez ID | Symbol | Replicates | Species | Organ | Tissue | Adj P-value | Log2FC | Malignancy |
| 83871 | RAB34 | AEH-subject1 | Human | Endometrium | AEH | 1.09e-16 | -4.26e-01 | -0.3059 |
| 83871 | RAB34 | AEH-subject2 | Human | Endometrium | AEH | 7.87e-11 | -3.98e-01 | -0.2525 |
| 83871 | RAB34 | AEH-subject3 | Human | Endometrium | AEH | 4.34e-15 | -4.27e-01 | -0.2576 |
| 83871 | RAB34 | AEH-subject4 | Human | Endometrium | AEH | 2.39e-13 | -3.82e-01 | -0.2657 |
| 83871 | RAB34 | AEH-subject5 | Human | Endometrium | AEH | 1.27e-27 | -5.96e-01 | -0.2953 |
| 83871 | RAB34 | EEC-subject1 | Human | Endometrium | EEC | 1.44e-19 | -4.63e-01 | -0.2682 |
| 83871 | RAB34 | EEC-subject2 | Human | Endometrium | EEC | 2.05e-18 | -4.76e-01 | -0.2607 |
| 83871 | RAB34 | EEC-subject3 | Human | Endometrium | EEC | 1.70e-42 | -5.83e-01 | -0.2525 |
| 83871 | RAB34 | EEC-subject4 | Human | Endometrium | EEC | 2.72e-13 | -4.60e-01 | -0.2571 |
| 83871 | RAB34 | EEC-subject5 | Human | Endometrium | EEC | 2.50e-12 | -3.93e-01 | -0.249 |
| 83871 | RAB34 | GSM5276934 | Human | Endometrium | EEC | 6.95e-06 | -2.56e-01 | -0.0913 |
| 83871 | RAB34 | GSM5276935 | Human | Endometrium | EEC | 1.23e-02 | -3.00e-01 | -0.123 |
| 83871 | RAB34 | GSM6177620_NYU_UCEC1_lib1_lib1 | Human | Endometrium | EEC | 6.83e-27 | -2.87e-01 | -0.1869 |
| 83871 | RAB34 | GSM6177620_NYU_UCEC1_lib2_lib2 | Human | Endometrium | EEC | 5.52e-27 | -4.21e-01 | -0.1875 |
| 83871 | RAB34 | GSM6177620_NYU_UCEC1_lib3_lib3 | Human | Endometrium | EEC | 2.27e-32 | -3.66e-01 | -0.1883 |
| 83871 | RAB34 | GSM6177621_NYU_UCEC2_lib1_lib1 | Human | Endometrium | EEC | 1.55e-28 | -3.71e-01 | -0.1934 |
| 83871 | RAB34 | GSM6177622_NYU_UCEC3_lib1_lib1 | Human | Endometrium | EEC | 1.13e-37 | -2.96e-01 | -0.1917 |
| 83871 | RAB34 | GSM6177622_NYU_UCEC3_lib2_lib2 | Human | Endometrium | EEC | 1.09e-34 | -1.88e-01 | -0.1916 |
| 83871 | RAB34 | GSM6177623_NYU_UCEC3_Vis | Human | Endometrium | EEC | 2.02e-05 | 1.09e-01 | -0.1269 |
| 83871 | RAB34 | LZE4T | Human | Esophagus | ESCC | 6.18e-18 | 5.41e-01 | 0.0811 |
| Page: 1 2 3 4 5 6 7 |
| Tissue | Expression Dynamics | Abbreviation |
| Endometrium |  | AEH: Atypical endometrial hyperplasia |
| EEC: Endometrioid Cancer | ||
| Esophagus | 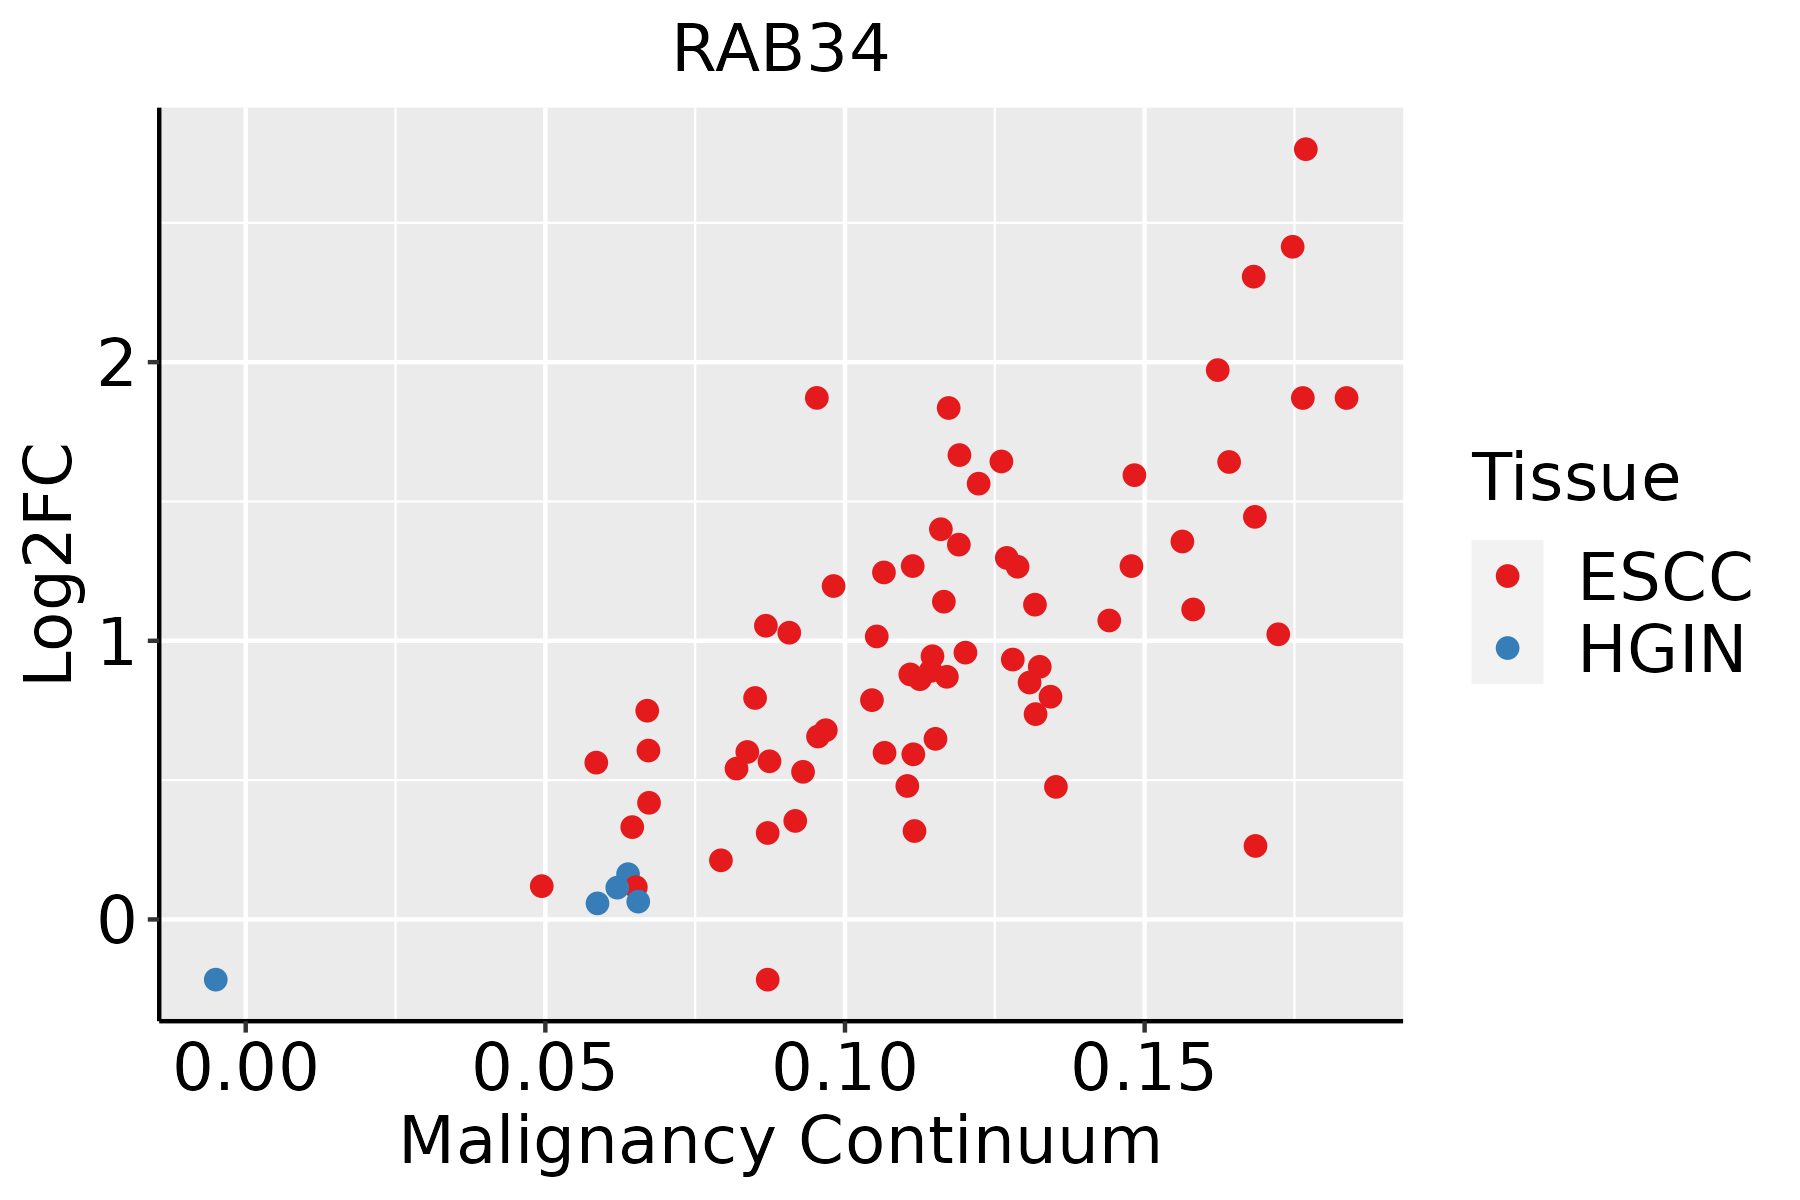 | ESCC: Esophageal squamous cell carcinoma |
| HGIN: High-grade intraepithelial neoplasias | ||
| LGIN: Low-grade intraepithelial neoplasias | ||
| Liver |  | HCC: Hepatocellular carcinoma |
| NAFLD: Non-alcoholic fatty liver disease | ||
| Oral Cavity | 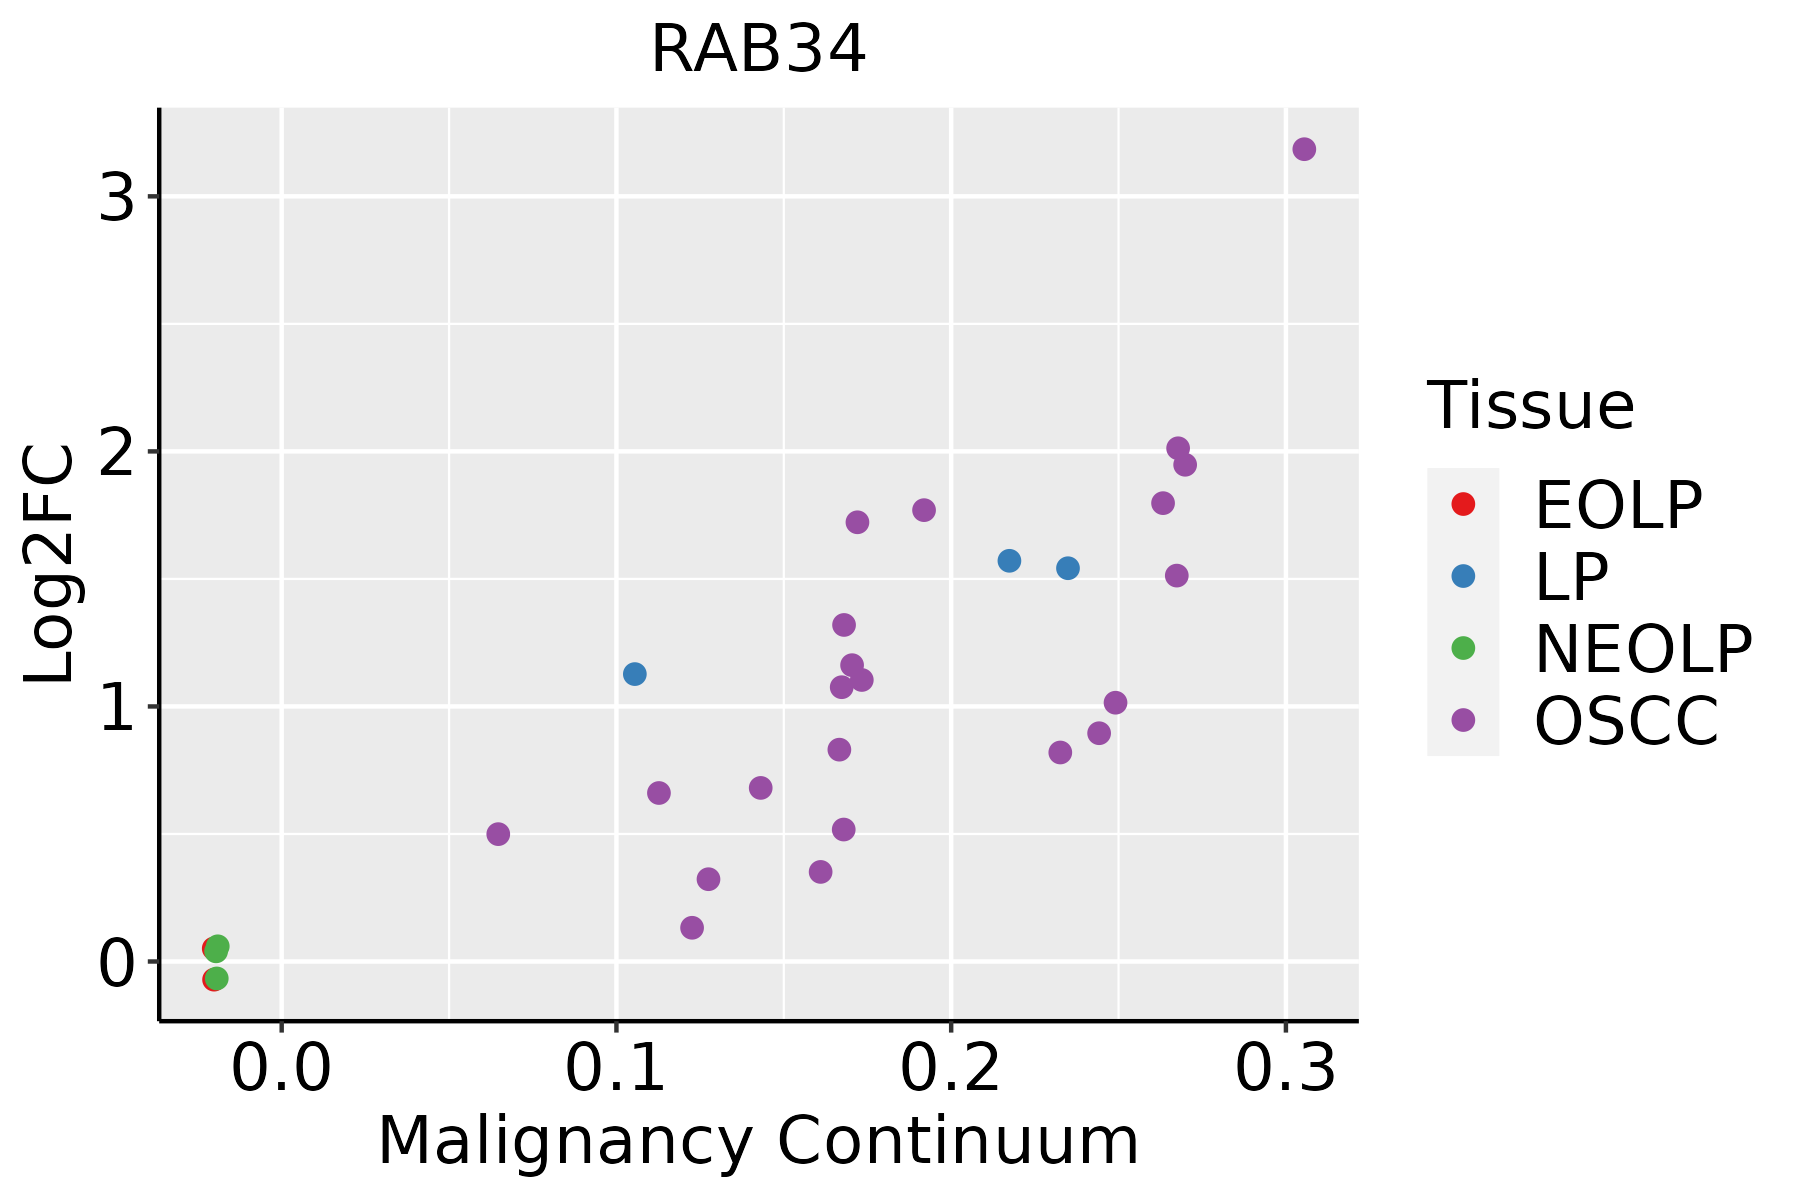 | EOLP: Erosive Oral lichen planus |
| LP: leukoplakia | ||
| NEOLP: Non-erosive oral lichen planus | ||
| OSCC: Oral squamous cell carcinoma | ||
| Skin | 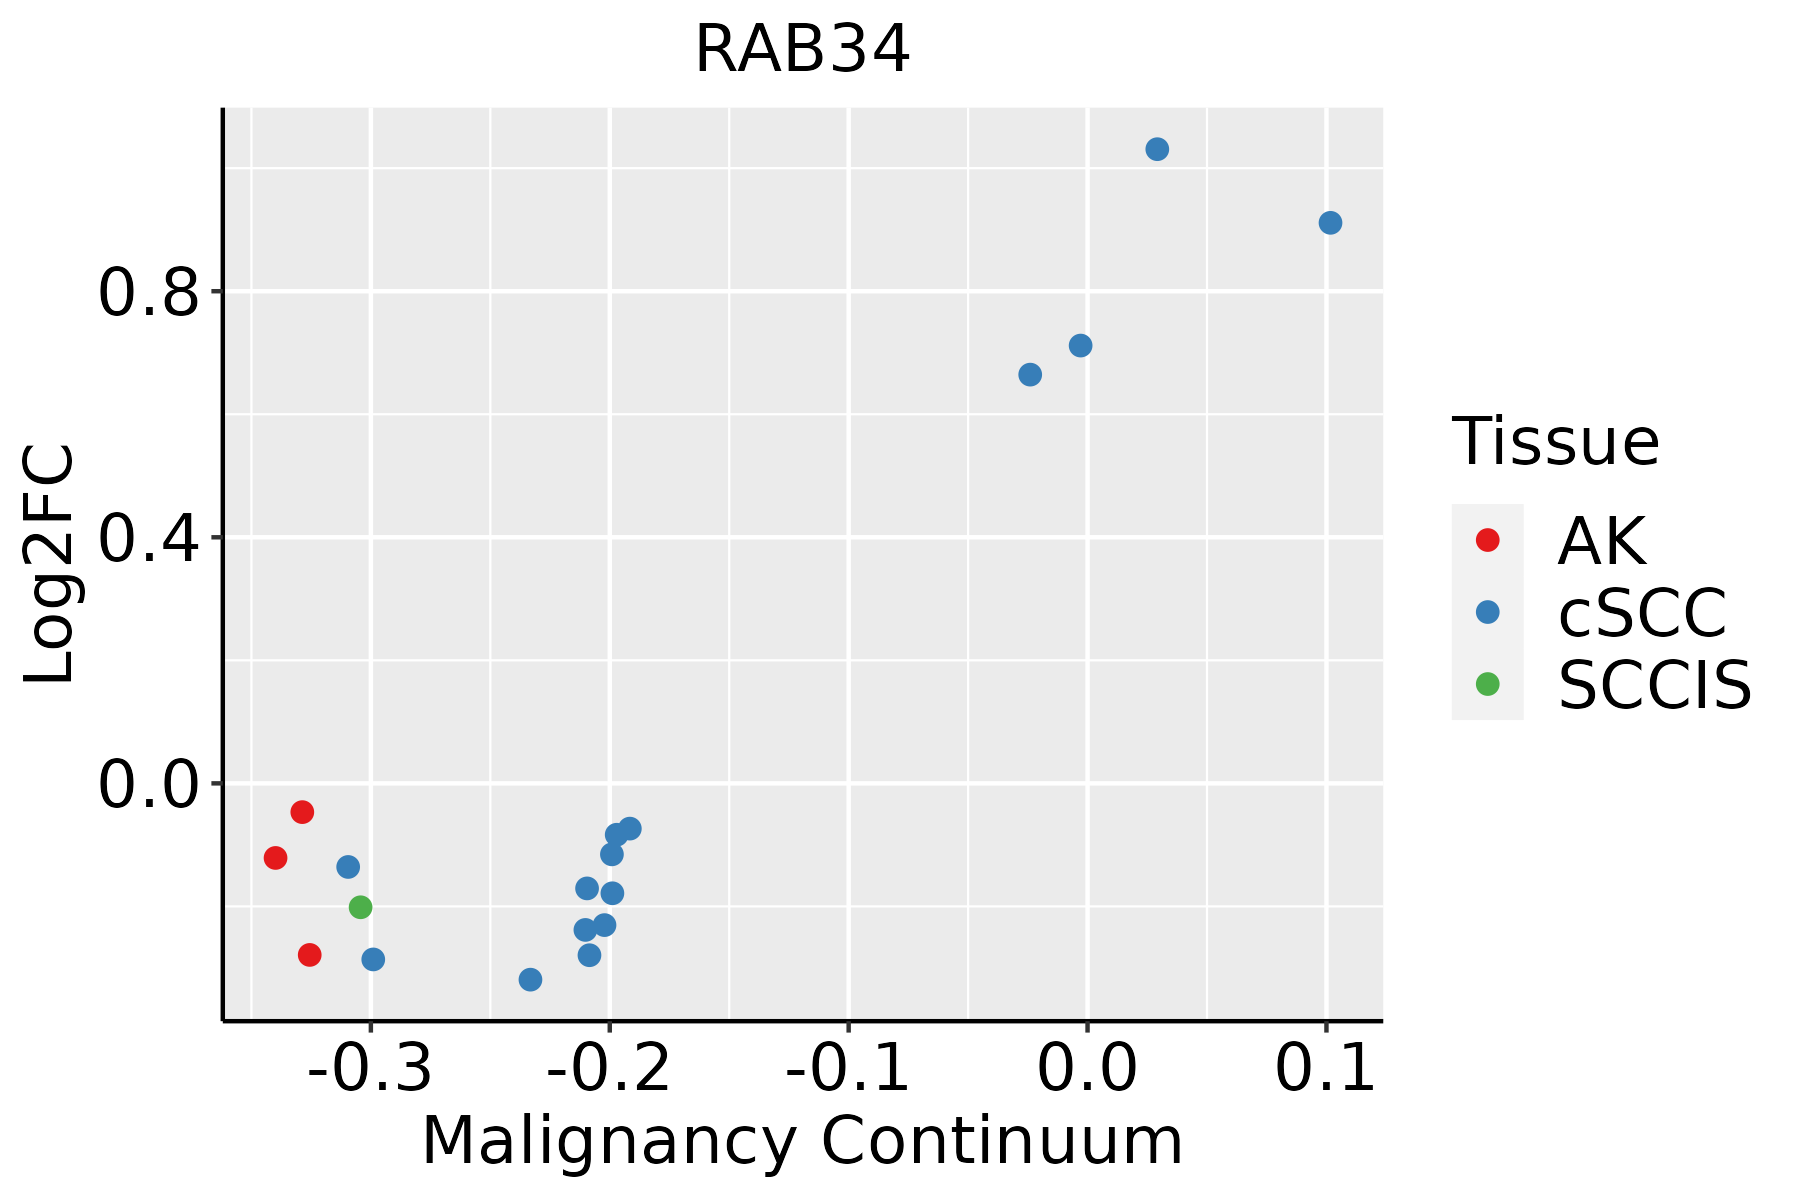 | AK: Actinic keratosis |
| cSCC: Cutaneous squamous cell carcinoma | ||
| SCCIS:squamous cell carcinoma in situ | ||
| Thyroid | 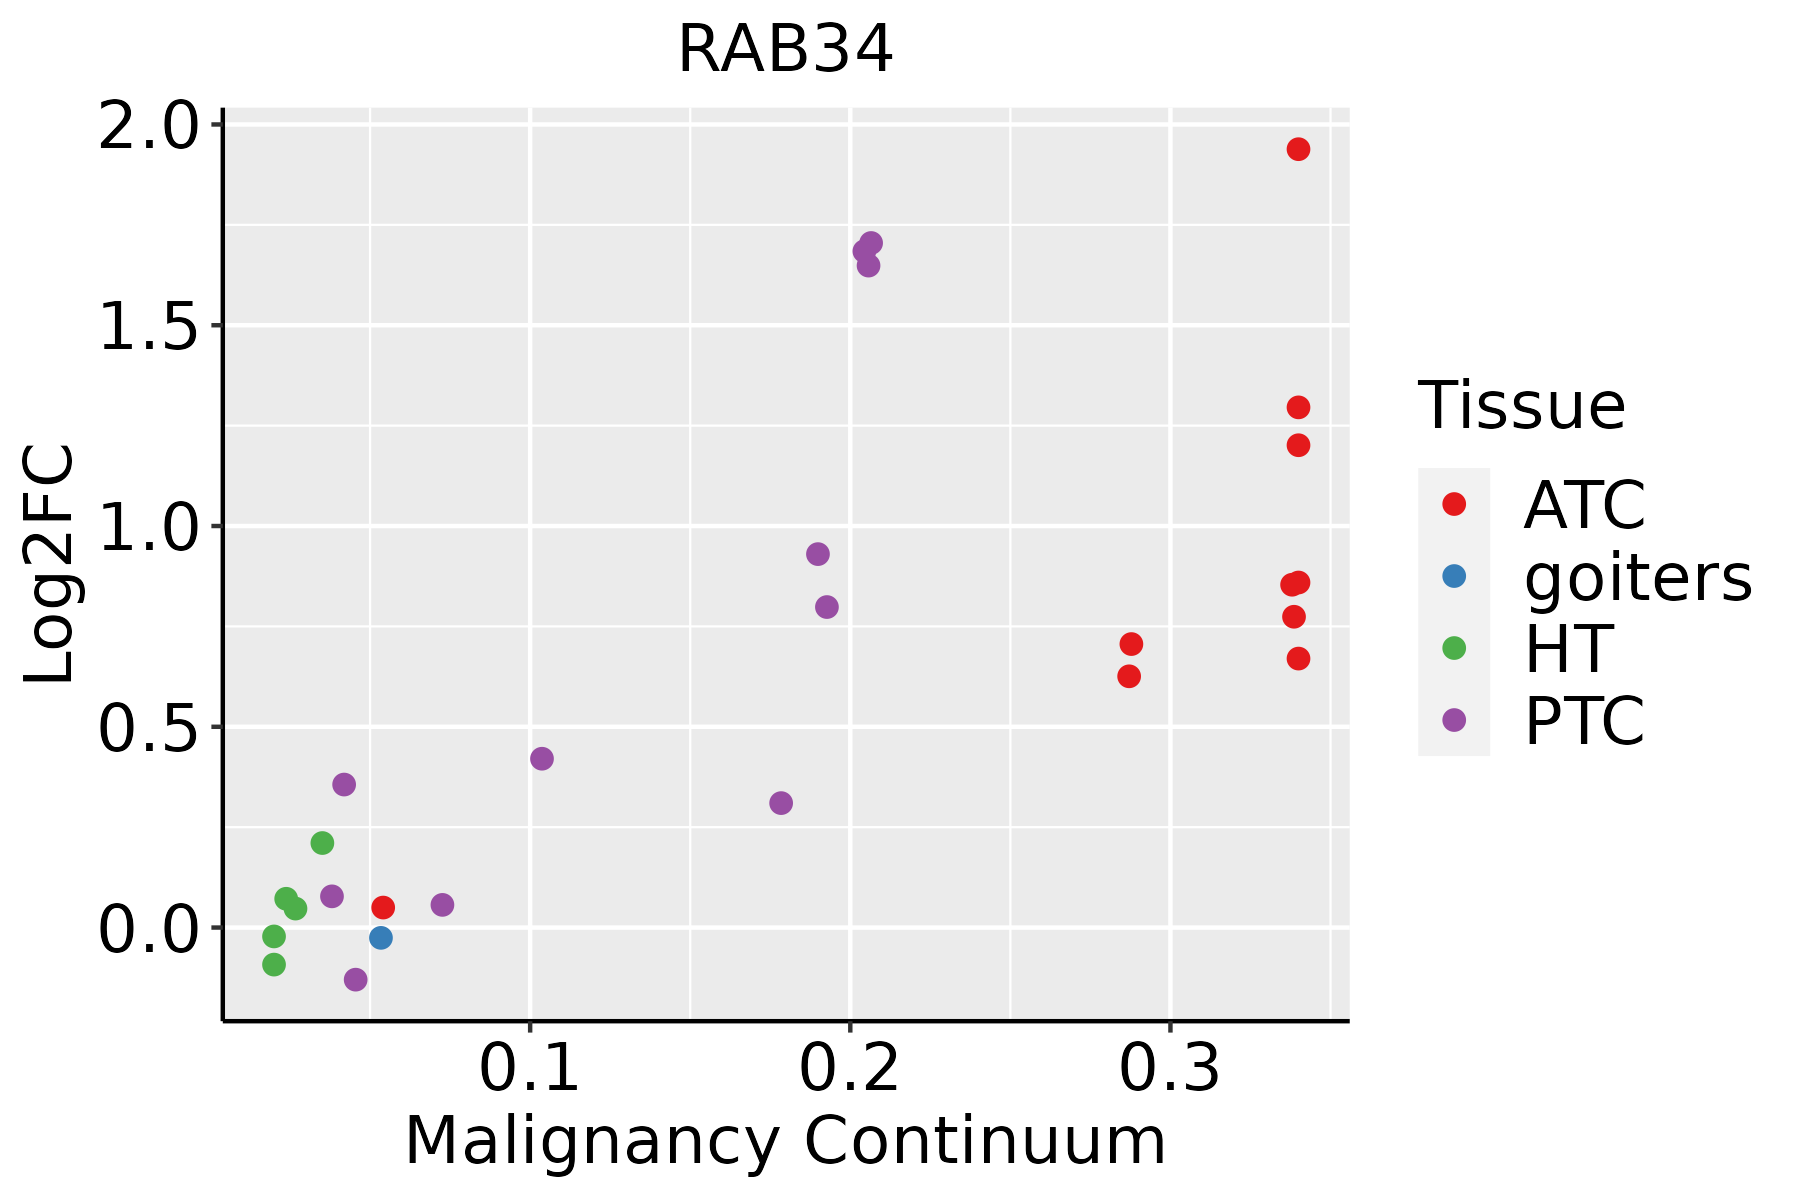 | ATC: Anaplastic thyroid cancer |
| HT: Hashimoto's thyroiditis | ||
| PTC: Papillary thyroid cancer |
| ∗log2FC in expression of this searched gene in stem-like cells from each diseased tissue sample relative to stem-like cells in normal samples in each tissue plotted against the malignancy continuum. Samples are colored based on if they are from different disease stage. |
Top |
Malignant transformation related pathway analysis |
| Find out the enriched GO biological processes and KEGG pathways involved in transition from healthy to precancer to cancer |
| Tissue | Disease Stage | Enriched GO biological Processes |
| Colorectum | AD |  |
| Colorectum | SER |  |
| Colorectum | MSS |  |
| Colorectum | MSI-H |  |
| Colorectum | FAP |  |
| ∗Top 15 enriched GO BP terms are showed in the bar plot of each disease state in each tissue. Each row represents a significant GO biological process which is colored according to the -log10(p.adjust). |
| Page: 1 2 3 4 5 6 7 8 9 |
| GO ID | Tissue | Disease Stage | Description | Gene Ratio | Bg Ratio | pvalue | p.adjust | Count |
| GO:007265914 | Endometrium | AEH | protein localization to plasma membrane | 63/2100 | 284/18723 | 7.58e-08 | 3.92e-06 | 63 |
| GO:19907789 | Endometrium | AEH | protein localization to cell periphery | 68/2100 | 333/18723 | 6.38e-07 | 2.38e-05 | 68 |
| GO:00481939 | Endometrium | AEH | Golgi vesicle transport | 60/2100 | 296/18723 | 3.65e-06 | 9.79e-05 | 60 |
| GO:009015010 | Endometrium | AEH | establishment of protein localization to membrane | 51/2100 | 260/18723 | 4.74e-05 | 7.85e-04 | 51 |
| GO:001988216 | Endometrium | AEH | antigen processing and presentation | 23/2100 | 106/18723 | 1.36e-03 | 1.15e-02 | 23 |
| GO:007265915 | Endometrium | EEC | protein localization to plasma membrane | 64/2168 | 284/18723 | 1.05e-07 | 5.05e-06 | 64 |
| GO:199077814 | Endometrium | EEC | protein localization to cell periphery | 69/2168 | 333/18723 | 9.71e-07 | 3.31e-05 | 69 |
| GO:004819313 | Endometrium | EEC | Golgi vesicle transport | 60/2168 | 296/18723 | 9.91e-06 | 2.17e-04 | 60 |
| GO:009015015 | Endometrium | EEC | establishment of protein localization to membrane | 52/2168 | 260/18723 | 5.46e-05 | 8.64e-04 | 52 |
| GO:001988217 | Endometrium | EEC | antigen processing and presentation | 25/2168 | 106/18723 | 3.71e-04 | 3.97e-03 | 25 |
| GO:004819317 | Esophagus | HGIN | Golgi vesicle transport | 83/2587 | 296/18723 | 8.59e-11 | 8.89e-09 | 83 |
| GO:009015020 | Esophagus | HGIN | establishment of protein localization to membrane | 67/2587 | 260/18723 | 1.96e-07 | 9.57e-06 | 67 |
| GO:007265920 | Esophagus | HGIN | protein localization to plasma membrane | 66/2587 | 284/18723 | 1.11e-05 | 3.18e-04 | 66 |
| GO:009887610 | Esophagus | HGIN | vesicle-mediated transport to the plasma membrane | 36/2587 | 136/18723 | 6.76e-05 | 1.55e-03 | 36 |
| GO:00070336 | Esophagus | HGIN | vacuole organization | 44/2587 | 180/18723 | 8.97e-05 | 1.96e-03 | 44 |
| GO:199077818 | Esophagus | HGIN | protein localization to cell periphery | 71/2587 | 333/18723 | 1.05e-04 | 2.24e-03 | 71 |
| GO:00160509 | Esophagus | HGIN | vesicle organization | 65/2587 | 300/18723 | 1.24e-04 | 2.54e-03 | 65 |
| GO:000689210 | Esophagus | HGIN | post-Golgi vesicle-mediated transport | 26/2587 | 104/18723 | 1.63e-03 | 1.81e-02 | 26 |
| GO:00430019 | Esophagus | HGIN | Golgi to plasma membrane protein transport | 13/2587 | 40/18723 | 2.04e-03 | 2.13e-02 | 13 |
| GO:00068939 | Esophagus | HGIN | Golgi to plasma membrane transport | 17/2587 | 60/18723 | 2.46e-03 | 2.45e-02 | 17 |
| Page: 1 2 3 4 5 6 7 8 9 |
| Pathway ID | Tissue | Disease Stage | Description | Gene Ratio | Bg Ratio | pvalue | p.adjust | qvalue | Count |
| Page: 1 |
Top |
Cell-cell communication analysis |
| Identification of potential cell-cell interactions between two cell types and their ligand-receptor pairs for different disease states |
| Ligand | Receptor | LRpair | Pathway | Tissue | Disease Stage |
| Page: 1 |
Top |
Single-cell gene regulatory network inference analysis |
| Find out the significant the regulons (TFs) and the target genes of each regulon across cell types for different disease states |
| TF | Cell Type | Tissue | Disease Stage | Target Gene | RSS | Regulon Activity |
| ∗The dot plots of a searched regulon are shown for all cell subpopulations in each disease state of each tissue based on the regulon specific score inferred using pySCENIC and by calculating the average expression. |
| Page: 1 |
Top |
Somatic mutation of malignant transformation related genes |
| Annotation of somatic variants for genes involved in malignant transformation |
| Hugo Symbol | Variant Class | Variant Classification | dbSNP RS | HGVSc | HGVSp | HGVSp Short | SWISSPROT | BIOTYPE | SIFT | PolyPhen | Tumor Sample Barcode | Tissue | Histology | Sex | Age | Stage | Therapy Types | Drugs | Outcome |
| RAB34 | SNV | Missense_Mutation | c.358T>C | p.Ser120Pro | p.S120P | protein_coding | deleterious(0.04) | probably_damaging(0.958) | TCGA-EW-A1IZ-01 | Breast | breast invasive carcinoma | Female | <65 | III/IV | Chemotherapy | taxotere | SD | ||
| RAB34 | insertion | Frame_Shift_Ins | novel | c.674_675insCTTGGATTCAGGAGTTCGAGACC | p.Lys225AsnfsTer12 | p.K225Nfs*12 | protein_coding | TCGA-BH-A0HK-01 | Breast | breast invasive carcinoma | Female | >=65 | I/II | Hormone Therapy | arimidex | SD | |||
| RAB34 | SNV | Missense_Mutation | rs757773764 | c.359N>T | p.Ser120Leu | p.S120L | protein_coding | deleterious(0.05) | possibly_damaging(0.878) | TCGA-C5-A7CH-01 | Cervix | cervical & endocervical cancer | Female | <65 | I/II | Unspecific | SD | ||
| RAB34 | SNV | Missense_Mutation | c.734N>A | p.Ala245Asp | p.A245D | protein_coding | deleterious(0) | possibly_damaging(0.84) | TCGA-A6-3809-01 | Colorectum | colon adenocarcinoma | Female | >=65 | I/II | Unknown | Unknown | SD | ||
| RAB34 | SNV | Missense_Mutation | c.400N>G | p.Thr134Ala | p.T134A | protein_coding | tolerated(0.16) | benign(0.005) | TCGA-AA-3679-01 | Colorectum | colon adenocarcinoma | Male | <65 | III/IV | Chemotherapy | folinic | SD | ||
| RAB34 | SNV | Missense_Mutation | novel | c.787C>A | p.Pro263Thr | p.P263T | protein_coding | deleterious_low_confidence(0) | benign(0.025) | TCGA-AA-3947-01 | Colorectum | colon adenocarcinoma | Female | <65 | I/II | Unknown | Unknown | SD | |
| RAB34 | SNV | Missense_Mutation | rs769328864 | c.722C>G | p.Ala241Gly | p.A241G | protein_coding | deleterious(0.01) | probably_damaging(0.991) | TCGA-AA-A010-01 | Colorectum | colon adenocarcinoma | Female | <65 | I/II | Chemotherapy | folinic | CR | |
| RAB34 | SNV | Missense_Mutation | c.479N>A | p.Ser160Asn | p.S160N | protein_coding | tolerated(0.23) | probably_damaging(0.921) | TCGA-AA-A01D-01 | Colorectum | colon adenocarcinoma | Female | <65 | III/IV | Chemotherapy | capecitabine | PD | ||
| RAB34 | SNV | Missense_Mutation | c.336G>T | p.Lys112Asn | p.K112N | protein_coding | deleterious(0.01) | probably_damaging(0.998) | TCGA-D5-6928-01 | Colorectum | colon adenocarcinoma | Male | >=65 | I/II | Unknown | Unknown | SD | ||
| RAB34 | SNV | Missense_Mutation | novel | c.524N>C | p.Ile175Thr | p.I175T | protein_coding | deleterious(0) | probably_damaging(0.998) | TCGA-AG-A01J-01 | Colorectum | rectum adenocarcinoma | Female | <65 | I/II | Unknown | Unknown | SD |
| Page: 1 2 3 |
Top |
Related drugs of malignant transformation related genes |
| Identification of chemicals and drugs interact with genes involved in malignant transfromation |
| (DGIdb 4.0) |
| Entrez ID | Symbol | Category | Interaction Types | Drug Claim Name | Drug Name | PMIDs |
| Page: 1 |

Copyright 2023-Present -The University of Texas Health Science Center at Houston |