
|
|||||
|
 | |
| |
| |
| |
| |
| |
|
Gene: RAB32 |
Gene summary for RAB32 |
| Gene information | Species | Human | Gene symbol | RAB32 | Gene ID | 10981 |
| Gene name | RAB32, member RAS oncogene family | |
| Gene Alias | RAB32 | |
| Cytomap | 6q24.3 | |
| Gene Type | protein-coding | GO ID | GO:0002376 | UniProtAcc | Q13637 |
Top |
Malignant transformation analysis |
| Identification of the aberrant gene expression in precancerous and cancerous lesions by comparing the gene expression of stem-like cells in diseased tissues with normal stem cells |
| Entrez ID | Symbol | Replicates | Species | Organ | Tissue | Adj P-value | Log2FC | Malignancy |
| 10981 | RAB32 | CA_HPV_1 | Human | Cervix | CC | 1.98e-07 | -2.67e-01 | 0.0264 |
| 10981 | RAB32 | CCI_1 | Human | Cervix | CC | 1.38e-04 | -5.48e-01 | 0.528 |
| 10981 | RAB32 | CCI_3 | Human | Cervix | CC | 1.19e-06 | -5.48e-01 | 0.516 |
| 10981 | RAB32 | CCII_1 | Human | Cervix | CC | 2.16e-07 | -5.37e-01 | 0.3249 |
| 10981 | RAB32 | Tumor | Human | Cervix | CC | 4.72e-04 | -2.09e-01 | 0.1241 |
| 10981 | RAB32 | sample3 | Human | Cervix | CC | 3.32e-09 | -1.75e-01 | 0.1387 |
| 10981 | RAB32 | H2 | Human | Cervix | HSIL_HPV | 7.85e-19 | -4.88e-01 | 0.0632 |
| 10981 | RAB32 | L1 | Human | Cervix | CC | 2.41e-03 | -4.20e-01 | 0.0802 |
| 10981 | RAB32 | T3 | Human | Cervix | CC | 4.32e-06 | -1.85e-01 | 0.1389 |
| 10981 | RAB32 | LZE22T | Human | Esophagus | ESCC | 3.20e-05 | 5.85e-01 | 0.068 |
| 10981 | RAB32 | LZE24T | Human | Esophagus | ESCC | 9.06e-03 | -3.95e-02 | 0.0596 |
| 10981 | RAB32 | P1T-E | Human | Esophagus | ESCC | 8.05e-07 | 4.39e-01 | 0.0875 |
| 10981 | RAB32 | P2T-E | Human | Esophagus | ESCC | 1.91e-11 | 2.69e-01 | 0.1177 |
| 10981 | RAB32 | P4T-E | Human | Esophagus | ESCC | 5.30e-16 | 3.39e-01 | 0.1323 |
| 10981 | RAB32 | P5T-E | Human | Esophagus | ESCC | 9.14e-50 | 1.04e+00 | 0.1327 |
| 10981 | RAB32 | P8T-E | Human | Esophagus | ESCC | 3.23e-39 | 9.96e-01 | 0.0889 |
| 10981 | RAB32 | P9T-E | Human | Esophagus | ESCC | 3.32e-30 | 8.16e-01 | 0.1131 |
| 10981 | RAB32 | P10T-E | Human | Esophagus | ESCC | 1.08e-15 | 3.79e-01 | 0.116 |
| 10981 | RAB32 | P11T-E | Human | Esophagus | ESCC | 1.84e-26 | 1.21e+00 | 0.1426 |
| 10981 | RAB32 | P12T-E | Human | Esophagus | ESCC | 8.95e-07 | 2.49e-01 | 0.1122 |
| Page: 1 2 3 4 5 6 |
| Tissue | Expression Dynamics | Abbreviation |
| Cervix | 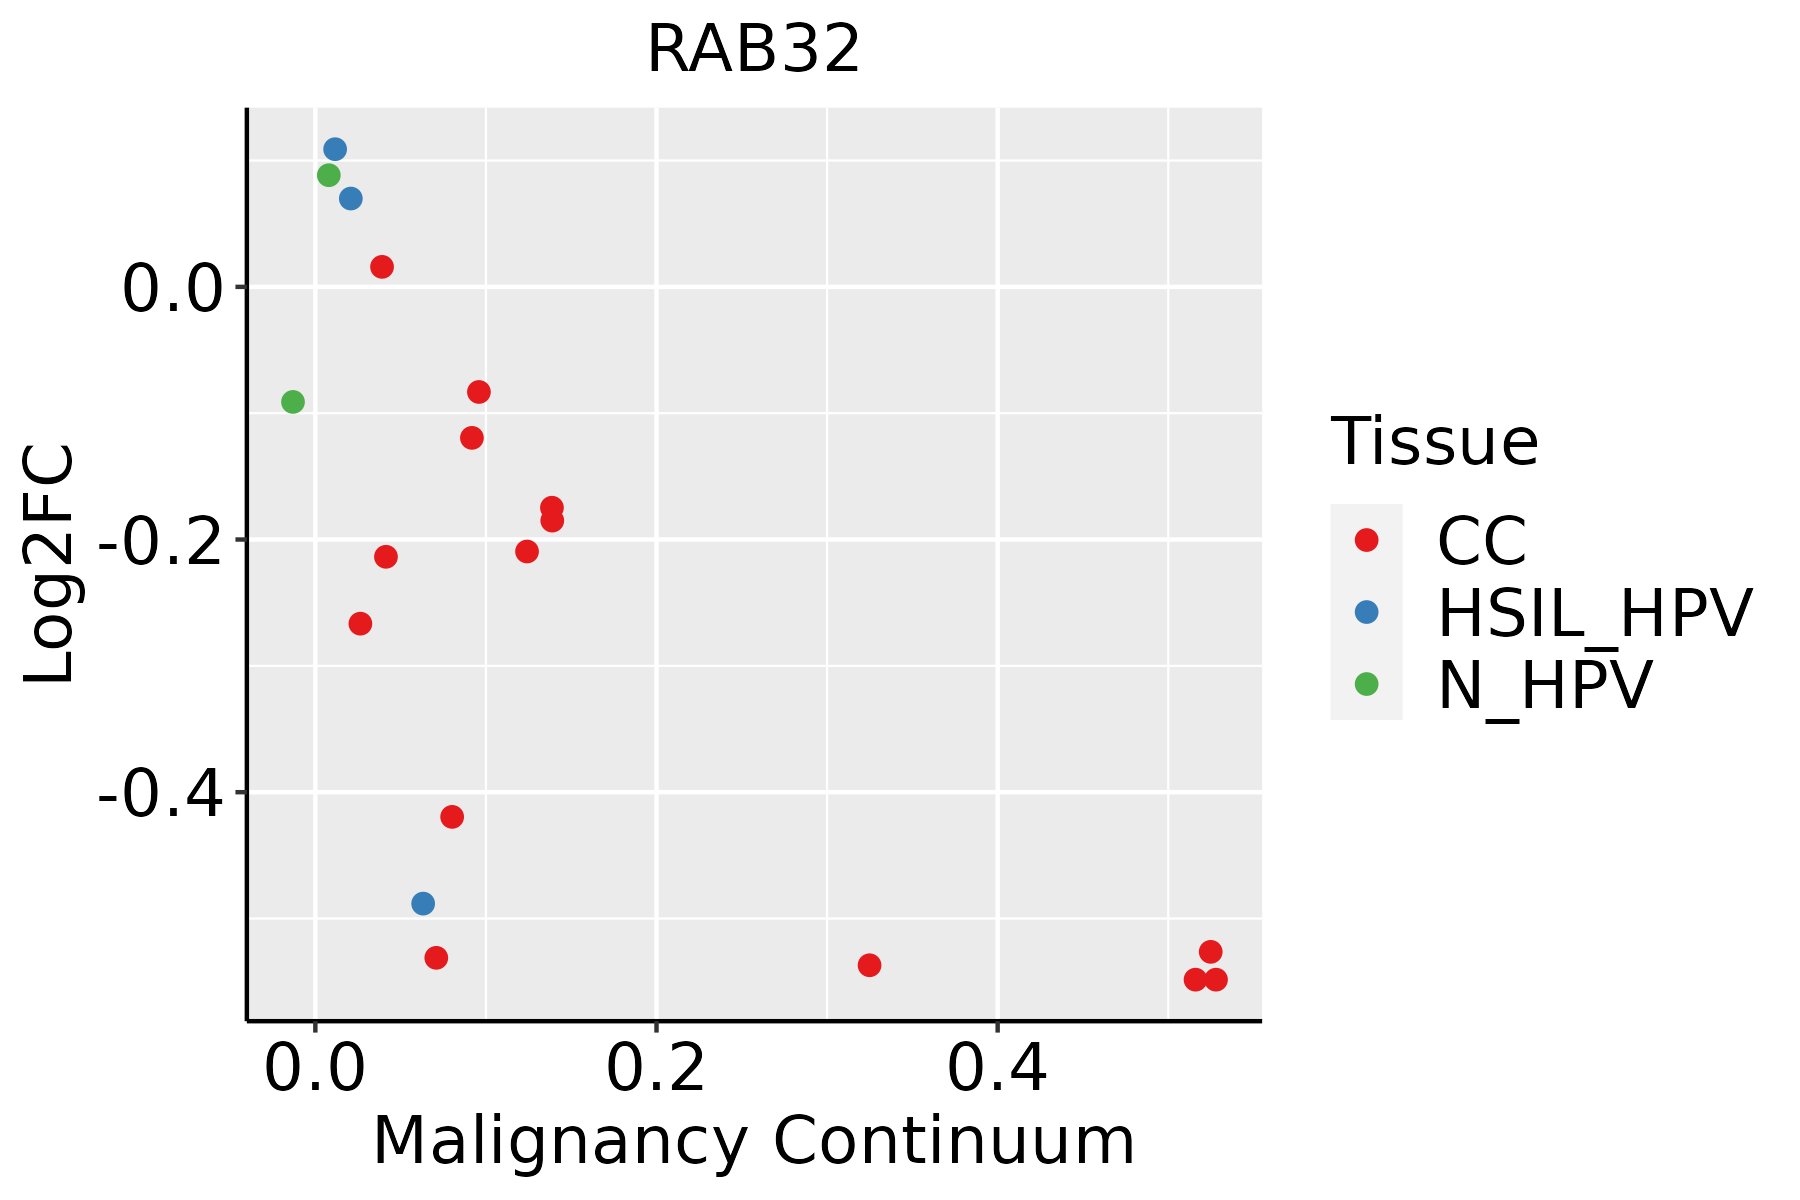 | CC: Cervix cancer |
| HSIL_HPV: HPV-infected high-grade squamous intraepithelial lesions | ||
| N_HPV: HPV-infected normal cervix | ||
| Esophagus | 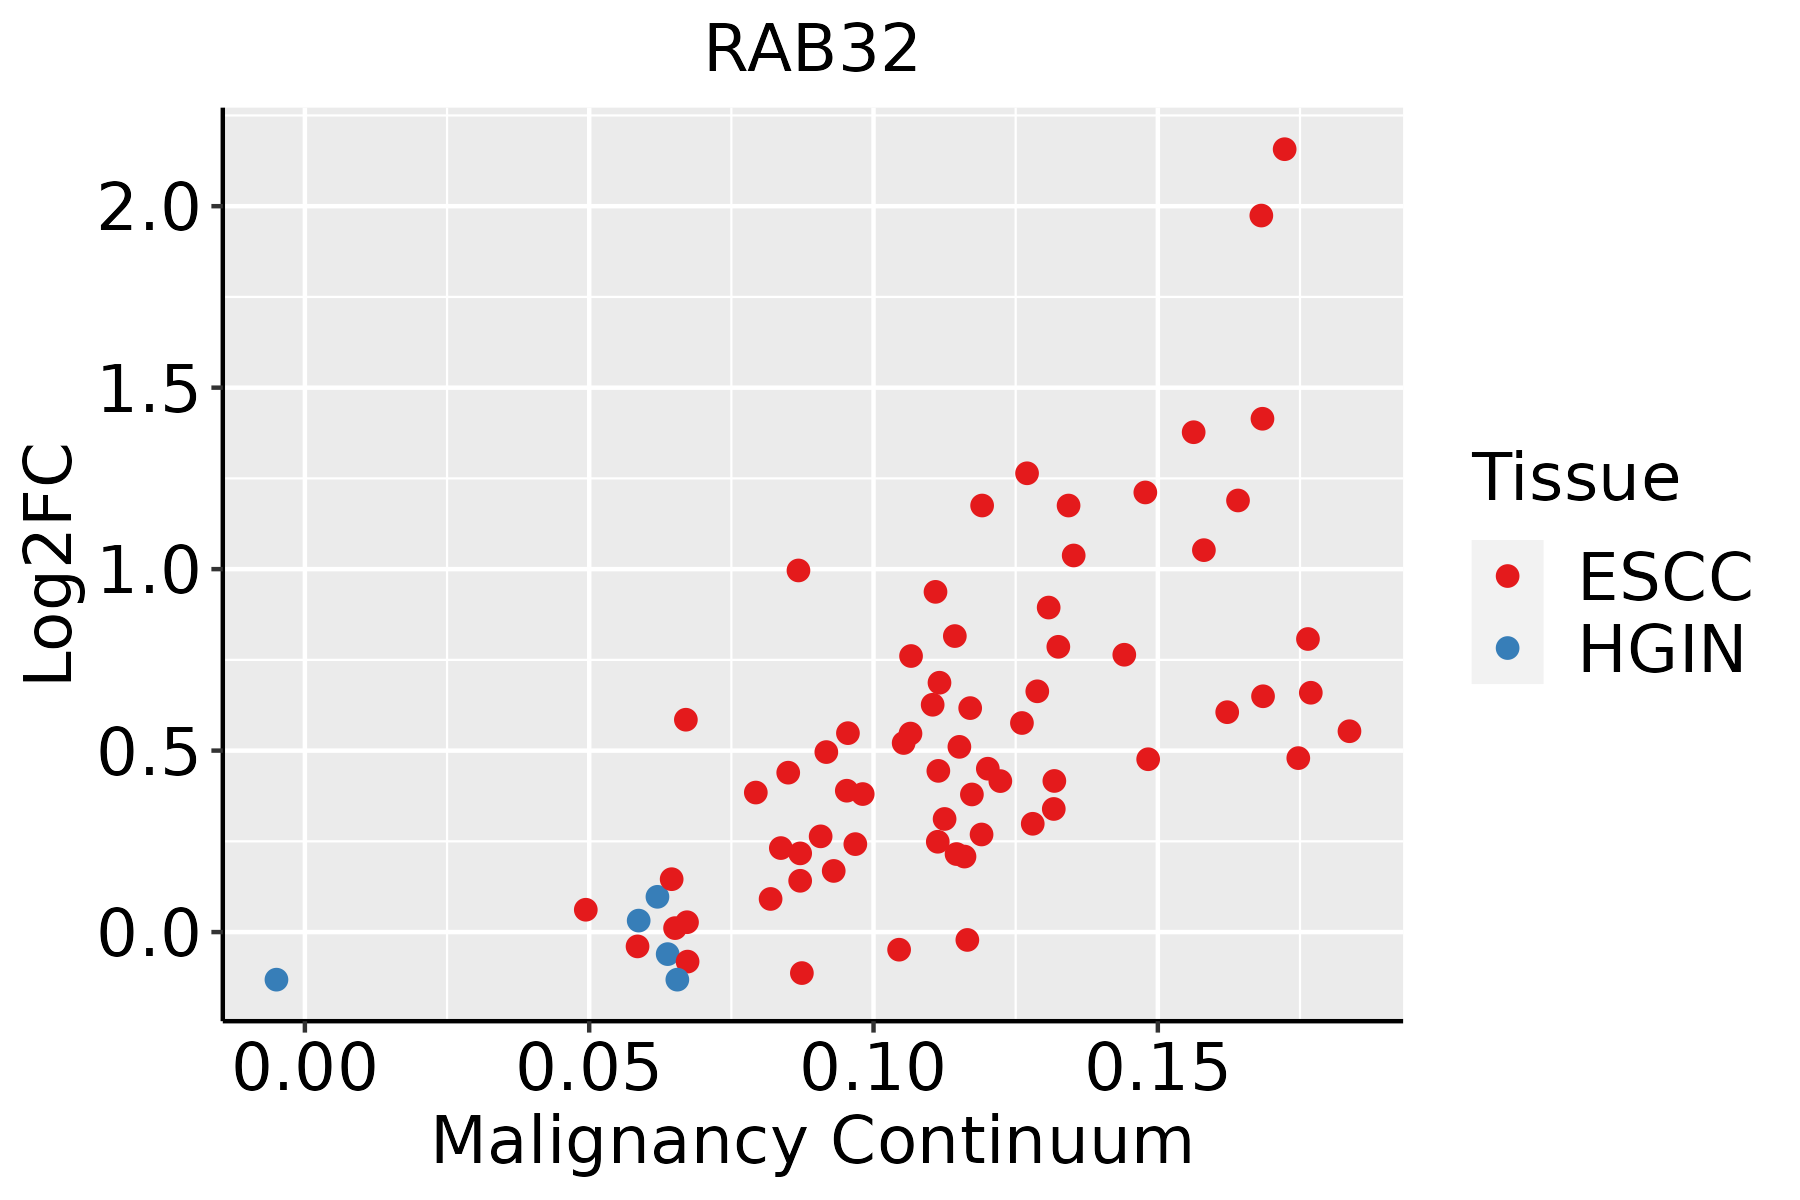 | ESCC: Esophageal squamous cell carcinoma |
| HGIN: High-grade intraepithelial neoplasias | ||
| LGIN: Low-grade intraepithelial neoplasias | ||
| Liver |  | HCC: Hepatocellular carcinoma |
| NAFLD: Non-alcoholic fatty liver disease | ||
| Oral Cavity |  | EOLP: Erosive Oral lichen planus |
| LP: leukoplakia | ||
| NEOLP: Non-erosive oral lichen planus | ||
| OSCC: Oral squamous cell carcinoma | ||
| Skin | 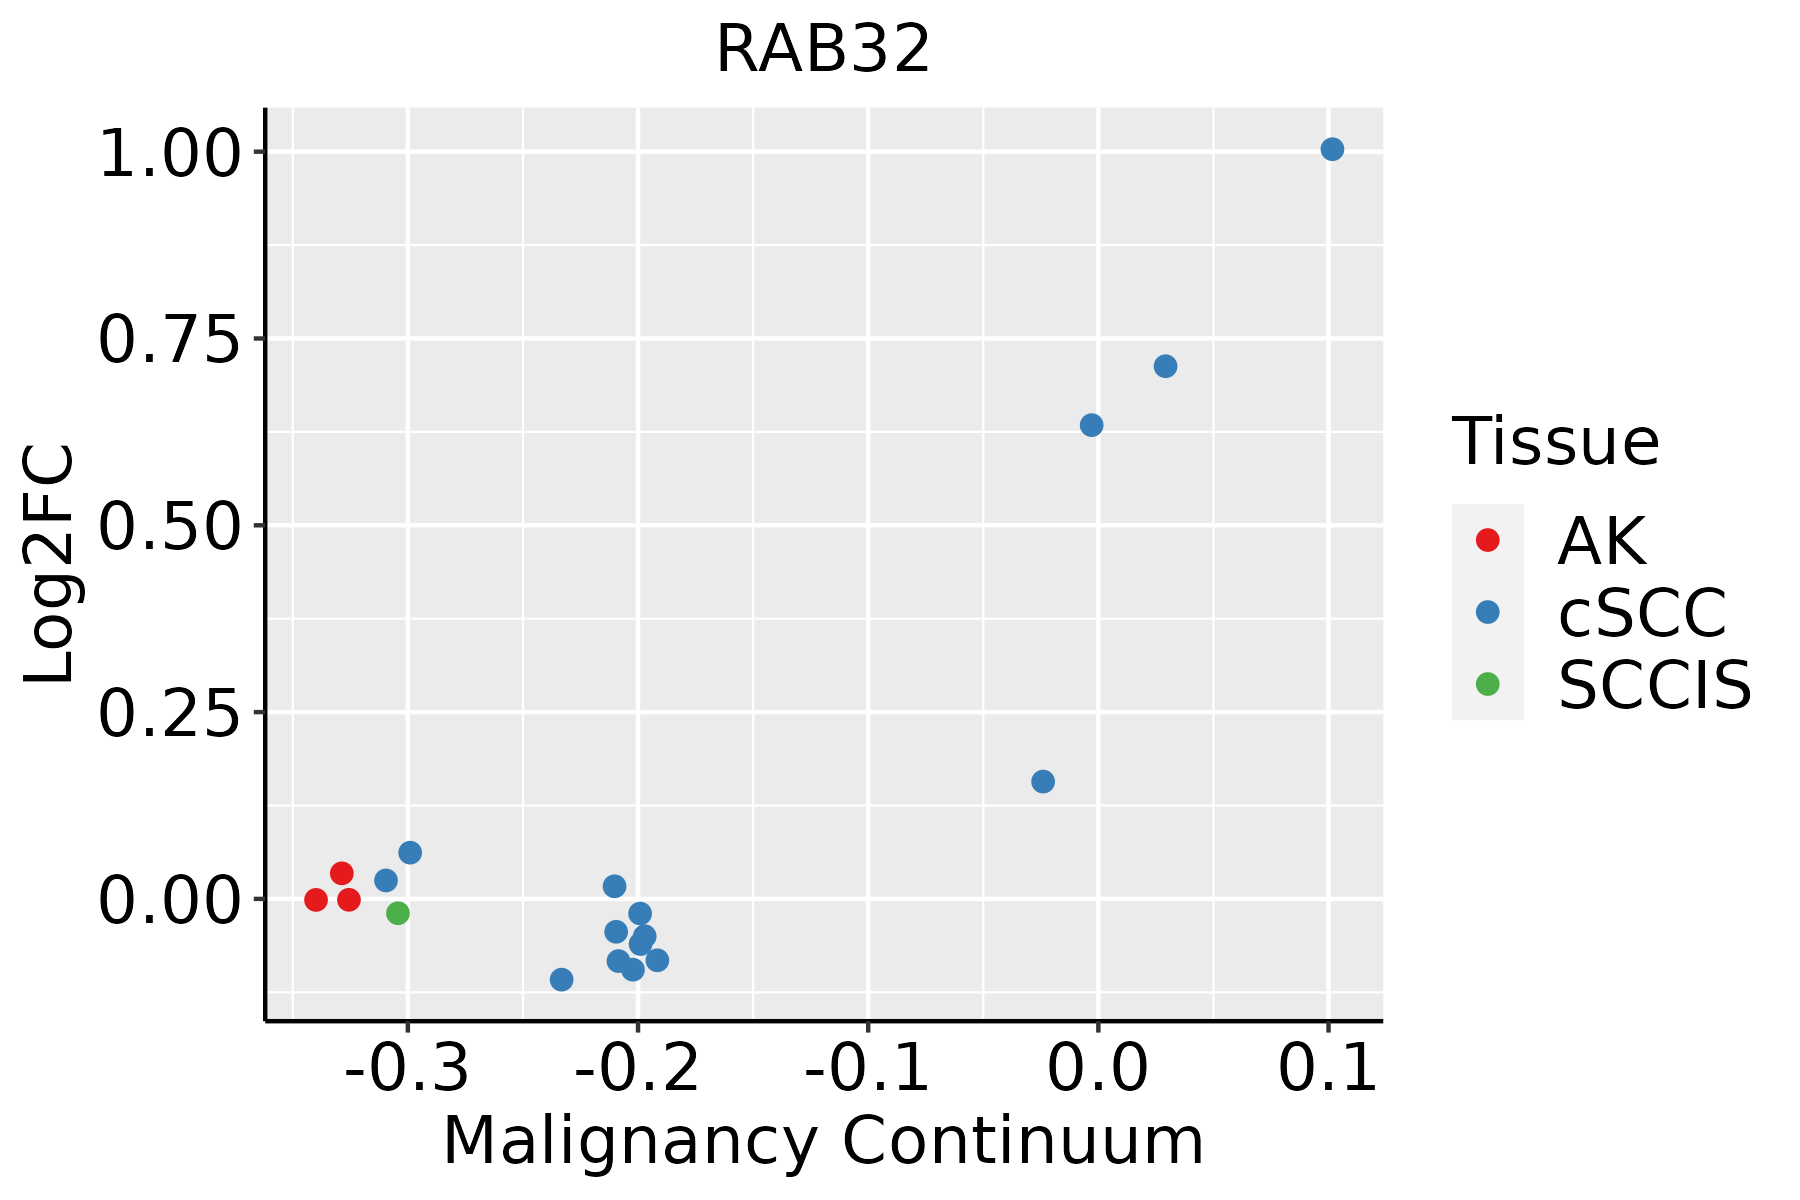 | AK: Actinic keratosis |
| cSCC: Cutaneous squamous cell carcinoma | ||
| SCCIS:squamous cell carcinoma in situ | ||
| Thyroid |  | ATC: Anaplastic thyroid cancer |
| HT: Hashimoto's thyroiditis | ||
| PTC: Papillary thyroid cancer |
| ∗log2FC in expression of this searched gene in stem-like cells from each diseased tissue sample relative to stem-like cells in normal samples in each tissue plotted against the malignancy continuum. Samples are colored based on if they are from different disease stage. |
Top |
Malignant transformation related pathway analysis |
| Find out the enriched GO biological processes and KEGG pathways involved in transition from healthy to precancer to cancer |
| Tissue | Disease Stage | Enriched GO biological Processes |
| Colorectum | AD |  |
| Colorectum | SER |  |
| Colorectum | MSS |  |
| Colorectum | MSI-H |  |
| Colorectum | FAP |  |
| ∗Top 15 enriched GO BP terms are showed in the bar plot of each disease state in each tissue. Each row represents a significant GO biological process which is colored according to the -log10(p.adjust). |
| Page: 1 2 3 4 5 6 7 8 9 |
| GO ID | Tissue | Disease Stage | Description | Gene Ratio | Bg Ratio | pvalue | p.adjust | Count |
| GO:001988210 | Cervix | CC | antigen processing and presentation | 32/2311 | 106/18723 | 8.61e-07 | 3.08e-05 | 32 |
| GO:00160506 | Cervix | CC | vesicle organization | 54/2311 | 300/18723 | 2.71e-03 | 1.85e-02 | 54 |
| GO:001988215 | Cervix | HSIL_HPV | antigen processing and presentation | 17/737 | 106/18723 | 8.01e-07 | 3.94e-05 | 17 |
| GO:001605014 | Esophagus | ESCC | vesicle organization | 211/8552 | 300/18723 | 2.85e-18 | 2.87e-16 | 211 |
| GO:00330593 | Esophagus | ESCC | cellular pigmentation | 40/8552 | 53/18723 | 9.67e-06 | 9.21e-05 | 40 |
| GO:001988225 | Esophagus | ESCC | antigen processing and presentation | 67/8552 | 106/18723 | 2.03e-04 | 1.28e-03 | 67 |
| GO:00487531 | Esophagus | ESCC | pigment granule organization | 23/8552 | 29/18723 | 2.25e-04 | 1.40e-03 | 23 |
| GO:00324381 | Esophagus | ESCC | melanosome organization | 22/8552 | 28/18723 | 3.95e-04 | 2.26e-03 | 22 |
| GO:0090382 | Esophagus | ESCC | phagosome maturation | 19/8552 | 25/18723 | 2.03e-03 | 9.08e-03 | 19 |
| GO:00434731 | Esophagus | ESCC | pigmentation | 59/8552 | 98/18723 | 2.64e-03 | 1.12e-02 | 59 |
| GO:0035646 | Esophagus | ESCC | endosome to melanosome transport | 9/8552 | 10/18723 | 5.09e-03 | 1.92e-02 | 9 |
| GO:0043485 | Esophagus | ESCC | endosome to pigment granule transport | 9/8552 | 10/18723 | 5.09e-03 | 1.92e-02 | 9 |
| GO:0048757 | Esophagus | ESCC | pigment granule maturation | 9/8552 | 10/18723 | 5.09e-03 | 1.92e-02 | 9 |
| GO:0043476 | Esophagus | ESCC | pigment accumulation | 10/8552 | 12/18723 | 8.94e-03 | 3.12e-02 | 10 |
| GO:0043482 | Esophagus | ESCC | cellular pigment accumulation | 10/8552 | 12/18723 | 8.94e-03 | 3.12e-02 | 10 |
| GO:001605011 | Liver | Cirrhotic | vesicle organization | 133/4634 | 300/18723 | 7.35e-14 | 6.41e-12 | 133 |
| GO:00198827 | Liver | Cirrhotic | antigen processing and presentation | 44/4634 | 106/18723 | 1.07e-04 | 1.10e-03 | 44 |
| GO:001605021 | Liver | HCC | vesicle organization | 194/7958 | 300/18723 | 5.58e-15 | 3.97e-13 | 194 |
| GO:001988212 | Liver | HCC | antigen processing and presentation | 65/7958 | 106/18723 | 7.06e-05 | 6.37e-04 | 65 |
| GO:00160508 | Oral cavity | OSCC | vesicle organization | 189/7305 | 300/18723 | 2.40e-17 | 2.14e-15 | 189 |
| Page: 1 2 3 |
| Pathway ID | Tissue | Disease Stage | Description | Gene Ratio | Bg Ratio | pvalue | p.adjust | qvalue | Count |
| Page: 1 |
Top |
Cell-cell communication analysis |
| Identification of potential cell-cell interactions between two cell types and their ligand-receptor pairs for different disease states |
| Ligand | Receptor | LRpair | Pathway | Tissue | Disease Stage |
| Page: 1 |
Top |
Single-cell gene regulatory network inference analysis |
| Find out the significant the regulons (TFs) and the target genes of each regulon across cell types for different disease states |
| TF | Cell Type | Tissue | Disease Stage | Target Gene | RSS | Regulon Activity |
| ∗The dot plots of a searched regulon are shown for all cell subpopulations in each disease state of each tissue based on the regulon specific score inferred using pySCENIC and by calculating the average expression. |
| Page: 1 |
Top |
Somatic mutation of malignant transformation related genes |
| Annotation of somatic variants for genes involved in malignant transformation |
| Hugo Symbol | Variant Class | Variant Classification | dbSNP RS | HGVSc | HGVSp | HGVSp Short | SWISSPROT | BIOTYPE | SIFT | PolyPhen | Tumor Sample Barcode | Tissue | Histology | Sex | Age | Stage | Therapy Types | Drugs | Outcome |
| RAB32 | SNV | Missense_Mutation | c.653N>T | p.Ala218Val | p.A218V | Q13637 | protein_coding | tolerated(0.1) | benign(0.003) | TCGA-AD-A5EJ-01 | Colorectum | colon adenocarcinoma | Female | >=65 | I/II | Unknown | Unknown | SD | |
| RAB32 | SNV | Missense_Mutation | novel | c.577N>A | p.Leu193Ile | p.L193I | Q13637 | protein_coding | tolerated(0.12) | benign(0.291) | TCGA-AG-A002-01 | Colorectum | rectum adenocarcinoma | Male | <65 | I/II | Unknown | Unknown | SD |
| RAB32 | SNV | Missense_Mutation | novel | c.528N>T | p.Lys176Asn | p.K176N | Q13637 | protein_coding | deleterious(0) | probably_damaging(0.997) | TCGA-AP-A1DK-01 | Endometrium | uterine corpus endometrioid carcinoma | Female | <65 | I/II | Unknown | Unknown | SD |
| RAB32 | SNV | Missense_Mutation | rs751404303 | c.613G>A | p.Asp205Asn | p.D205N | Q13637 | protein_coding | tolerated(0.07) | benign(0.049) | TCGA-AP-A1DV-01 | Endometrium | uterine corpus endometrioid carcinoma | Female | <65 | I/II | Unknown | Unknown | SD |
| RAB32 | SNV | Missense_Mutation | novel | c.247G>T | p.Ala83Ser | p.A83S | Q13637 | protein_coding | deleterious(0.02) | possibly_damaging(0.836) | TCGA-B5-A1MX-01 | Endometrium | uterine corpus endometrioid carcinoma | Female | <65 | I/II | Hormone Therapy | megace | SD |
| RAB32 | SNV | Missense_Mutation | rs751404303 | c.613N>A | p.Asp205Asn | p.D205N | Q13637 | protein_coding | tolerated(0.07) | benign(0.049) | TCGA-QF-A5YS-01 | Endometrium | uterine corpus endometrioid carcinoma | Female | <65 | I/II | Chemotherapy | carboplatin | CR |
| RAB32 | deletion | Frame_Shift_Del | novel | c.82delG | p.Val28CysfsTer3 | p.V28Cfs*3 | Q13637 | protein_coding | TCGA-B5-A1MX-01 | Endometrium | uterine corpus endometrioid carcinoma | Female | <65 | I/II | Hormone Therapy | megace | SD | ||
| RAB32 | insertion | Frame_Shift_Ins | novel | c.78_79insA | p.Val28GlyfsTer80 | p.V28Gfs*80 | Q13637 | protein_coding | TCGA-BG-A221-01 | Endometrium | uterine corpus endometrioid carcinoma | Female | >=65 | I/II | Unknown | Unknown | SD | ||
| RAB32 | SNV | Missense_Mutation | c.543A>G | p.Ile181Met | p.I181M | Q13637 | protein_coding | deleterious(0) | probably_damaging(0.973) | TCGA-DD-A3A1-01 | Liver | liver hepatocellular carcinoma | Male | >=65 | III/IV | Unknown | Unknown | SD | |
| RAB32 | SNV | Missense_Mutation | novel | c.446N>G | p.Lys149Arg | p.K149R | Q13637 | protein_coding | tolerated(0.25) | benign(0.033) | TCGA-95-7567-01 | Lung | lung adenocarcinoma | Male | <65 | I/II | Chemotherapy | cisplatin | SD |
| Page: 1 2 |
Top |
Related drugs of malignant transformation related genes |
| Identification of chemicals and drugs interact with genes involved in malignant transfromation |
| (DGIdb 4.0) |
| Entrez ID | Symbol | Category | Interaction Types | Drug Claim Name | Drug Name | PMIDs |
| Page: 1 |

Copyright 2023-Present -The University of Texas Health Science Center at Houston |