
|
|||||
|
 | |
| |
| |
| |
| |
| |
|
Gene: RAB31 |
Gene summary for RAB31 |
| Gene information | Species | Human | Gene symbol | RAB31 | Gene ID | 11031 |
| Gene name | RAB31, member RAS oncogene family | |
| Gene Alias | Rab22B | |
| Cytomap | 18p11.22 | |
| Gene Type | protein-coding | GO ID | GO:0006810 | UniProtAcc | Q13636 |
Top |
Malignant transformation analysis |
| Identification of the aberrant gene expression in precancerous and cancerous lesions by comparing the gene expression of stem-like cells in diseased tissues with normal stem cells |
| Entrez ID | Symbol | Replicates | Species | Organ | Tissue | Adj P-value | Log2FC | Malignancy |
| 11031 | RAB31 | GSM4909301 | Human | Breast | IDC | 2.56e-05 | 2.70e-01 | 0.1577 |
| 11031 | RAB31 | GSM4909302 | Human | Breast | IDC | 8.59e-16 | 4.89e-01 | 0.1545 |
| 11031 | RAB31 | GSM4909304 | Human | Breast | IDC | 6.62e-07 | 2.34e-01 | 0.1636 |
| 11031 | RAB31 | GSM4909305 | Human | Breast | IDC | 2.06e-04 | 3.05e-01 | 0.0436 |
| 11031 | RAB31 | GSM4909306 | Human | Breast | IDC | 4.65e-14 | 4.45e-01 | 0.1564 |
| 11031 | RAB31 | GSM4909307 | Human | Breast | IDC | 6.86e-07 | 3.12e-01 | 0.1569 |
| 11031 | RAB31 | GSM4909308 | Human | Breast | IDC | 3.50e-18 | 4.21e-01 | 0.158 |
| 11031 | RAB31 | GSM4909319 | Human | Breast | IDC | 2.32e-10 | 2.54e-01 | 0.1563 |
| 11031 | RAB31 | GSM4909320 | Human | Breast | IDC | 1.72e-30 | 1.18e+00 | 0.1575 |
| 11031 | RAB31 | NCCBC2 | Human | Breast | DCIS | 1.19e-04 | 5.93e-01 | 0.1554 |
| 11031 | RAB31 | P3 | Human | Breast | IDC | 8.26e-10 | 6.77e-01 | 0.1542 |
| 11031 | RAB31 | DCIS2 | Human | Breast | DCIS | 1.52e-06 | 3.43e-03 | 0.0085 |
| 11031 | RAB31 | LZE8T | Human | Esophagus | ESCC | 2.73e-06 | 1.19e-01 | 0.067 |
| 11031 | RAB31 | LZE24T | Human | Esophagus | ESCC | 2.68e-13 | 8.38e-01 | 0.0596 |
| 11031 | RAB31 | LZE21T | Human | Esophagus | ESCC | 1.06e-02 | 7.62e-02 | 0.0655 |
| 11031 | RAB31 | LZE6T | Human | Esophagus | ESCC | 3.01e-02 | 1.63e-01 | 0.0845 |
| 11031 | RAB31 | P2T-E | Human | Esophagus | ESCC | 3.43e-15 | 4.03e-01 | 0.1177 |
| 11031 | RAB31 | P4T-E | Human | Esophagus | ESCC | 1.23e-13 | 8.70e-01 | 0.1323 |
| 11031 | RAB31 | P5T-E | Human | Esophagus | ESCC | 6.14e-32 | 9.36e-01 | 0.1327 |
| 11031 | RAB31 | P8T-E | Human | Esophagus | ESCC | 2.95e-02 | 1.90e-01 | 0.0889 |
| Page: 1 2 3 4 5 6 |
| Tissue | Expression Dynamics | Abbreviation |
| Breast | 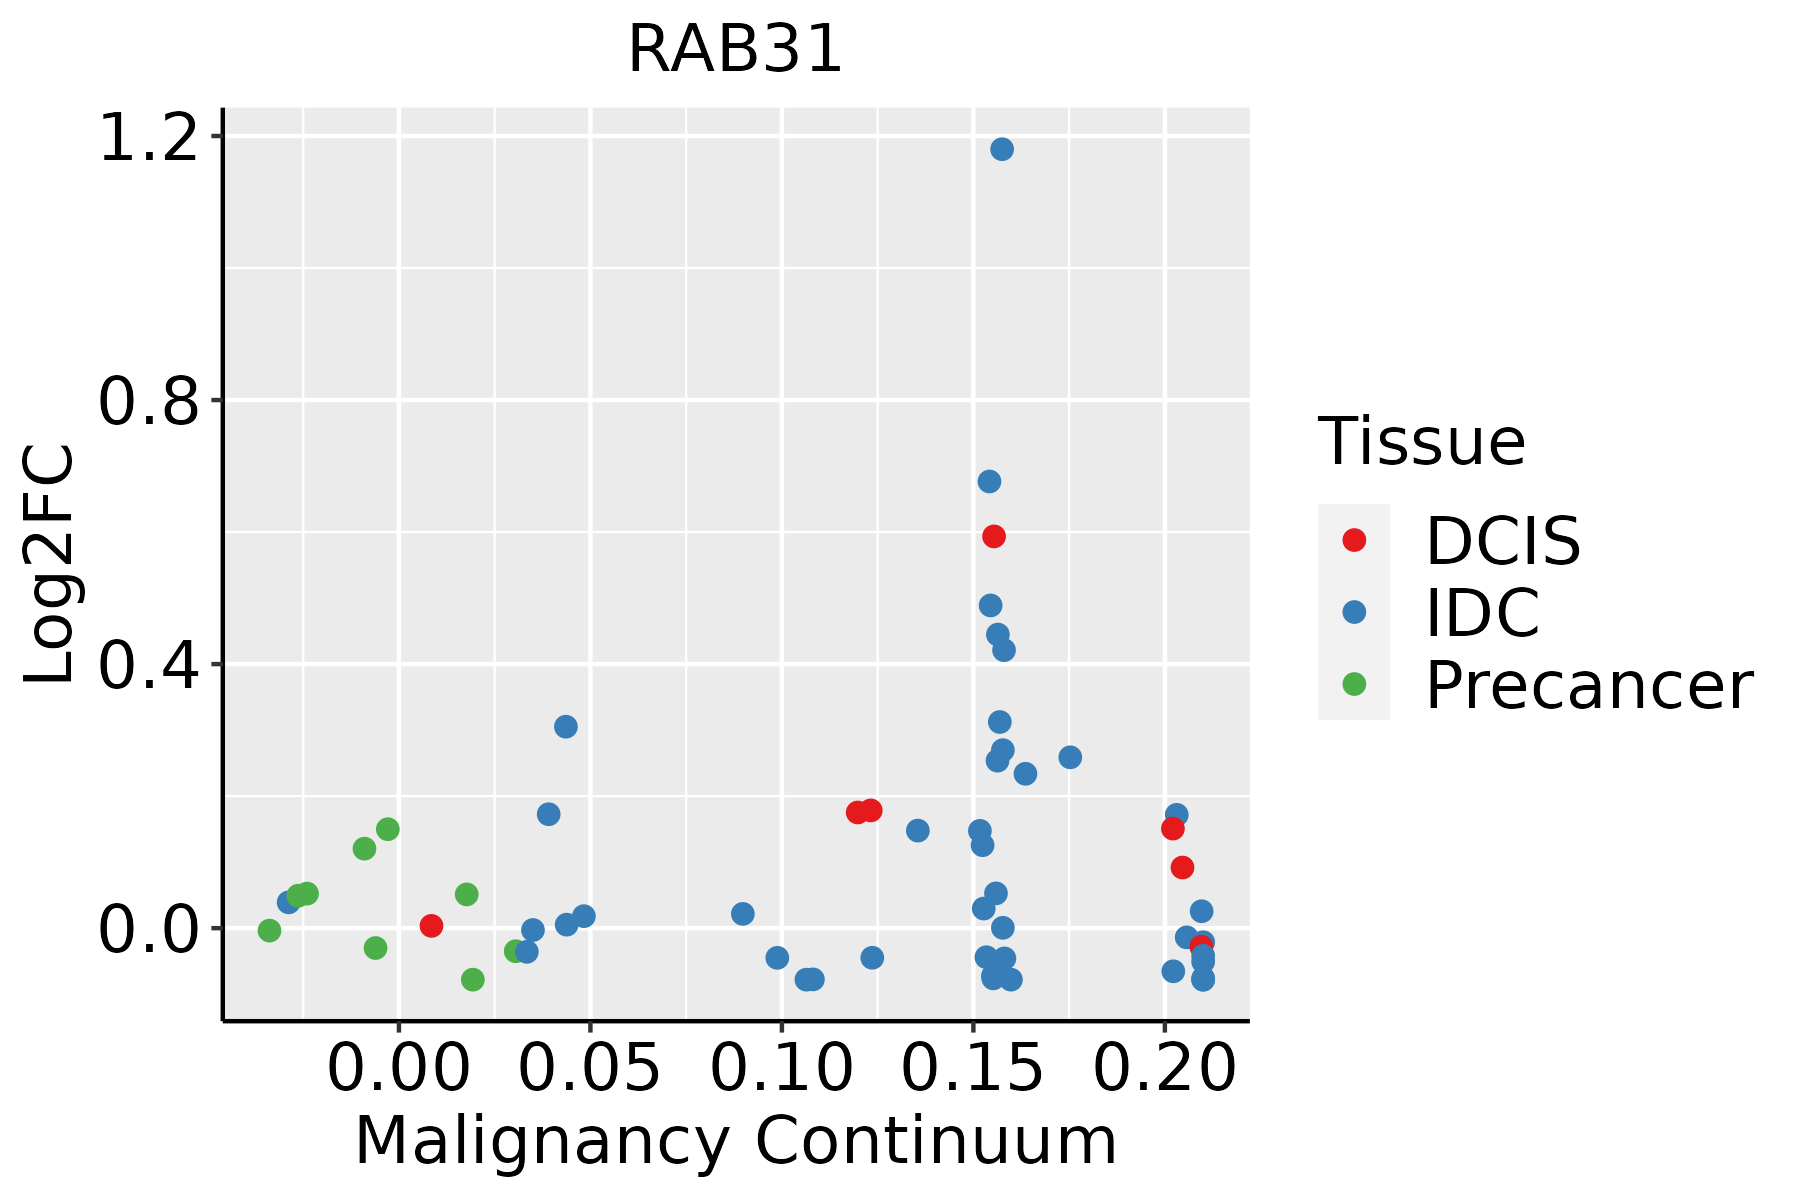 | IDC: Invasive ductal carcinoma |
| DCIS: Ductal carcinoma in situ | ||
| Precancer(BRCA1-mut): Precancerous lesion from BRCA1 mutation carriers | ||
| Esophagus | 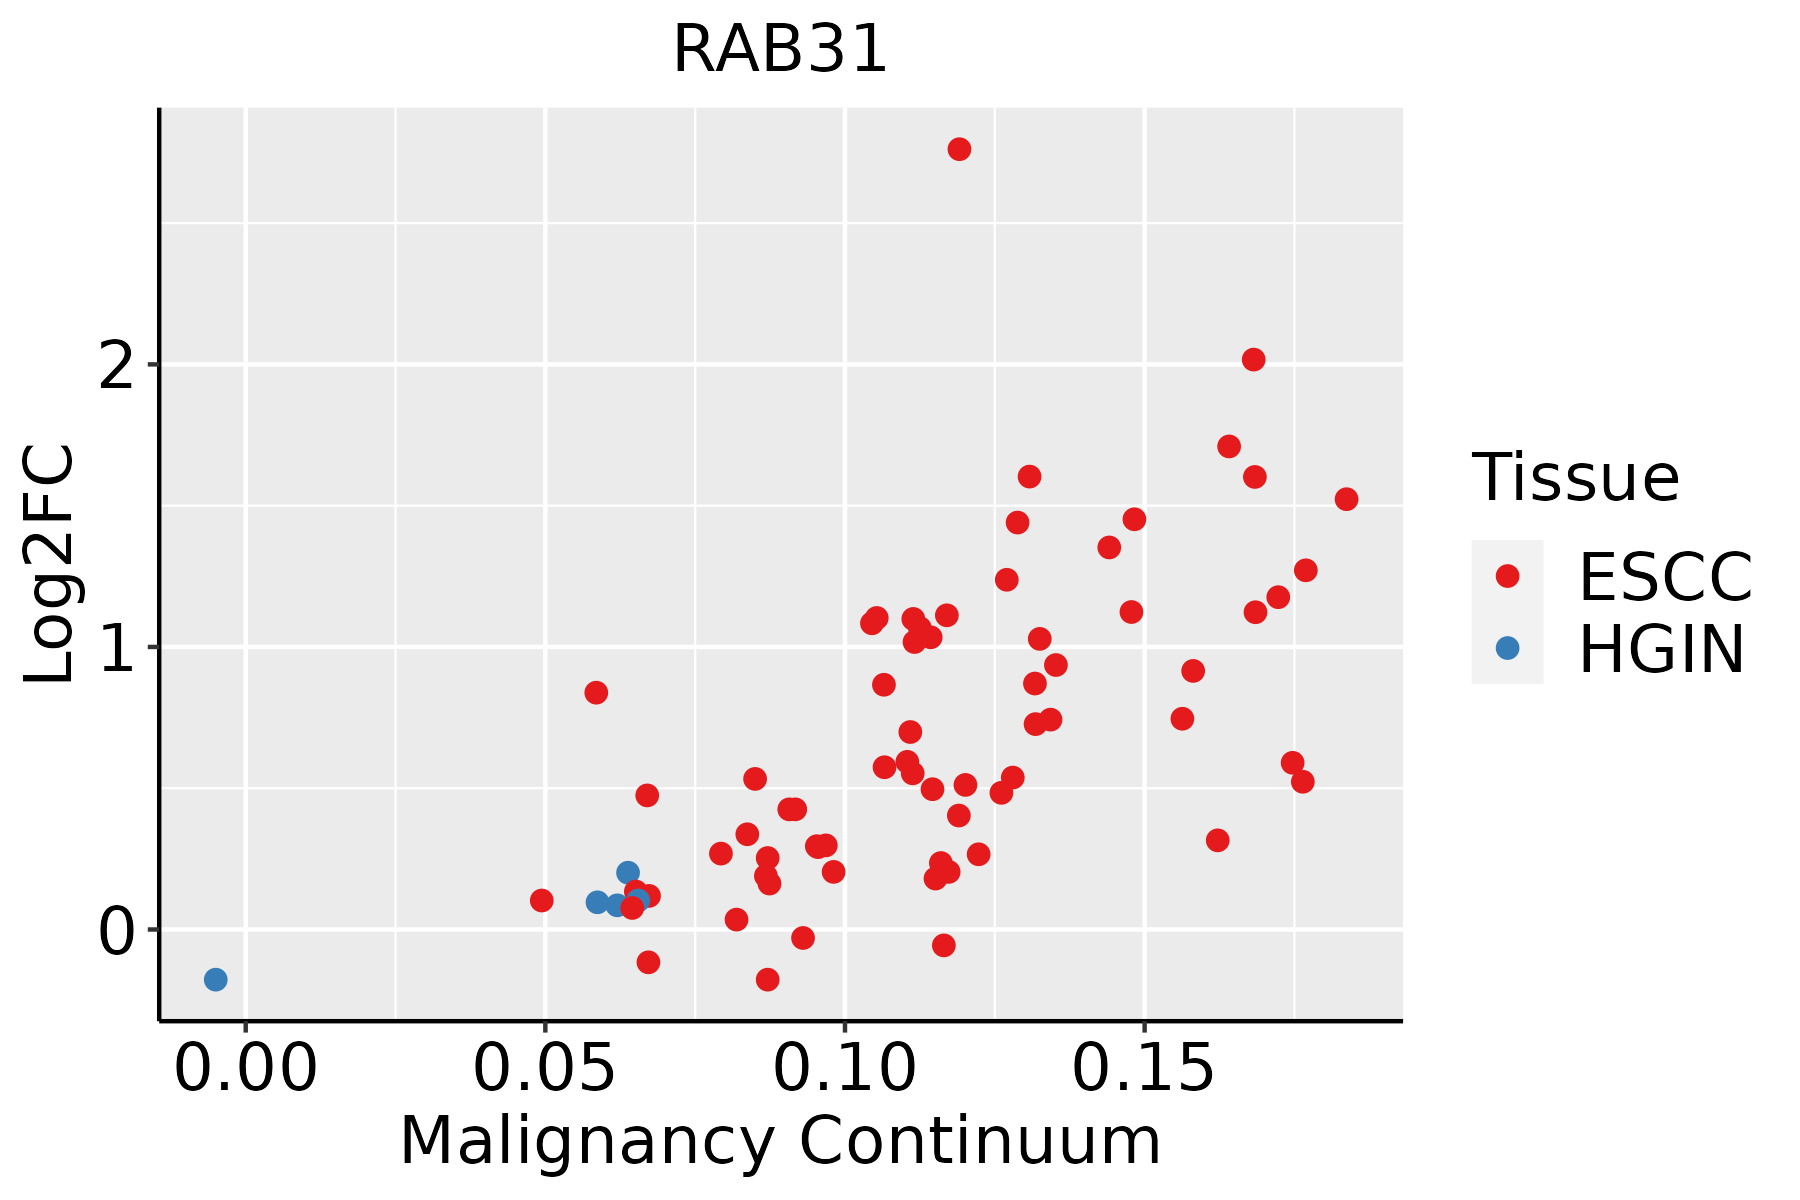 | ESCC: Esophageal squamous cell carcinoma |
| HGIN: High-grade intraepithelial neoplasias | ||
| LGIN: Low-grade intraepithelial neoplasias | ||
| Oral Cavity | 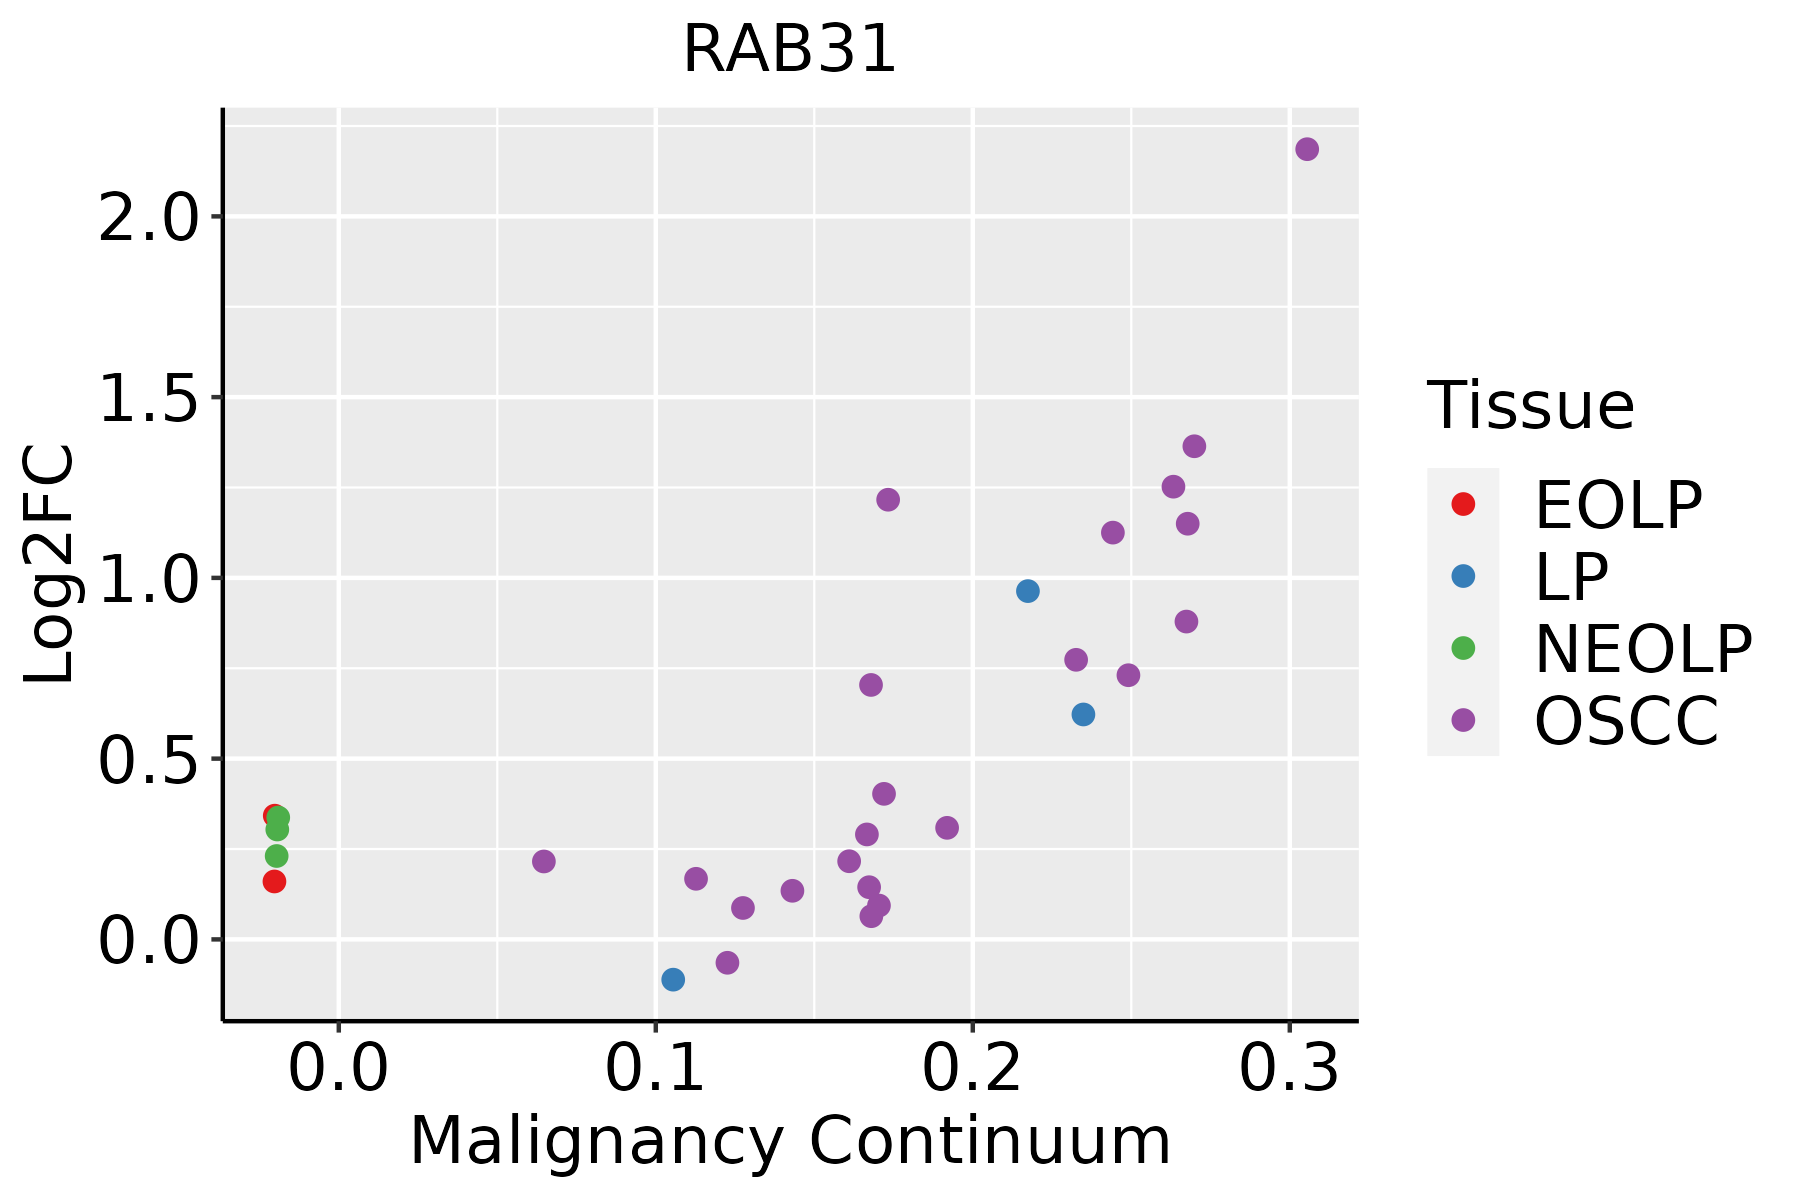 | EOLP: Erosive Oral lichen planus |
| LP: leukoplakia | ||
| NEOLP: Non-erosive oral lichen planus | ||
| OSCC: Oral squamous cell carcinoma | ||
| Skin | 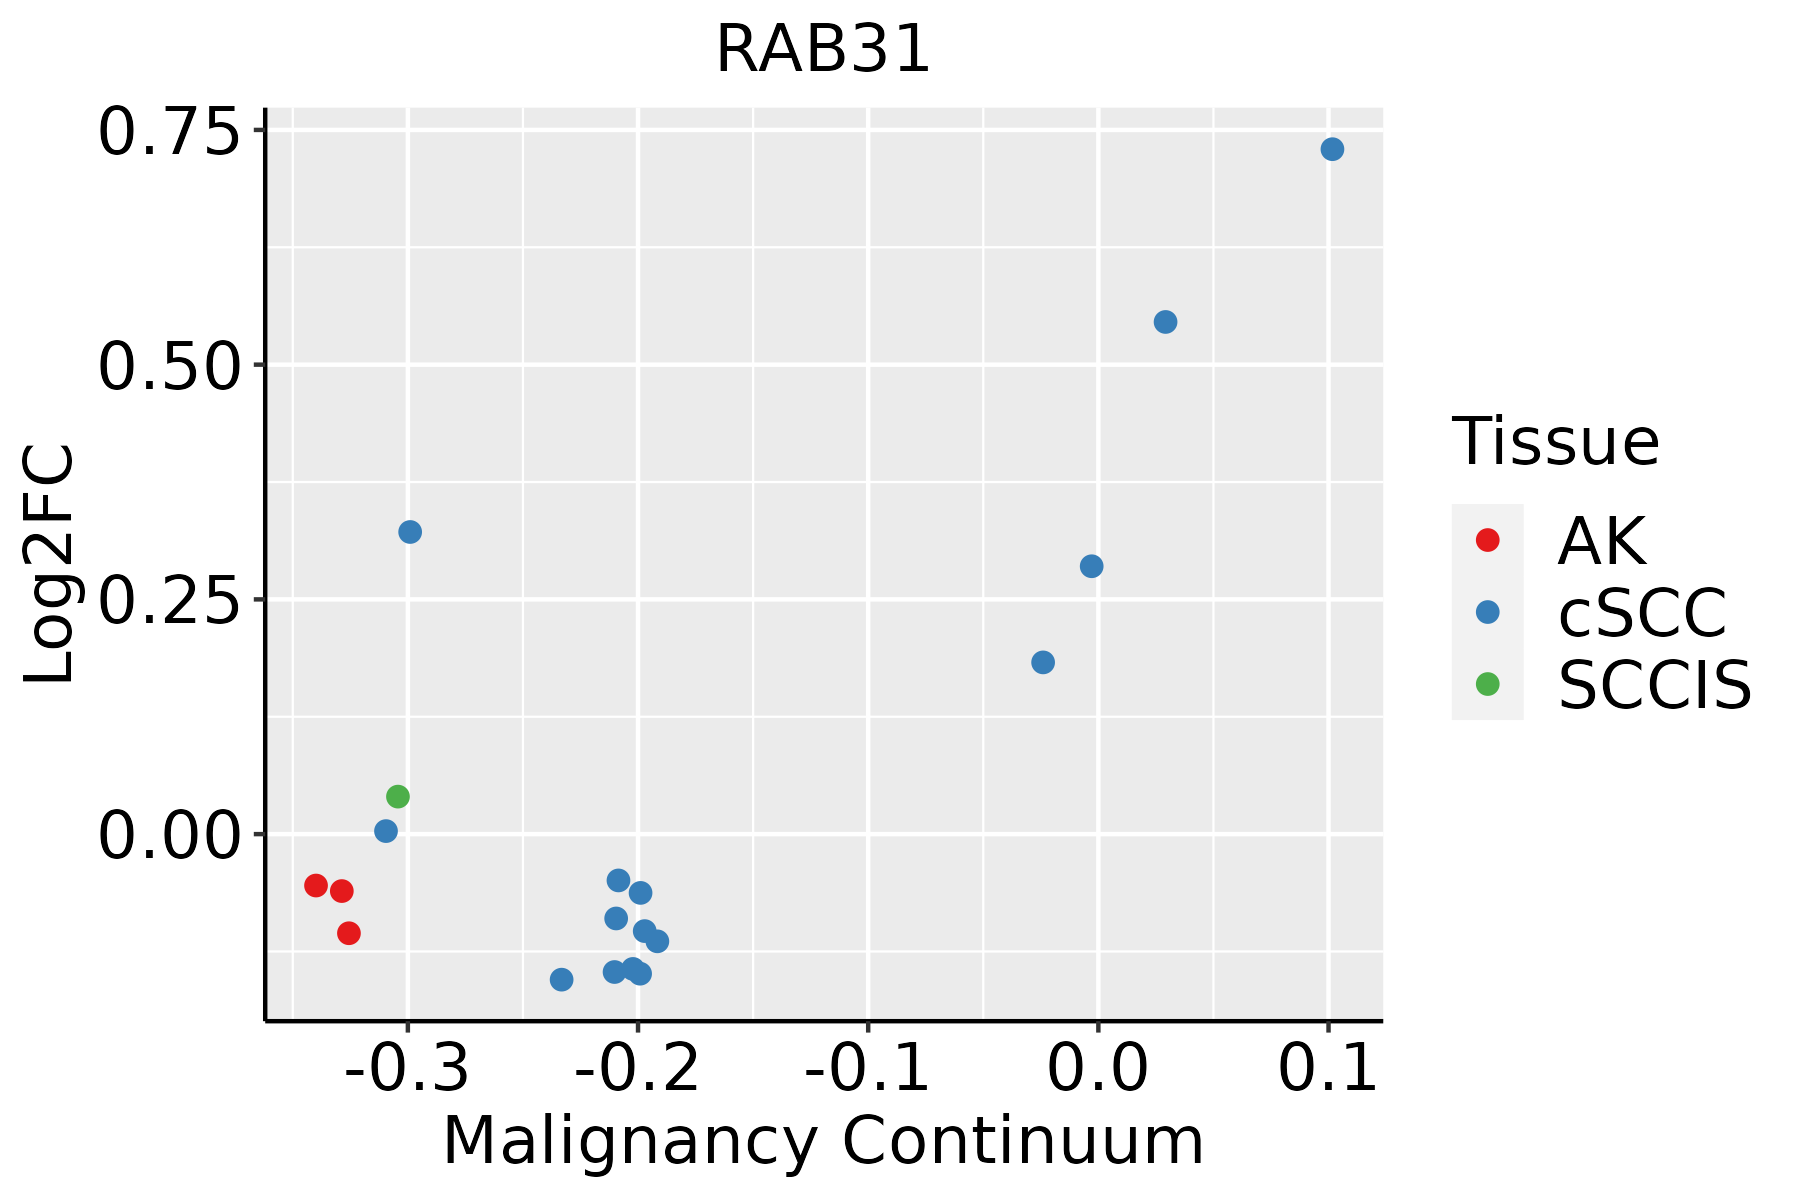 | AK: Actinic keratosis |
| cSCC: Cutaneous squamous cell carcinoma | ||
| SCCIS:squamous cell carcinoma in situ | ||
| Thyroid | 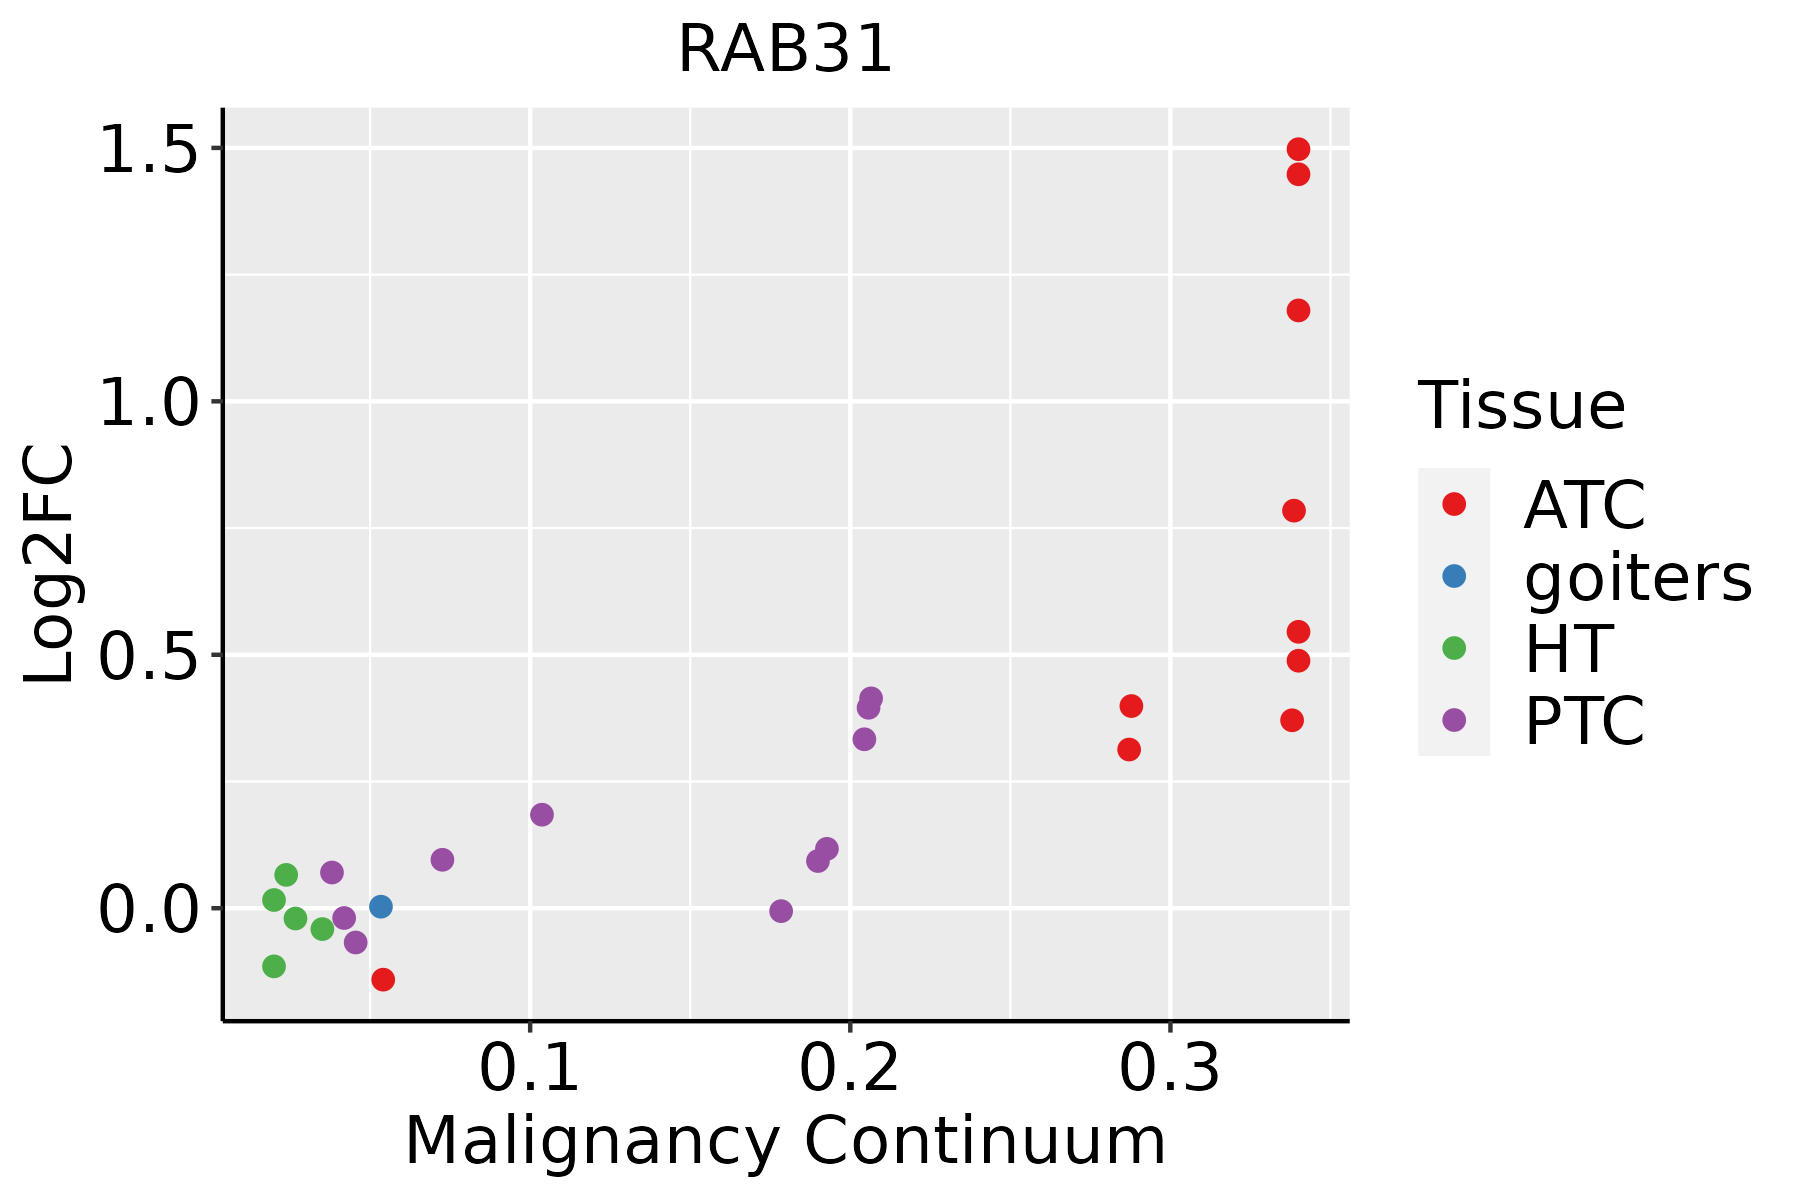 | ATC: Anaplastic thyroid cancer |
| HT: Hashimoto's thyroiditis | ||
| PTC: Papillary thyroid cancer |
| ∗log2FC in expression of this searched gene in stem-like cells from each diseased tissue sample relative to stem-like cells in normal samples in each tissue plotted against the malignancy continuum. Samples are colored based on if they are from different disease stage. |
Top |
Malignant transformation related pathway analysis |
| Find out the enriched GO biological processes and KEGG pathways involved in transition from healthy to precancer to cancer |
| Tissue | Disease Stage | Enriched GO biological Processes |
| Colorectum | AD |  |
| Colorectum | SER |  |
| Colorectum | MSS |  |
| Colorectum | MSI-H |  |
| Colorectum | FAP |  |
| ∗Top 15 enriched GO BP terms are showed in the bar plot of each disease state in each tissue. Each row represents a significant GO biological process which is colored according to the -log10(p.adjust). |
| Page: 1 2 3 4 5 6 7 8 9 |
| GO ID | Tissue | Disease Stage | Description | Gene Ratio | Bg Ratio | pvalue | p.adjust | Count |
| GO:00434348 | Breast | IDC | response to peptide hormone | 54/1434 | 414/18723 | 8.25e-05 | 1.61e-03 | 54 |
| GO:000689813 | Breast | IDC | receptor-mediated endocytosis | 35/1434 | 244/18723 | 2.38e-04 | 3.75e-03 | 35 |
| GO:004580713 | Breast | IDC | positive regulation of endocytosis | 18/1434 | 100/18723 | 5.40e-04 | 6.96e-03 | 18 |
| GO:003162311 | Breast | IDC | receptor internalization | 19/1434 | 113/18723 | 9.17e-04 | 1.05e-02 | 19 |
| GO:00431126 | Breast | IDC | receptor metabolic process | 23/1434 | 166/18723 | 4.04e-03 | 3.25e-02 | 23 |
| GO:00301007 | Breast | IDC | regulation of endocytosis | 27/1434 | 211/18723 | 5.92e-03 | 4.26e-02 | 27 |
| GO:00726599 | Breast | IDC | protein localization to plasma membrane | 34/1434 | 284/18723 | 6.33e-03 | 4.47e-02 | 34 |
| GO:00328687 | Breast | IDC | response to insulin | 32/1434 | 264/18723 | 6.61e-03 | 4.62e-02 | 32 |
| GO:00328697 | Breast | IDC | cellular response to insulin stimulus | 26/1434 | 203/18723 | 6.74e-03 | 4.68e-02 | 26 |
| GO:000689823 | Breast | DCIS | receptor-mediated endocytosis | 35/1390 | 244/18723 | 1.31e-04 | 2.25e-03 | 35 |
| GO:004343414 | Breast | DCIS | response to peptide hormone | 52/1390 | 414/18723 | 1.33e-04 | 2.28e-03 | 52 |
| GO:003162321 | Breast | DCIS | receptor internalization | 19/1390 | 113/18723 | 6.30e-04 | 7.90e-03 | 19 |
| GO:004580722 | Breast | DCIS | positive regulation of endocytosis | 17/1390 | 100/18723 | 1.05e-03 | 1.15e-02 | 17 |
| GO:004311213 | Breast | DCIS | receptor metabolic process | 23/1390 | 166/18723 | 2.75e-03 | 2.41e-02 | 23 |
| GO:003286813 | Breast | DCIS | response to insulin | 32/1390 | 264/18723 | 4.20e-03 | 3.31e-02 | 32 |
| GO:003286913 | Breast | DCIS | cellular response to insulin stimulus | 26/1390 | 203/18723 | 4.53e-03 | 3.47e-02 | 26 |
| GO:004819318 | Esophagus | ESCC | Golgi vesicle transport | 231/8552 | 296/18723 | 1.82e-30 | 9.63e-28 | 231 |
| GO:0090150110 | Esophagus | ESCC | establishment of protein localization to membrane | 182/8552 | 260/18723 | 1.27e-15 | 8.19e-14 | 182 |
| GO:0072659110 | Esophagus | ESCC | protein localization to plasma membrane | 193/8552 | 284/18723 | 1.95e-14 | 1.03e-12 | 193 |
| GO:199077819 | Esophagus | ESCC | protein localization to cell periphery | 217/8552 | 333/18723 | 4.08e-13 | 1.88e-11 | 217 |
| Page: 1 2 3 4 5 6 7 8 9 |
| Pathway ID | Tissue | Disease Stage | Description | Gene Ratio | Bg Ratio | pvalue | p.adjust | qvalue | Count |
| hsa0414416 | Breast | DCIS | Endocytosis | 37/846 | 251/8465 | 9.92e-03 | 4.40e-02 | 3.24e-02 | 37 |
| hsa0414417 | Breast | DCIS | Endocytosis | 37/846 | 251/8465 | 9.92e-03 | 4.40e-02 | 3.24e-02 | 37 |
| hsa04144210 | Esophagus | ESCC | Endocytosis | 186/4205 | 251/8465 | 9.74e-16 | 4.66e-14 | 2.39e-14 | 186 |
| hsa0414437 | Esophagus | ESCC | Endocytosis | 186/4205 | 251/8465 | 9.74e-16 | 4.66e-14 | 2.39e-14 | 186 |
| hsa0414427 | Oral cavity | OSCC | Endocytosis | 174/3704 | 251/8465 | 9.42e-17 | 4.51e-15 | 2.29e-15 | 174 |
| hsa04144112 | Oral cavity | OSCC | Endocytosis | 174/3704 | 251/8465 | 9.42e-17 | 4.51e-15 | 2.29e-15 | 174 |
| hsa0414428 | Oral cavity | LP | Endocytosis | 121/2418 | 251/8465 | 1.89e-11 | 3.70e-10 | 2.38e-10 | 121 |
| hsa0414436 | Oral cavity | LP | Endocytosis | 121/2418 | 251/8465 | 1.89e-11 | 3.70e-10 | 2.38e-10 | 121 |
| hsa0414442 | Oral cavity | EOLP | Endocytosis | 71/1218 | 251/8465 | 5.28e-09 | 8.97e-08 | 5.29e-08 | 71 |
| hsa0414452 | Oral cavity | EOLP | Endocytosis | 71/1218 | 251/8465 | 5.28e-09 | 8.97e-08 | 5.29e-08 | 71 |
| hsa0414461 | Oral cavity | NEOLP | Endocytosis | 62/1112 | 251/8465 | 3.56e-07 | 4.92e-06 | 3.09e-06 | 62 |
| hsa0414471 | Oral cavity | NEOLP | Endocytosis | 62/1112 | 251/8465 | 3.56e-07 | 4.92e-06 | 3.09e-06 | 62 |
| Page: 1 |
Top |
Cell-cell communication analysis |
| Identification of potential cell-cell interactions between two cell types and their ligand-receptor pairs for different disease states |
| Ligand | Receptor | LRpair | Pathway | Tissue | Disease Stage |
| Page: 1 |
Top |
Single-cell gene regulatory network inference analysis |
| Find out the significant the regulons (TFs) and the target genes of each regulon across cell types for different disease states |
| TF | Cell Type | Tissue | Disease Stage | Target Gene | RSS | Regulon Activity |
| ∗The dot plots of a searched regulon are shown for all cell subpopulations in each disease state of each tissue based on the regulon specific score inferred using pySCENIC and by calculating the average expression. |
| Page: 1 |
Top |
Somatic mutation of malignant transformation related genes |
| Annotation of somatic variants for genes involved in malignant transformation |
| Hugo Symbol | Variant Class | Variant Classification | dbSNP RS | HGVSc | HGVSp | HGVSp Short | SWISSPROT | BIOTYPE | SIFT | PolyPhen | Tumor Sample Barcode | Tissue | Histology | Sex | Age | Stage | Therapy Types | Drugs | Outcome |
| RAB31 | SNV | Missense_Mutation | novel | c.88N>G | p.His30Asp | p.H30D | Q13636 | protein_coding | tolerated(0.07) | possibly_damaging(0.837) | TCGA-LL-A73Y-01 | Breast | breast invasive carcinoma | Female | >=65 | I/II | Chemotherapy | taxotere | SD |
| RAB31 | SNV | Missense_Mutation | c.294G>T | p.Lys98Asn | p.K98N | Q13636 | protein_coding | deleterious(0.01) | possibly_damaging(0.822) | TCGA-FU-A3HZ-01 | Cervix | cervical & endocervical cancer | Female | <65 | I/II | Chemotherapy | cisplatin | CR | |
| RAB31 | SNV | Missense_Mutation | novel | c.405G>C | p.Lys135Asn | p.K135N | Q13636 | protein_coding | deleterious(0.05) | possibly_damaging(0.811) | TCGA-JW-A5VL-01 | Cervix | cervical & endocervical cancer | Female | <65 | I/II | Unknown | Unknown | SD |
| RAB31 | SNV | Missense_Mutation | c.125N>T | p.Ser42Phe | p.S42F | Q13636 | protein_coding | deleterious(0.02) | possibly_damaging(0.768) | TCGA-Q1-A73P-01 | Cervix | cervical & endocervical cancer | Female | <65 | I/II | Unknown | Unknown | SD | |
| RAB31 | SNV | Missense_Mutation | c.269N>C | p.Lys90Thr | p.K90T | Q13636 | protein_coding | tolerated(0.11) | benign(0.155) | TCGA-AA-A010-01 | Colorectum | colon adenocarcinoma | Female | <65 | I/II | Chemotherapy | folinic | CR | |
| RAB31 | SNV | Missense_Mutation | rs760965574 | c.575N>A | p.Arg192His | p.R192H | Q13636 | protein_coding | deleterious(0.04) | benign(0.031) | TCGA-AY-4070-01 | Colorectum | colon adenocarcinoma | Female | <65 | III/IV | Chemotherapy | 5-fu | PD |
| RAB31 | SNV | Missense_Mutation | novel | c.127N>G | p.Phe43Val | p.F43V | Q13636 | protein_coding | deleterious(0) | benign(0.362) | TCGA-CA-6717-01 | Colorectum | colon adenocarcinoma | Male | <65 | I/II | Chemotherapy | oxaliplatin | CR |
| RAB31 | SNV | Missense_Mutation | c.294N>T | p.Lys98Asn | p.K98N | Q13636 | protein_coding | deleterious(0.01) | possibly_damaging(0.822) | TCGA-AP-A1DV-01 | Endometrium | uterine corpus endometrioid carcinoma | Female | <65 | I/II | Unknown | Unknown | SD | |
| RAB31 | SNV | Missense_Mutation | rs868431175 | c.475N>A | p.Leu159Ile | p.L159I | Q13636 | protein_coding | tolerated(0.31) | probably_damaging(0.999) | TCGA-AX-A06F-01 | Endometrium | uterine corpus endometrioid carcinoma | Female | <65 | III/IV | Chemotherapy | carboplatin | SD |
| RAB31 | SNV | Missense_Mutation | novel | c.304N>G | p.Lys102Glu | p.K102E | Q13636 | protein_coding | tolerated(0.05) | possibly_damaging(0.79) | TCGA-AX-A2HA-01 | Endometrium | uterine corpus endometrioid carcinoma | Female | <65 | I/II | Unknown | Unknown | SD |
| Page: 1 2 |
Top |
Related drugs of malignant transformation related genes |
| Identification of chemicals and drugs interact with genes involved in malignant transfromation |
| (DGIdb 4.0) |
| Entrez ID | Symbol | Category | Interaction Types | Drug Claim Name | Drug Name | PMIDs |
| Page: 1 |

Copyright 2023-Present -The University of Texas Health Science Center at Houston |