
|
|||||
|
 | |
| |
| |
| |
| |
| |
|
Gene: RAB30 |
Gene summary for RAB30 |
| Gene information | Species | Human | Gene symbol | RAB30 | Gene ID | 27314 |
| Gene name | RAB30, member RAS oncogene family | |
| Gene Alias | RAB30 | |
| Cytomap | 11q14.1 | |
| Gene Type | protein-coding | GO ID | GO:0006996 | UniProtAcc | A8K5R1 |
Top |
Malignant transformation analysis |
| Identification of the aberrant gene expression in precancerous and cancerous lesions by comparing the gene expression of stem-like cells in diseased tissues with normal stem cells |
| Entrez ID | Symbol | Replicates | Species | Organ | Tissue | Adj P-value | Log2FC | Malignancy |
| 27314 | RAB30 | HCC1_Meng | Human | Liver | HCC | 1.06e-12 | -4.84e-02 | 0.0246 |
| 27314 | RAB30 | HCC1 | Human | Liver | HCC | 1.46e-02 | 3.55e+00 | 0.5336 |
| 27314 | RAB30 | HCC2 | Human | Liver | HCC | 9.17e-03 | 4.86e-01 | 0.5341 |
| 27314 | RAB30 | S014 | Human | Liver | HCC | 2.95e-17 | 7.08e-01 | 0.2254 |
| 27314 | RAB30 | S015 | Human | Liver | HCC | 4.41e-15 | 7.71e-01 | 0.2375 |
| 27314 | RAB30 | S016 | Human | Liver | HCC | 1.48e-27 | 9.08e-01 | 0.2243 |
| 27314 | RAB30 | S028 | Human | Liver | HCC | 2.90e-04 | 3.08e-01 | 0.2503 |
| 27314 | RAB30 | GSM5252128_BPH327PrGF_Via | Human | Prostate | BPH | 2.22e-03 | 2.04e-01 | -0.1688 |
| 27314 | RAB30 | GSM5252132_BPH389PrGF | Human | Prostate | BPH | 2.94e-04 | 3.94e-01 | -0.2247 |
| 27314 | RAB30 | GSM5252137_BPH556PrGA2_Fcol | Human | Prostate | BPH | 1.30e-02 | 3.20e-01 | -0.23 |
| 27314 | RAB30 | 048752_1579-all-cells | Human | Prostate | BPH | 3.59e-10 | 3.00e-01 | 0.1008 |
| 27314 | RAB30 | 052095_1628-all-cells | Human | Prostate | BPH | 1.05e-03 | 2.72e-01 | 0.1032 |
| 27314 | RAB30 | 052097_1595-all-cells | Human | Prostate | BPH | 2.42e-03 | 1.64e-01 | 0.0972 |
| 27314 | RAB30 | 052099_1652-all-cells | Human | Prostate | BPH | 1.96e-10 | 3.26e-01 | 0.1038 |
| 27314 | RAB30 | GSM5353218_PA_PB1B_Pool_1_2_S74_L003 | Human | Prostate | Tumor | 6.21e-04 | 7.28e-01 | 0.1479 |
| 27314 | RAB30 | GSM5353220_PA_PB1B_Pool_3_S51_L002 | Human | Prostate | Tumor | 1.13e-02 | 6.38e-01 | 0.1531 |
| 27314 | RAB30 | GSM5353225_PA_PR5196-1_Pool_1_2_3_S53_L002 | Human | Prostate | Tumor | 5.24e-04 | 5.83e-01 | 0.1619 |
| 27314 | RAB30 | GSM5353226_PA_PR5196-2_Pool_1_2_3_S54_L002 | Human | Prostate | Tumor | 6.41e-06 | 7.81e-01 | 0.159 |
| Page: 1 |
| Tissue | Expression Dynamics | Abbreviation |
| Liver | 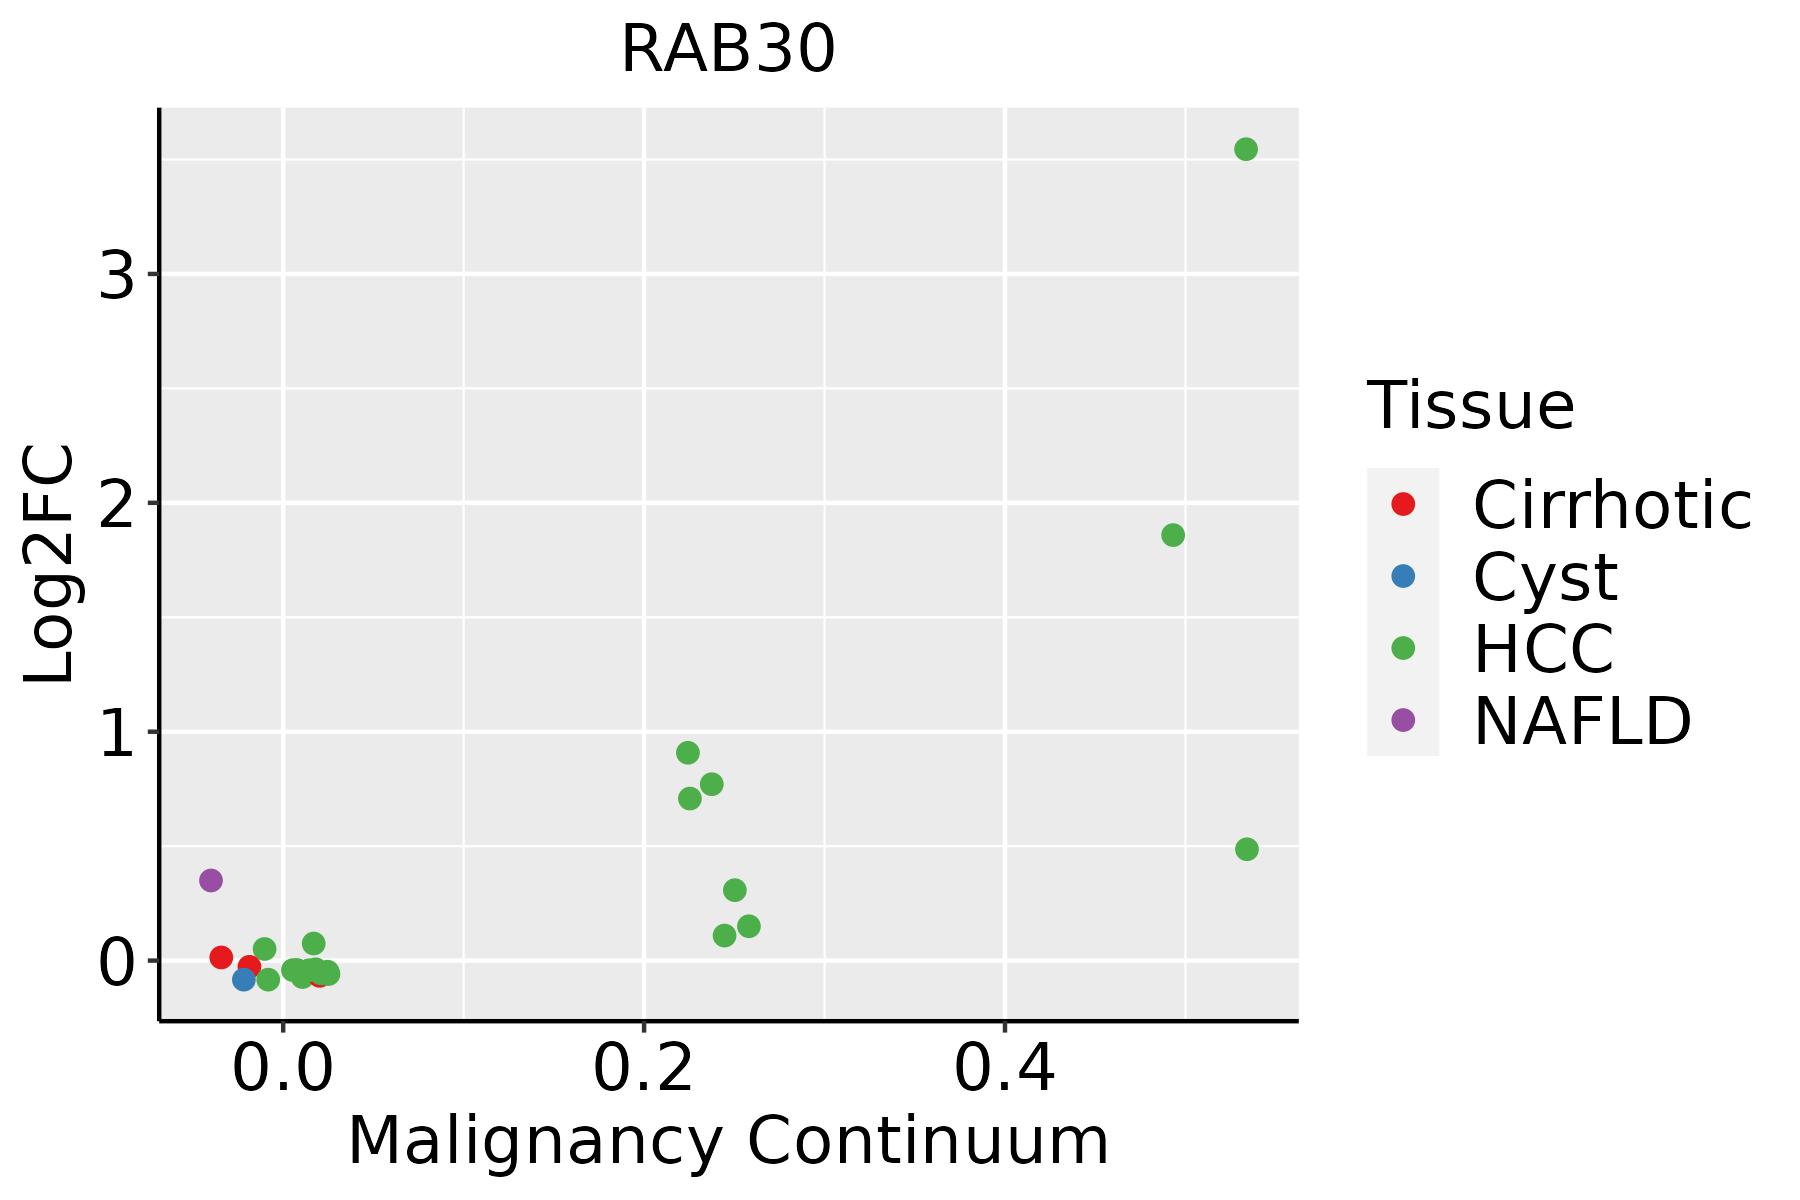 | HCC: Hepatocellular carcinoma |
| NAFLD: Non-alcoholic fatty liver disease | ||
| Prostate | 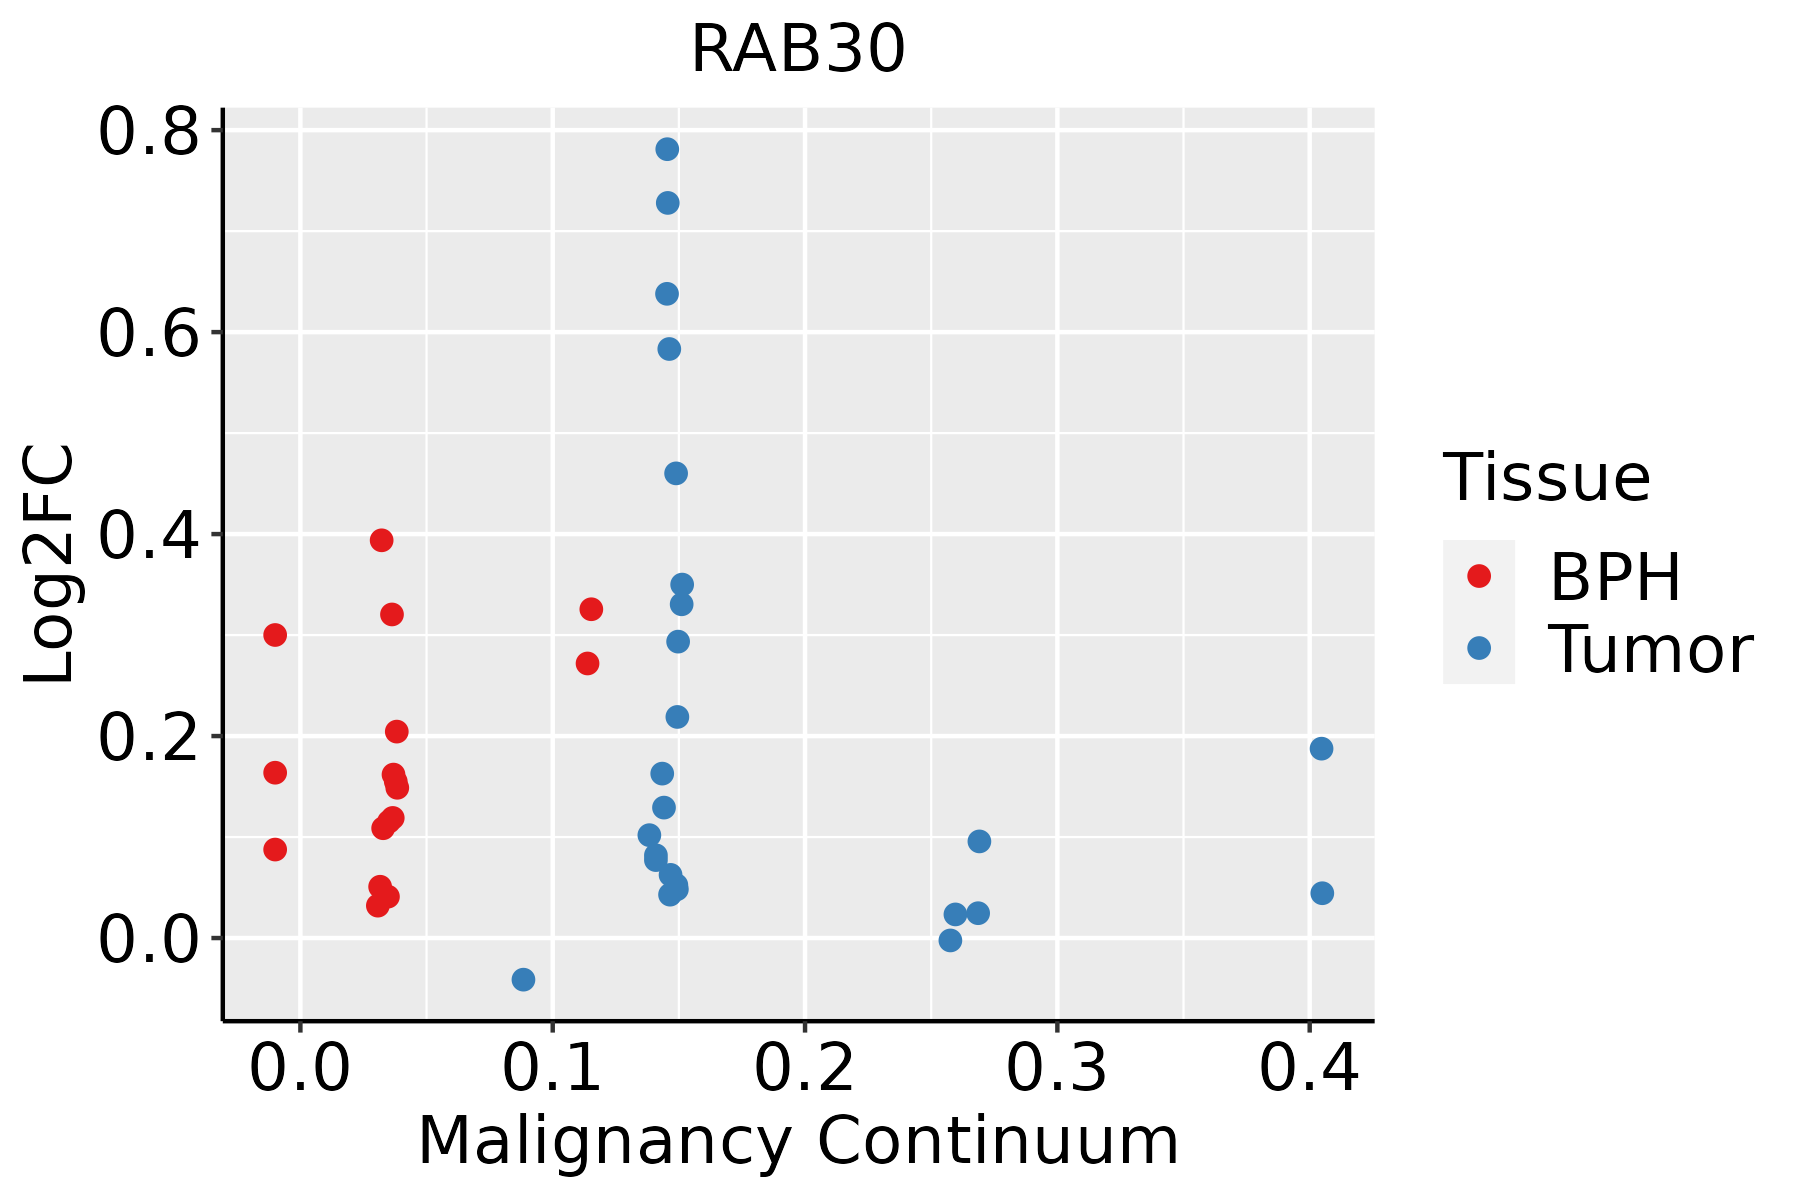 | BPH: Benign Prostatic Hyperplasia |
| ∗log2FC in expression of this searched gene in stem-like cells from each diseased tissue sample relative to stem-like cells in normal samples in each tissue plotted against the malignancy continuum. Samples are colored based on if they are from different disease stage. |
Top |
Malignant transformation related pathway analysis |
| Find out the enriched GO biological processes and KEGG pathways involved in transition from healthy to precancer to cancer |
| Tissue | Disease Stage | Enriched GO biological Processes |
| Colorectum | AD |  |
| Colorectum | SER |  |
| Colorectum | MSS |  |
| Colorectum | MSI-H |  |
| Colorectum | FAP |  |
| ∗Top 15 enriched GO BP terms are showed in the bar plot of each disease state in each tissue. Each row represents a significant GO biological process which is colored according to the -log10(p.adjust). |
| Page: 1 2 3 4 5 6 7 8 9 |
| GO ID | Tissue | Disease Stage | Description | Gene Ratio | Bg Ratio | pvalue | p.adjust | Count |
| GO:00070302 | Liver | HCC | Golgi organization | 99/7958 | 157/18723 | 1.54e-07 | 2.85e-06 | 99 |
| GO:000726521 | Liver | HCC | Ras protein signal transduction | 187/7958 | 337/18723 | 8.89e-07 | 1.35e-05 | 187 |
| GO:00072658 | Prostate | BPH | Ras protein signal transduction | 101/3107 | 337/18723 | 5.64e-10 | 2.79e-08 | 101 |
| GO:00070306 | Prostate | BPH | Golgi organization | 39/3107 | 157/18723 | 5.20e-03 | 2.43e-02 | 39 |
| GO:000726514 | Prostate | Tumor | Ras protein signal transduction | 101/3246 | 337/18723 | 6.29e-09 | 2.44e-07 | 101 |
| GO:000703013 | Prostate | Tumor | Golgi organization | 40/3246 | 157/18723 | 6.33e-03 | 2.90e-02 | 40 |
| Page: 1 |
| Pathway ID | Tissue | Disease Stage | Description | Gene Ratio | Bg Ratio | pvalue | p.adjust | qvalue | Count |
| Page: 1 |
Top |
Cell-cell communication analysis |
| Identification of potential cell-cell interactions between two cell types and their ligand-receptor pairs for different disease states |
| Ligand | Receptor | LRpair | Pathway | Tissue | Disease Stage |
| Page: 1 |
Top |
Single-cell gene regulatory network inference analysis |
| Find out the significant the regulons (TFs) and the target genes of each regulon across cell types for different disease states |
| TF | Cell Type | Tissue | Disease Stage | Target Gene | RSS | Regulon Activity |
| ∗The dot plots of a searched regulon are shown for all cell subpopulations in each disease state of each tissue based on the regulon specific score inferred using pySCENIC and by calculating the average expression. |
| Page: 1 |
Top |
Somatic mutation of malignant transformation related genes |
| Annotation of somatic variants for genes involved in malignant transformation |
| Hugo Symbol | Variant Class | Variant Classification | dbSNP RS | HGVSc | HGVSp | HGVSp Short | SWISSPROT | BIOTYPE | SIFT | PolyPhen | Tumor Sample Barcode | Tissue | Histology | Sex | Age | Stage | Therapy Types | Drugs | Outcome |
| RAB30 | SNV | Missense_Mutation | c.79C>G | p.Arg27Gly | p.R27G | Q15771 | protein_coding | tolerated(0.07) | probably_damaging(0.996) | TCGA-D8-A140-01 | Breast | breast invasive carcinoma | Female | <65 | I/II | Chemotherapy | doxorubicin+cyclophosphamid | SD | |
| RAB30 | SNV | Missense_Mutation | c.19N>T | p.Asp7Tyr | p.D7Y | Q15771 | protein_coding | deleterious(0) | possibly_damaging(0.732) | TCGA-AG-3892-01 | Colorectum | rectum adenocarcinoma | Female | <65 | I/II | Unknown | Unknown | SD | |
| RAB30 | SNV | Missense_Mutation | novel | c.13N>T | p.Asp5Tyr | p.D5Y | Q15771 | protein_coding | deleterious(0) | probably_damaging(0.994) | TCGA-AG-A002-01 | Colorectum | rectum adenocarcinoma | Male | <65 | I/II | Unknown | Unknown | SD |
| RAB30 | SNV | Missense_Mutation | rs780281834 | c.370A>G | p.Ile124Val | p.I124V | Q15771 | protein_coding | tolerated(0.2) | benign(0.022) | TCGA-A5-A0G1-01 | Endometrium | uterine corpus endometrioid carcinoma | Female | >=65 | I/II | Unknown | Unknown | SD |
| RAB30 | SNV | Missense_Mutation | c.583N>G | p.Ser195Gly | p.S195G | Q15771 | protein_coding | tolerated(0.1) | benign(0.01) | TCGA-AP-A056-01 | Endometrium | uterine corpus endometrioid carcinoma | Female | <65 | I/II | Unknown | Unknown | SD | |
| RAB30 | SNV | Missense_Mutation | c.524G>C | p.Arg175Thr | p.R175T | Q15771 | protein_coding | tolerated(0.26) | benign(0.094) | TCGA-AP-A0L8-01 | Endometrium | uterine corpus endometrioid carcinoma | Female | >=65 | III/IV | Unknown | Unknown | PD | |
| RAB30 | SNV | Missense_Mutation | novel | c.97N>A | p.Leu33Ile | p.L33I | Q15771 | protein_coding | tolerated(0.15) | benign(0.027) | TCGA-AP-A1DV-01 | Endometrium | uterine corpus endometrioid carcinoma | Female | <65 | I/II | Unknown | Unknown | SD |
| RAB30 | SNV | Missense_Mutation | novel | c.434N>G | p.Asp145Gly | p.D145G | Q15771 | protein_coding | tolerated(1) | benign(0) | TCGA-AX-A1CE-01 | Endometrium | uterine corpus endometrioid carcinoma | Female | <65 | I/II | Unspecific | Paclitaxel | SD |
| RAB30 | SNV | Missense_Mutation | c.218N>A | p.Ser73Tyr | p.S73Y | Q15771 | protein_coding | deleterious(0) | probably_damaging(0.997) | TCGA-B5-A11E-01 | Endometrium | uterine corpus endometrioid carcinoma | Female | <65 | I/II | Unknown | Unknown | SD | |
| RAB30 | SNV | Missense_Mutation | rs149145222 | c.506N>A | p.Arg169Gln | p.R169Q | Q15771 | protein_coding | tolerated(0.29) | benign(0.003) | TCGA-B5-A3FC-01 | Endometrium | uterine corpus endometrioid carcinoma | Female | <65 | I/II | Unknown | Unknown | SD |
| Page: 1 2 3 |
Top |
Related drugs of malignant transformation related genes |
| Identification of chemicals and drugs interact with genes involved in malignant transfromation |
| (DGIdb 4.0) |
| Entrez ID | Symbol | Category | Interaction Types | Drug Claim Name | Drug Name | PMIDs |
| Page: 1 |

Copyright 2023-Present -The University of Texas Health Science Center at Houston |