
|
|||||
|
 | |
| |
| |
| |
| |
| |
|
Gene: RAB28 |
Gene summary for RAB28 |
| Gene information | Species | Human | Gene symbol | RAB28 | Gene ID | 9364 |
| Gene name | RAB28, member RAS oncogene family | |
| Gene Alias | CORD18 | |
| Cytomap | 4p15.33 | |
| Gene Type | protein-coding | GO ID | GO:0006810 | UniProtAcc | P51157 |
Top |
Malignant transformation analysis |
| Identification of the aberrant gene expression in precancerous and cancerous lesions by comparing the gene expression of stem-like cells in diseased tissues with normal stem cells |
| Entrez ID | Symbol | Replicates | Species | Organ | Tissue | Adj P-value | Log2FC | Malignancy |
| 9364 | RAB28 | HTA11_3410_2000001011 | Human | Colorectum | AD | 1.36e-13 | -5.74e-01 | 0.0155 |
| 9364 | RAB28 | HTA11_2487_2000001011 | Human | Colorectum | SER | 6.43e-05 | -4.92e-01 | -0.1808 |
| 9364 | RAB28 | HTA11_3361_2000001011 | Human | Colorectum | AD | 6.15e-03 | -4.69e-01 | -0.1207 |
| 9364 | RAB28 | HTA11_696_2000001011 | Human | Colorectum | AD | 1.36e-04 | -3.74e-01 | -0.1464 |
| 9364 | RAB28 | HTA11_866_2000001011 | Human | Colorectum | AD | 2.74e-05 | -3.86e-01 | -0.1001 |
| 9364 | RAB28 | HTA11_866_3004761011 | Human | Colorectum | AD | 2.36e-07 | -4.77e-01 | 0.096 |
| 9364 | RAB28 | HTA11_7696_3000711011 | Human | Colorectum | AD | 6.77e-14 | -5.35e-01 | 0.0674 |
| 9364 | RAB28 | HTA11_6818_2000001021 | Human | Colorectum | AD | 7.98e-03 | -5.02e-01 | 0.0588 |
| 9364 | RAB28 | HTA11_99999970781_79442 | Human | Colorectum | MSS | 8.22e-09 | -4.47e-01 | 0.294 |
| 9364 | RAB28 | HTA11_99999971662_82457 | Human | Colorectum | MSS | 2.64e-05 | -4.03e-01 | 0.3859 |
| 9364 | RAB28 | HTA11_99999974143_84620 | Human | Colorectum | MSS | 5.10e-14 | -5.38e-01 | 0.3005 |
| 9364 | RAB28 | A015-C-203 | Human | Colorectum | FAP | 9.52e-19 | -3.44e-01 | -0.1294 |
| 9364 | RAB28 | A015-C-204 | Human | Colorectum | FAP | 1.02e-02 | -1.06e-01 | -0.0228 |
| 9364 | RAB28 | A014-C-040 | Human | Colorectum | FAP | 4.08e-02 | -4.09e-01 | -0.1184 |
| 9364 | RAB28 | A002-C-201 | Human | Colorectum | FAP | 6.54e-09 | -2.50e-01 | 0.0324 |
| 9364 | RAB28 | A001-C-119 | Human | Colorectum | FAP | 9.51e-04 | -2.99e-01 | -0.1557 |
| 9364 | RAB28 | A001-C-108 | Human | Colorectum | FAP | 9.59e-13 | -1.88e-01 | -0.0272 |
| 9364 | RAB28 | A002-C-205 | Human | Colorectum | FAP | 7.38e-15 | -3.93e-01 | -0.1236 |
| 9364 | RAB28 | A015-C-006 | Human | Colorectum | FAP | 3.01e-11 | -2.63e-01 | -0.0994 |
| 9364 | RAB28 | A015-C-106 | Human | Colorectum | FAP | 3.55e-06 | -1.95e-01 | -0.0511 |
| Page: 1 2 3 4 5 6 |
| Tissue | Expression Dynamics | Abbreviation |
| Colorectum (GSE201348) | 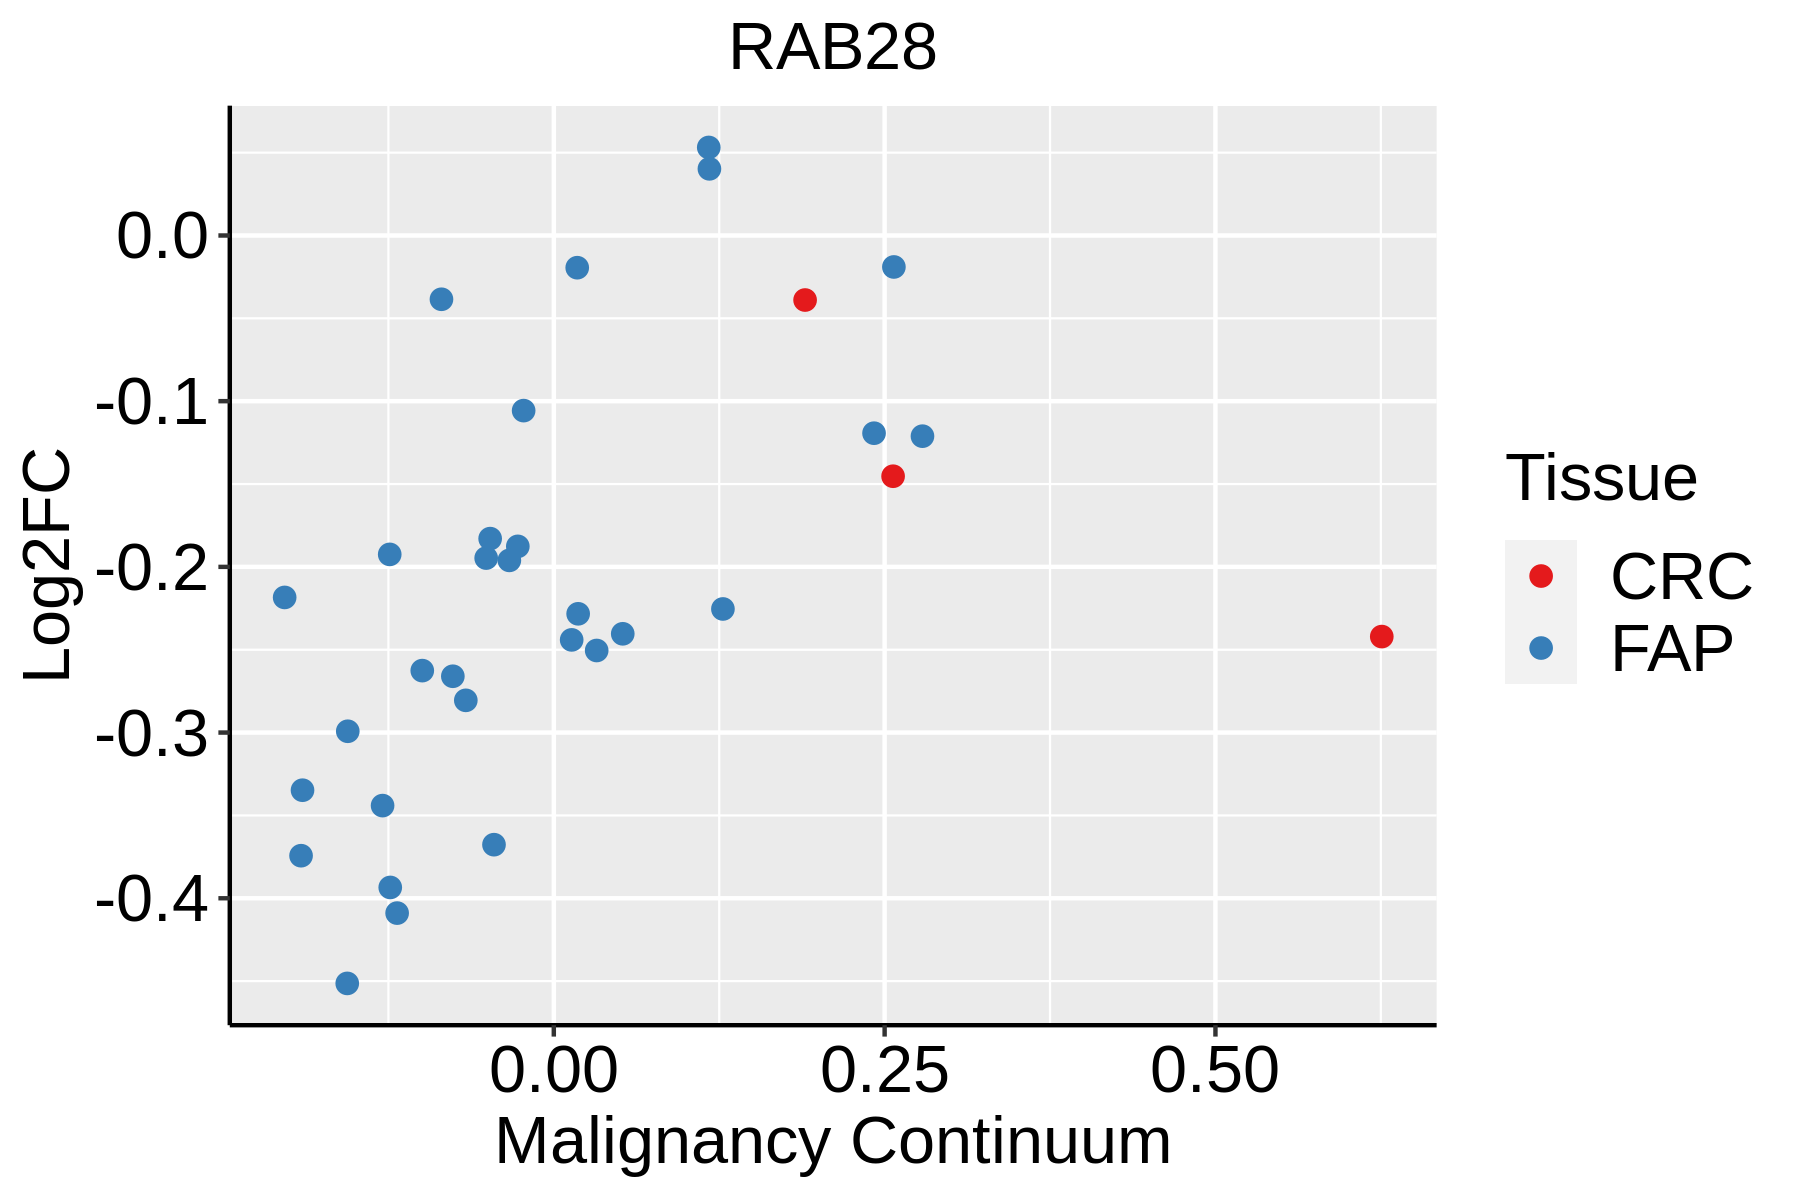 | FAP: Familial adenomatous polyposis |
| CRC: Colorectal cancer | ||
| Colorectum (HTA11) |  | AD: Adenomas |
| SER: Sessile serrated lesions | ||
| MSI-H: Microsatellite-high colorectal cancer | ||
| MSS: Microsatellite stable colorectal cancer | ||
| Esophagus | 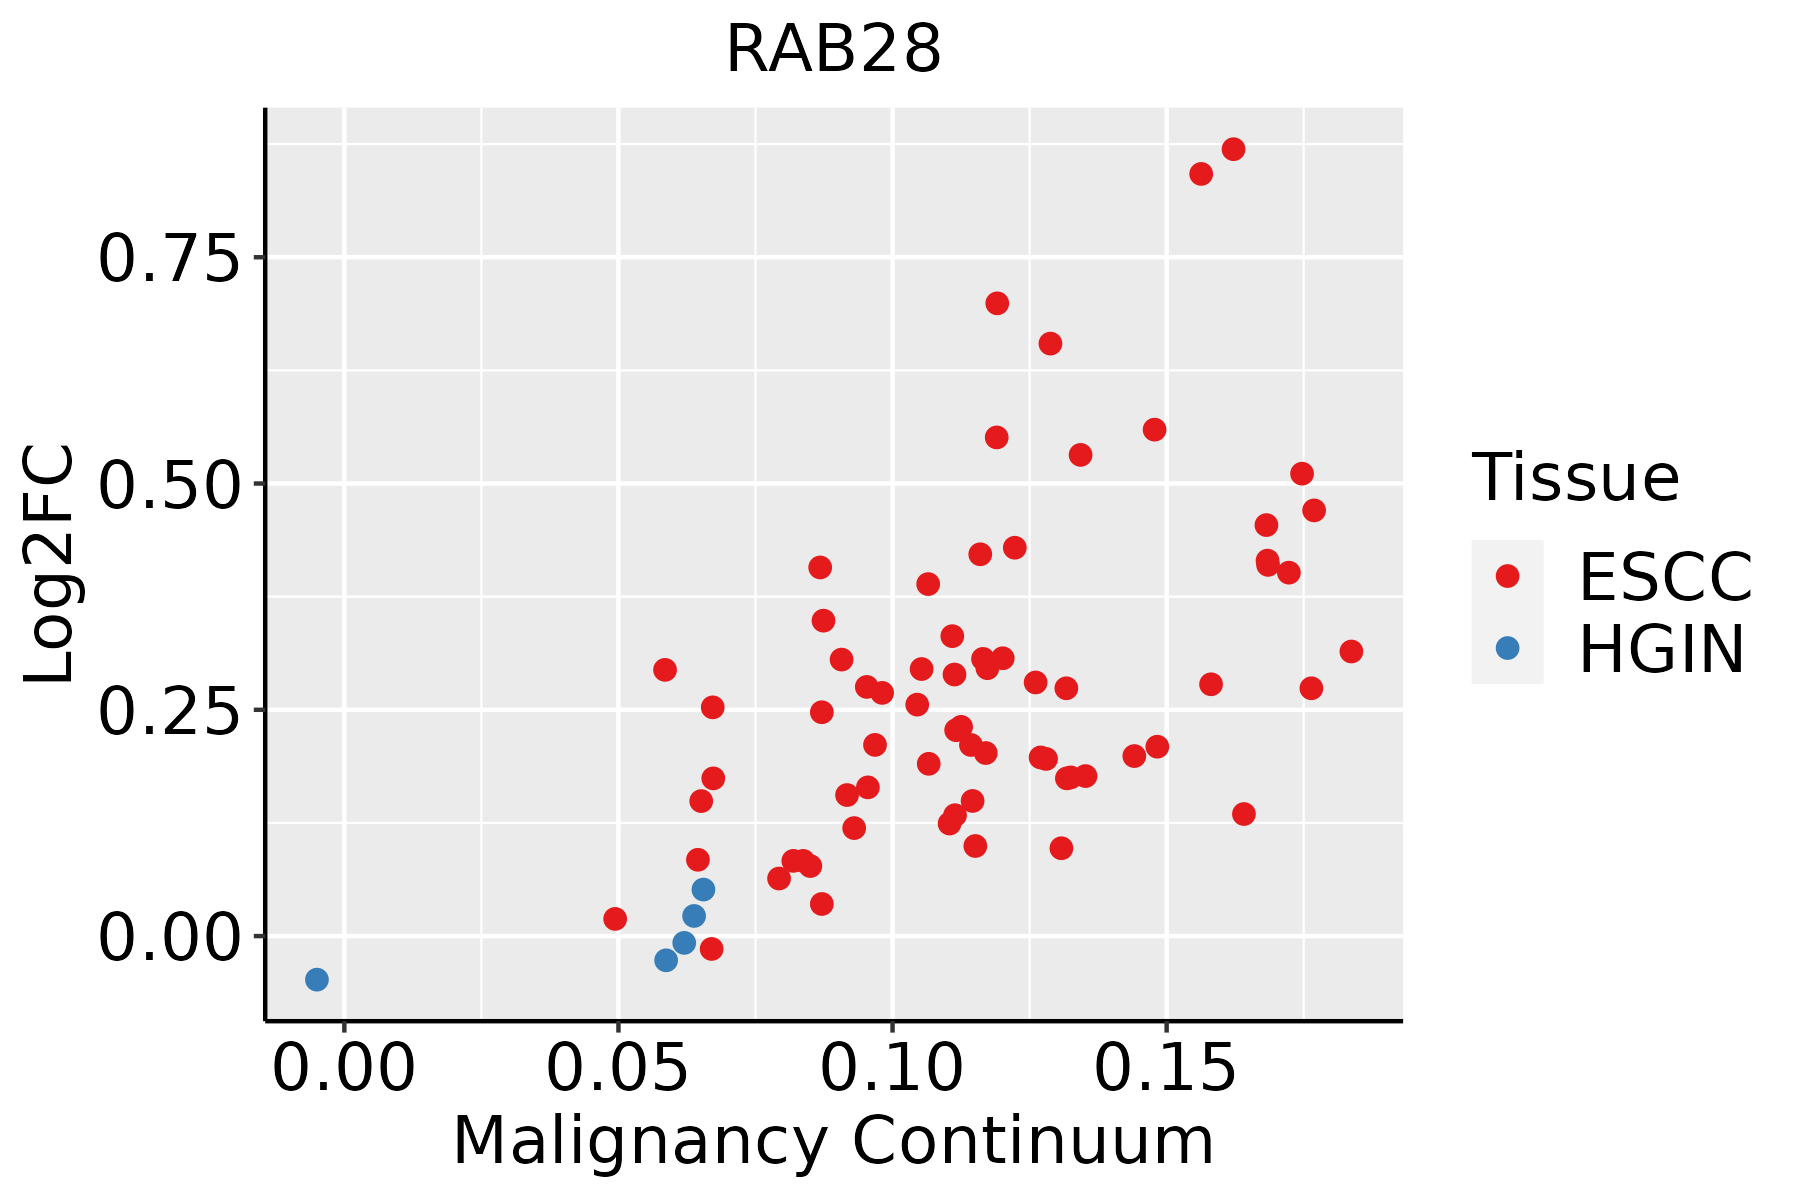 | ESCC: Esophageal squamous cell carcinoma |
| HGIN: High-grade intraepithelial neoplasias | ||
| LGIN: Low-grade intraepithelial neoplasias | ||
| Oral Cavity |  | EOLP: Erosive Oral lichen planus |
| LP: leukoplakia | ||
| NEOLP: Non-erosive oral lichen planus | ||
| OSCC: Oral squamous cell carcinoma |
| ∗log2FC in expression of this searched gene in stem-like cells from each diseased tissue sample relative to stem-like cells in normal samples in each tissue plotted against the malignancy continuum. Samples are colored based on if they are from different disease stage. |
Top |
Malignant transformation related pathway analysis |
| Find out the enriched GO biological processes and KEGG pathways involved in transition from healthy to precancer to cancer |
| Tissue | Disease Stage | Enriched GO biological Processes |
| Colorectum | AD |  |
| Colorectum | SER |  |
| Colorectum | MSS |  |
| Colorectum | MSI-H |  |
| Colorectum | FAP |  |
| ∗Top 15 enriched GO BP terms are showed in the bar plot of each disease state in each tissue. Each row represents a significant GO biological process which is colored according to the -log10(p.adjust). |
| Page: 1 2 3 4 5 6 7 8 9 |
| GO ID | Tissue | Disease Stage | Description | Gene Ratio | Bg Ratio | pvalue | p.adjust | Count |
| GO:19019987 | Esophagus | ESCC | toxin transport | 28/8552 | 40/18723 | 1.61e-03 | 7.50e-03 | 28 |
| GO:19019986 | Oral cavity | OSCC | toxin transport | 25/7305 | 40/18723 | 2.22e-03 | 1.00e-02 | 25 |
| Page: 1 |
| Pathway ID | Tissue | Disease Stage | Description | Gene Ratio | Bg Ratio | pvalue | p.adjust | qvalue | Count |
| Page: 1 |
Top |
Cell-cell communication analysis |
| Identification of potential cell-cell interactions between two cell types and their ligand-receptor pairs for different disease states |
| Ligand | Receptor | LRpair | Pathway | Tissue | Disease Stage |
| Page: 1 |
Top |
Single-cell gene regulatory network inference analysis |
| Find out the significant the regulons (TFs) and the target genes of each regulon across cell types for different disease states |
| TF | Cell Type | Tissue | Disease Stage | Target Gene | RSS | Regulon Activity |
| ∗The dot plots of a searched regulon are shown for all cell subpopulations in each disease state of each tissue based on the regulon specific score inferred using pySCENIC and by calculating the average expression. |
| Page: 1 |
Top |
Somatic mutation of malignant transformation related genes |
| Annotation of somatic variants for genes involved in malignant transformation |
| Hugo Symbol | Variant Class | Variant Classification | dbSNP RS | HGVSc | HGVSp | HGVSp Short | SWISSPROT | BIOTYPE | SIFT | PolyPhen | Tumor Sample Barcode | Tissue | Histology | Sex | Age | Stage | Therapy Types | Drugs | Outcome |
| RAB28 | SNV | Missense_Mutation | c.476N>T | p.Ser159Leu | p.S159L | P51157 | protein_coding | deleterious(0) | probably_damaging(0.999) | TCGA-A8-A092-01 | Breast | breast invasive carcinoma | Female | <65 | III/IV | Chemotherapy | paclitaxel | CR | |
| RAB28 | SNV | Missense_Mutation | c.304N>C | p.Glu102Gln | p.E102Q | P51157 | protein_coding | tolerated(0.21) | benign(0.091) | TCGA-IR-A3LK-01 | Cervix | cervical & endocervical cancer | Female | >=65 | I/II | Chemotherapy | cisplatin | PD | |
| RAB28 | SNV | Missense_Mutation | rs746466147 | c.651G>A | p.Met217Ile | p.M217I | P51157 | protein_coding | tolerated(0.67) | benign(0) | TCGA-F4-6856-01 | Colorectum | colon adenocarcinoma | Male | <65 | I/II | Ancillary | leucovorin | CR |
| RAB28 | SNV | Missense_Mutation | c.306N>T | p.Glu102Asp | p.E102D | P51157 | protein_coding | tolerated(0.08) | benign(0.007) | TCGA-AG-A002-01 | Colorectum | rectum adenocarcinoma | Male | <65 | I/II | Unknown | Unknown | SD | |
| RAB28 | deletion | Frame_Shift_Del | c.433_436delNNNN | p.Leu145GlyfsTer37 | p.L145Gfs*37 | P51157 | protein_coding | TCGA-AA-A022-01 | Colorectum | colon adenocarcinoma | Female | >=65 | I/II | Unknown | Unknown | SD | |||
| RAB28 | deletion | Frame_Shift_Del | c.433_436delNNNN | p.Leu145GlyfsTer37 | p.L145Gfs*37 | P51157 | protein_coding | TCGA-D5-6898-01 | Colorectum | colon adenocarcinoma | Female | <65 | I/II | Unknown | Unknown | SD | |||
| RAB28 | SNV | Missense_Mutation | c.274G>A | p.Val92Ile | p.V92I | P51157 | protein_coding | tolerated(0.14) | possibly_damaging(0.61) | TCGA-AP-A051-01 | Endometrium | uterine corpus endometrioid carcinoma | Female | >=65 | I/II | Unknown | Unknown | SD | |
| RAB28 | SNV | Missense_Mutation | novel | c.316N>A | p.Asp106Asn | p.D106N | P51157 | protein_coding | deleterious(0.03) | possibly_damaging(0.742) | TCGA-AP-A1DV-01 | Endometrium | uterine corpus endometrioid carcinoma | Female | <65 | I/II | Unknown | Unknown | SD |
| RAB28 | SNV | Missense_Mutation | c.427N>C | p.Lys143Gln | p.K143Q | P51157 | protein_coding | deleterious(0.03) | benign(0.09) | TCGA-AX-A0J0-01 | Endometrium | uterine corpus endometrioid carcinoma | Female | <65 | I/II | Unknown | Unknown | SD | |
| RAB28 | SNV | Missense_Mutation | c.628N>A | p.Val210Ile | p.V210I | P51157 | protein_coding | tolerated(0.27) | benign(0) | TCGA-B5-A11H-01 | Endometrium | uterine corpus endometrioid carcinoma | Female | >=65 | III/IV | Hormone Therapy | megace | SD |
| Page: 1 2 3 |
Top |
Related drugs of malignant transformation related genes |
| Identification of chemicals and drugs interact with genes involved in malignant transfromation |
| (DGIdb 4.0) |
| Entrez ID | Symbol | Category | Interaction Types | Drug Claim Name | Drug Name | PMIDs |
| Page: 1 |

Copyright 2023-Present -The University of Texas Health Science Center at Houston |