Schematic overview of the cellular and molecular mechanisms involved in the cancer progression, including the proposed cellular and molecular mechanisms in cancer cells trajectory. AT1: alveolar type 1 cells; AT2: alveolar type 2 cells; AAH: atypical adenomatous hyperplasia; AIS: adenocarcinoma in situ; MIA: minimally invasive adenocarcinoma; IA: invasive adenocarcinoma; EMT: epithelial-mesenchymal transition

Home

Download

Statistics

Help

Contact

Center for Computational Systems Medicine
leaf

Gene summary

leaf

Malignant transformation analysis

leaf

Malignant transformation related pathway analysis

leaf

Cell-cell communication analysis

leaf

Single-cell gene regulatory network inference analysis

leaf

Somatic mutation of malignant transformation related genes

leaf

Related drugs of malignant transformation related genes

Gene: RAB25

Gene summary for RAB25

check button Gene summary.

Gene informationSpeciesHuman
Gene symbol

RAB25

Gene ID

57111

Gene nameRAB25, member RAS oncogene family
Gene AliasCATX-8
Cytomap1q22
Gene Typeprotein-coding
GO ID

GO:0000902

UniProtAcc

P57735


Top

Malignant transformation analysis

check button Identification of the aberrant gene expression in precancerous and cancerous lesions by comparing the gene expression of stem-like cells in diseased tissues with normal stem cells
check button Malignant transformation involving gene list.
Entrez IDSymbolReplicatesSpeciesOrganTissueAdj P-valueLog2FCMalignancy
57111RAB25GSM4909285HumanBreastIDC2.16e-073.86e-010.21
57111RAB25GSM4909286HumanBreastIDC3.87e-02-1.41e-010.1081
57111RAB25GSM4909293HumanBreastIDC3.24e-022.65e-010.1581
57111RAB25GSM4909296HumanBreastIDC5.87e-075.39e-020.1524
57111RAB25GSM4909297HumanBreastIDC2.55e-14-1.70e-010.1517
57111RAB25GSM4909298HumanBreastIDC5.85e-032.07e-010.1551
57111RAB25GSM4909301HumanBreastIDC1.16e-06-2.67e-010.1577
57111RAB25GSM4909311HumanBreastIDC5.39e-25-1.56e-010.1534
57111RAB25GSM4909312HumanBreastIDC4.48e-117.57e-020.1552
57111RAB25GSM4909315HumanBreastIDC1.71e-064.02e-010.21
57111RAB25GSM4909316HumanBreastIDC5.99e-145.55e-010.21
57111RAB25GSM4909317HumanBreastIDC1.77e-033.18e-010.1355
57111RAB25GSM4909318HumanBreastIDC9.45e-032.93e-010.2031
57111RAB25GSM4909319HumanBreastIDC3.93e-40-1.63e-010.1563
57111RAB25GSM4909320HumanBreastIDC6.73e-06-6.66e-020.1575
57111RAB25GSM4909321HumanBreastIDC5.98e-156.20e-020.1559
57111RAB25M2HumanBreastIDC1.42e-053.79e-010.21
57111RAB25NCCBC11HumanBreastDCIS1.73e-083.81e-010.1232
57111RAB25NCCBC14HumanBreastDCIS2.01e-274.81e-010.2021
57111RAB25NCCBC5HumanBreastDCIS1.32e-07-1.67e-010.2046
Page: 1 2 3 4 5 6 7 8 9 10 

check button Transcriptomic changes along malignancy continuum.
TissueExpression DynamicsAbbreviation
BreastThe image shows the transcriptomic changes along malignancy continuum.log2FC in expression of this searched gene in stem-like cells from each diseased tissue sample relative to stem-like cells in normal samples in each tissue plotted against the malignancy continuum. Samples are colored based on if they are from different disease stage.IDC: Invasive ductal carcinoma
DCIS: Ductal carcinoma in situ
Precancer(BRCA1-mut): Precancerous lesion from BRCA1 mutation carriers
Colorectum (GSE201348)The image shows the transcriptomic changes along malignancy continuum.log2FC in expression of this searched gene in stem-like cells from each diseased tissue sample relative to stem-like cells in normal samples in each tissue plotted against the malignancy continuum. Samples are colored based on if they are from different disease stage.FAP: Familial adenomatous polyposis
CRC: Colorectal cancer
Colorectum (HTA11)The image shows the transcriptomic changes along malignancy continuum.log2FC in expression of this searched gene in stem-like cells from each diseased tissue sample relative to stem-like cells in normal samples in each tissue plotted against the malignancy continuum. Samples are colored based on if they are from different disease stage.AD: Adenomas
SER: Sessile serrated lesions
MSI-H: Microsatellite-high colorectal cancer
MSS: Microsatellite stable colorectal cancer
EsophagusThe image shows the transcriptomic changes along malignancy continuum.log2FC in expression of this searched gene in stem-like cells from each diseased tissue sample relative to stem-like cells in normal samples in each tissue plotted against the malignancy continuum. Samples are colored based on if they are from different disease stage.
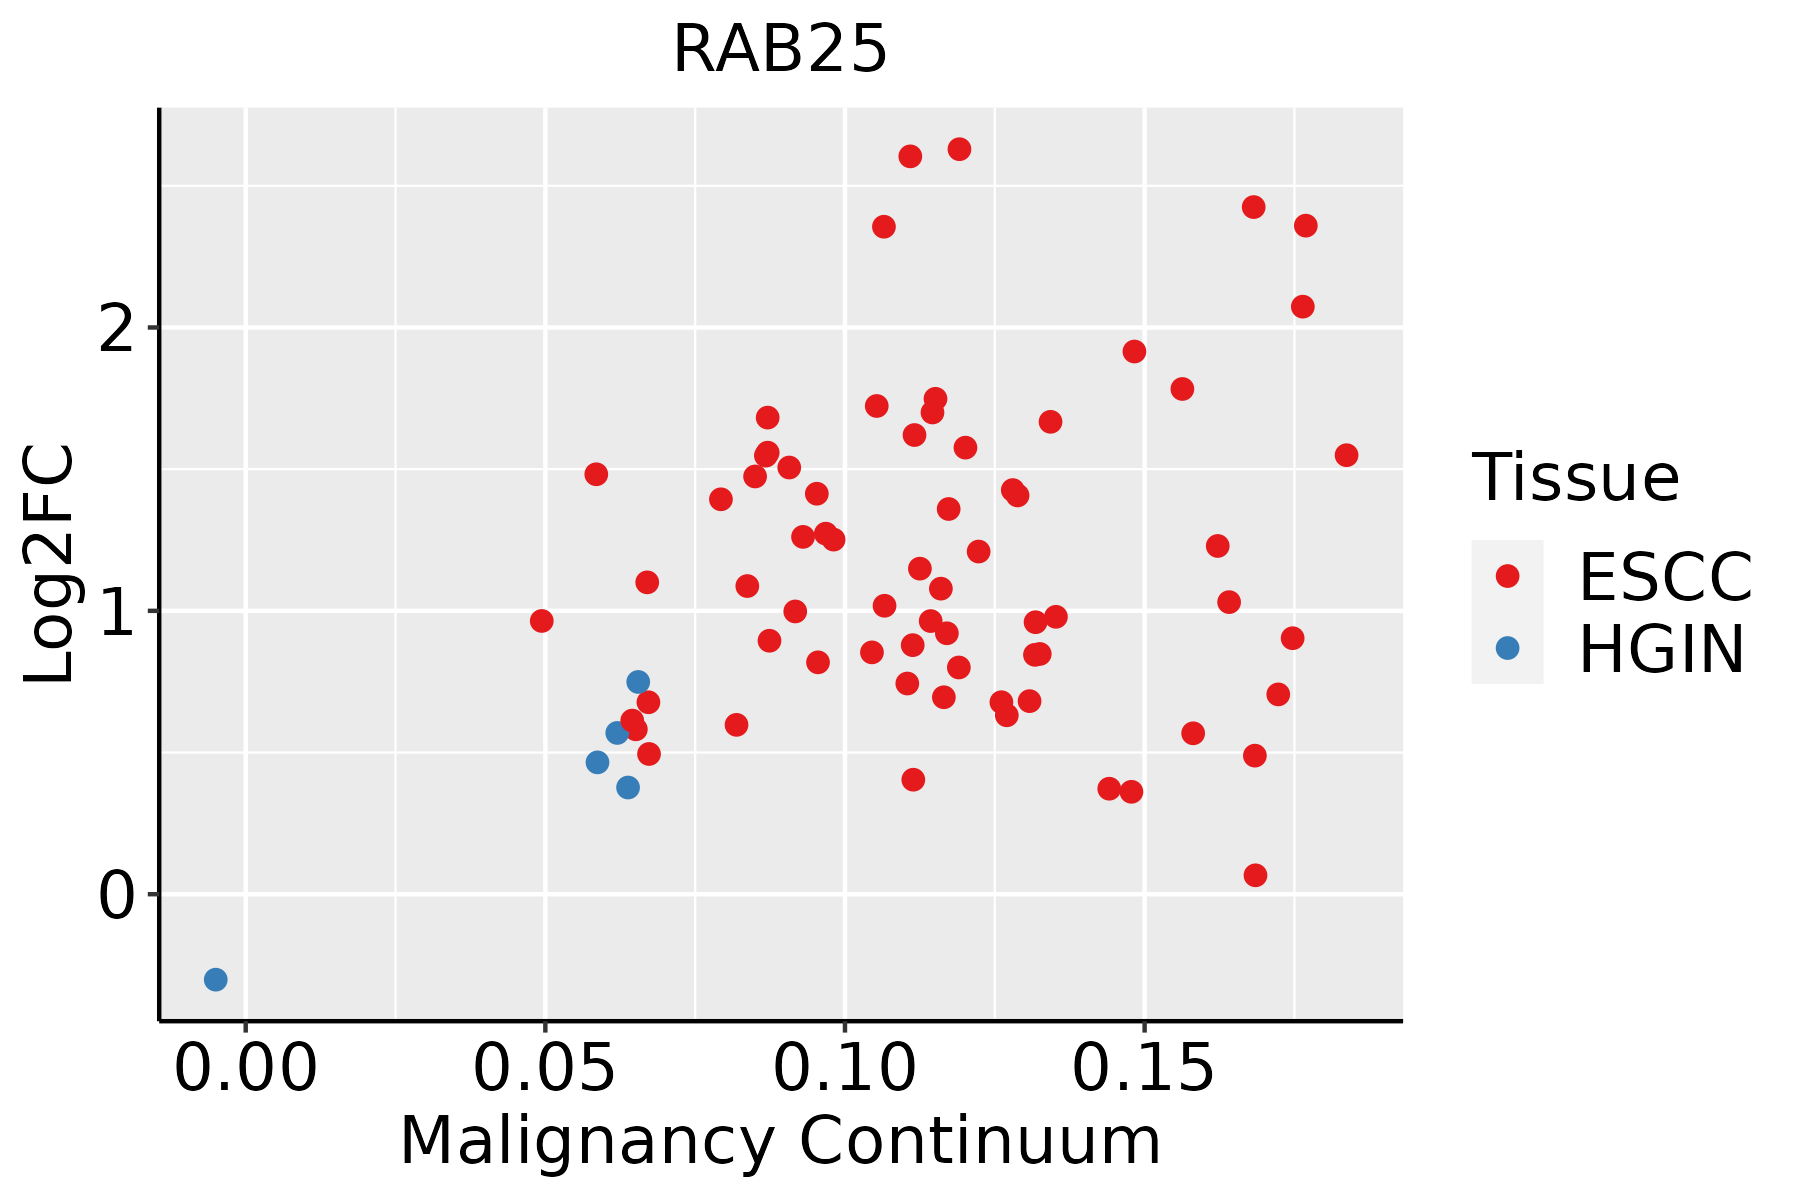
ESCC: Esophageal squamous cell carcinoma
HGIN: High-grade intraepithelial neoplasias
LGIN: Low-grade intraepithelial neoplasias
GCThe image shows the transcriptomic changes along malignancy continuum.log2FC in expression of this searched gene in stem-like cells from each diseased tissue sample relative to stem-like cells in normal samples in each tissue plotted against the malignancy continuum. Samples are colored based on if they are from different disease stage.
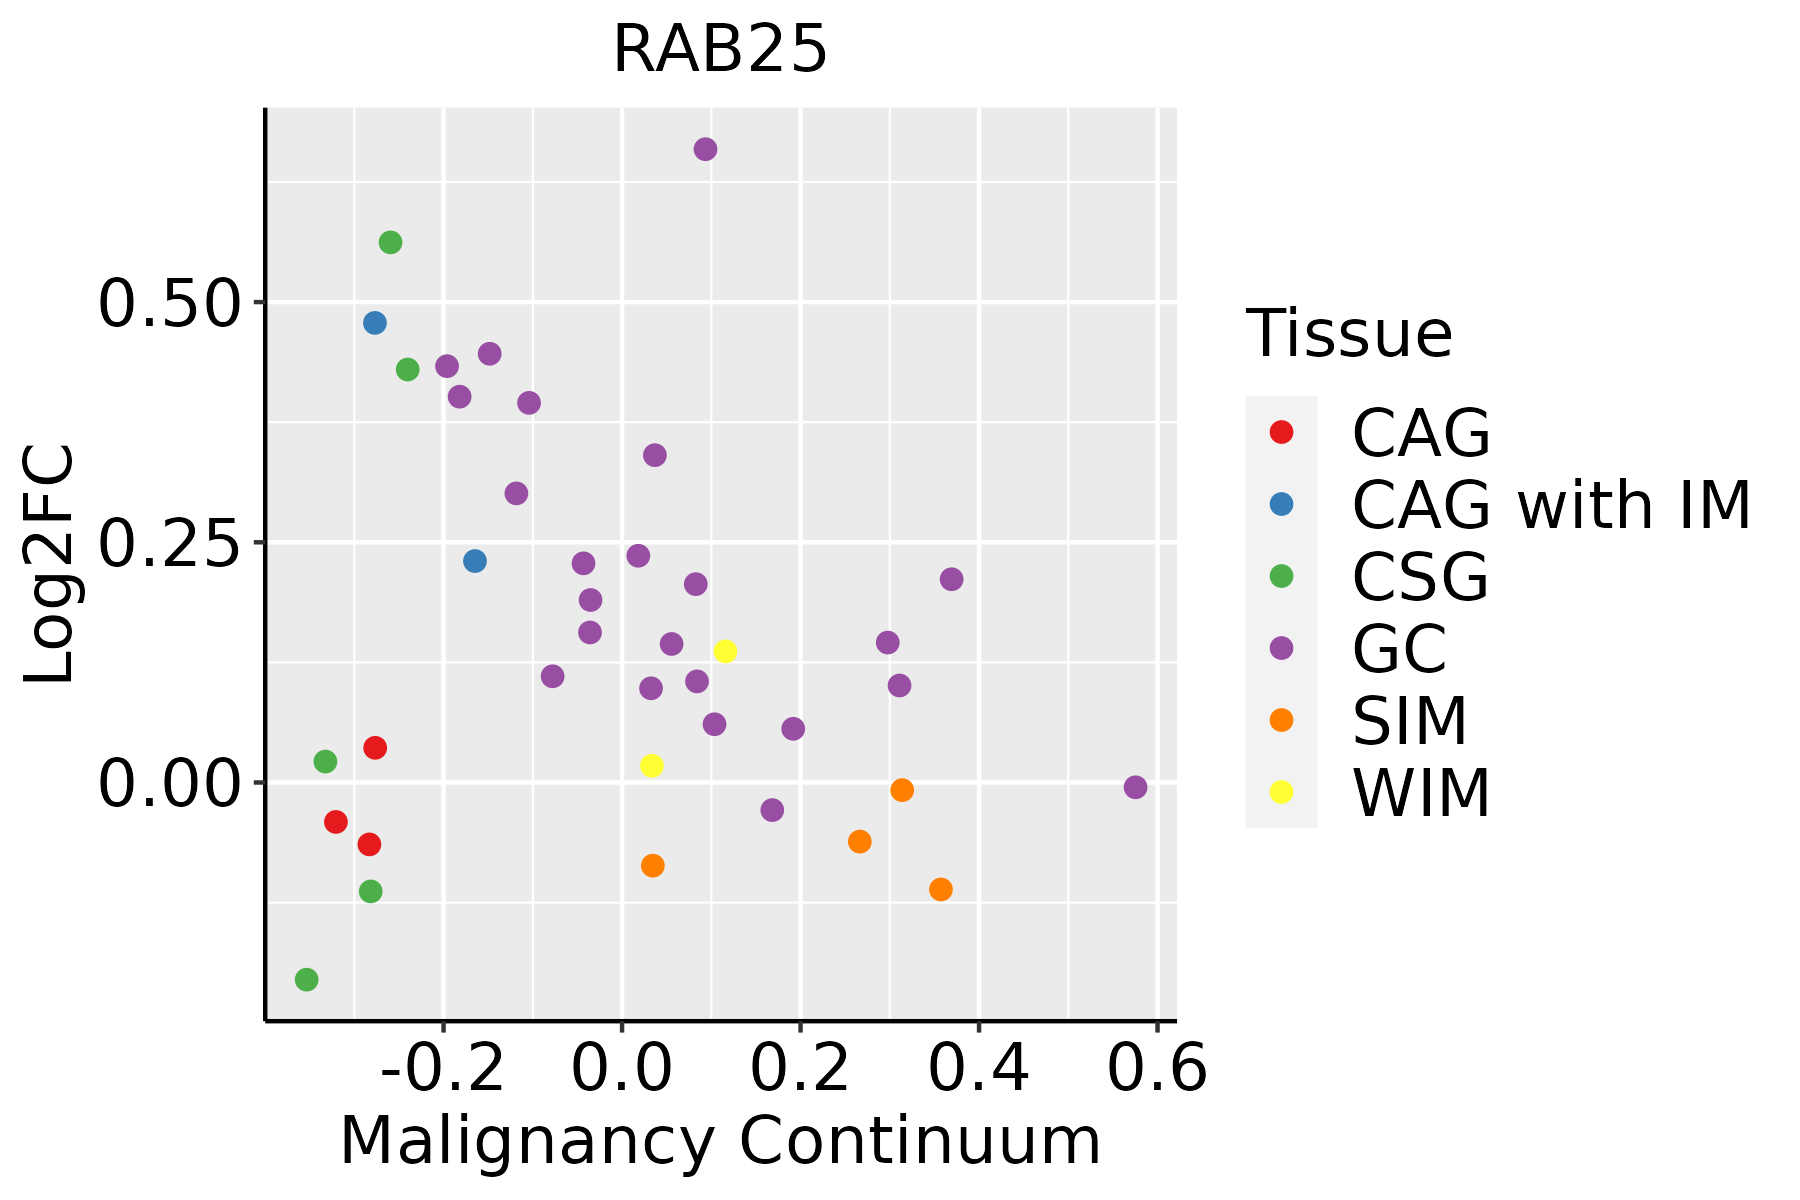
CAG: Chronic atrophic gastritis
CAG with IM: Chronic atrophic gastritis with intestinal metaplasia
CSG: Chronic superficial gastritis
GC: Gastric cancer
SIM: Severe intestinal metaplasia
WIM: Wild intestinal metaplasia
Oral CavityThe image shows the transcriptomic changes along malignancy continuum.log2FC in expression of this searched gene in stem-like cells from each diseased tissue sample relative to stem-like cells in normal samples in each tissue plotted against the malignancy continuum. Samples are colored based on if they are from different disease stage.EOLP: Erosive Oral lichen planus
LP: leukoplakia
NEOLP: Non-erosive oral lichen planus
OSCC: Oral squamous cell carcinoma
ProstateThe image shows the transcriptomic changes along malignancy continuum.log2FC in expression of this searched gene in stem-like cells from each diseased tissue sample relative to stem-like cells in normal samples in each tissue plotted against the malignancy continuum. Samples are colored based on if they are from different disease stage.BPH: Benign Prostatic Hyperplasia
SkinThe image shows the transcriptomic changes along malignancy continuum.log2FC in expression of this searched gene in stem-like cells from each diseased tissue sample relative to stem-like cells in normal samples in each tissue plotted against the malignancy continuum. Samples are colored based on if they are from different disease stage.AK: Actinic keratosis
cSCC: Cutaneous squamous cell carcinoma
SCCIS:squamous cell carcinoma in situ
ThyroidThe image shows the transcriptomic changes along malignancy continuum.log2FC in expression of this searched gene in stem-like cells from each diseased tissue sample relative to stem-like cells in normal samples in each tissue plotted against the malignancy continuum. Samples are colored based on if they are from different disease stage.
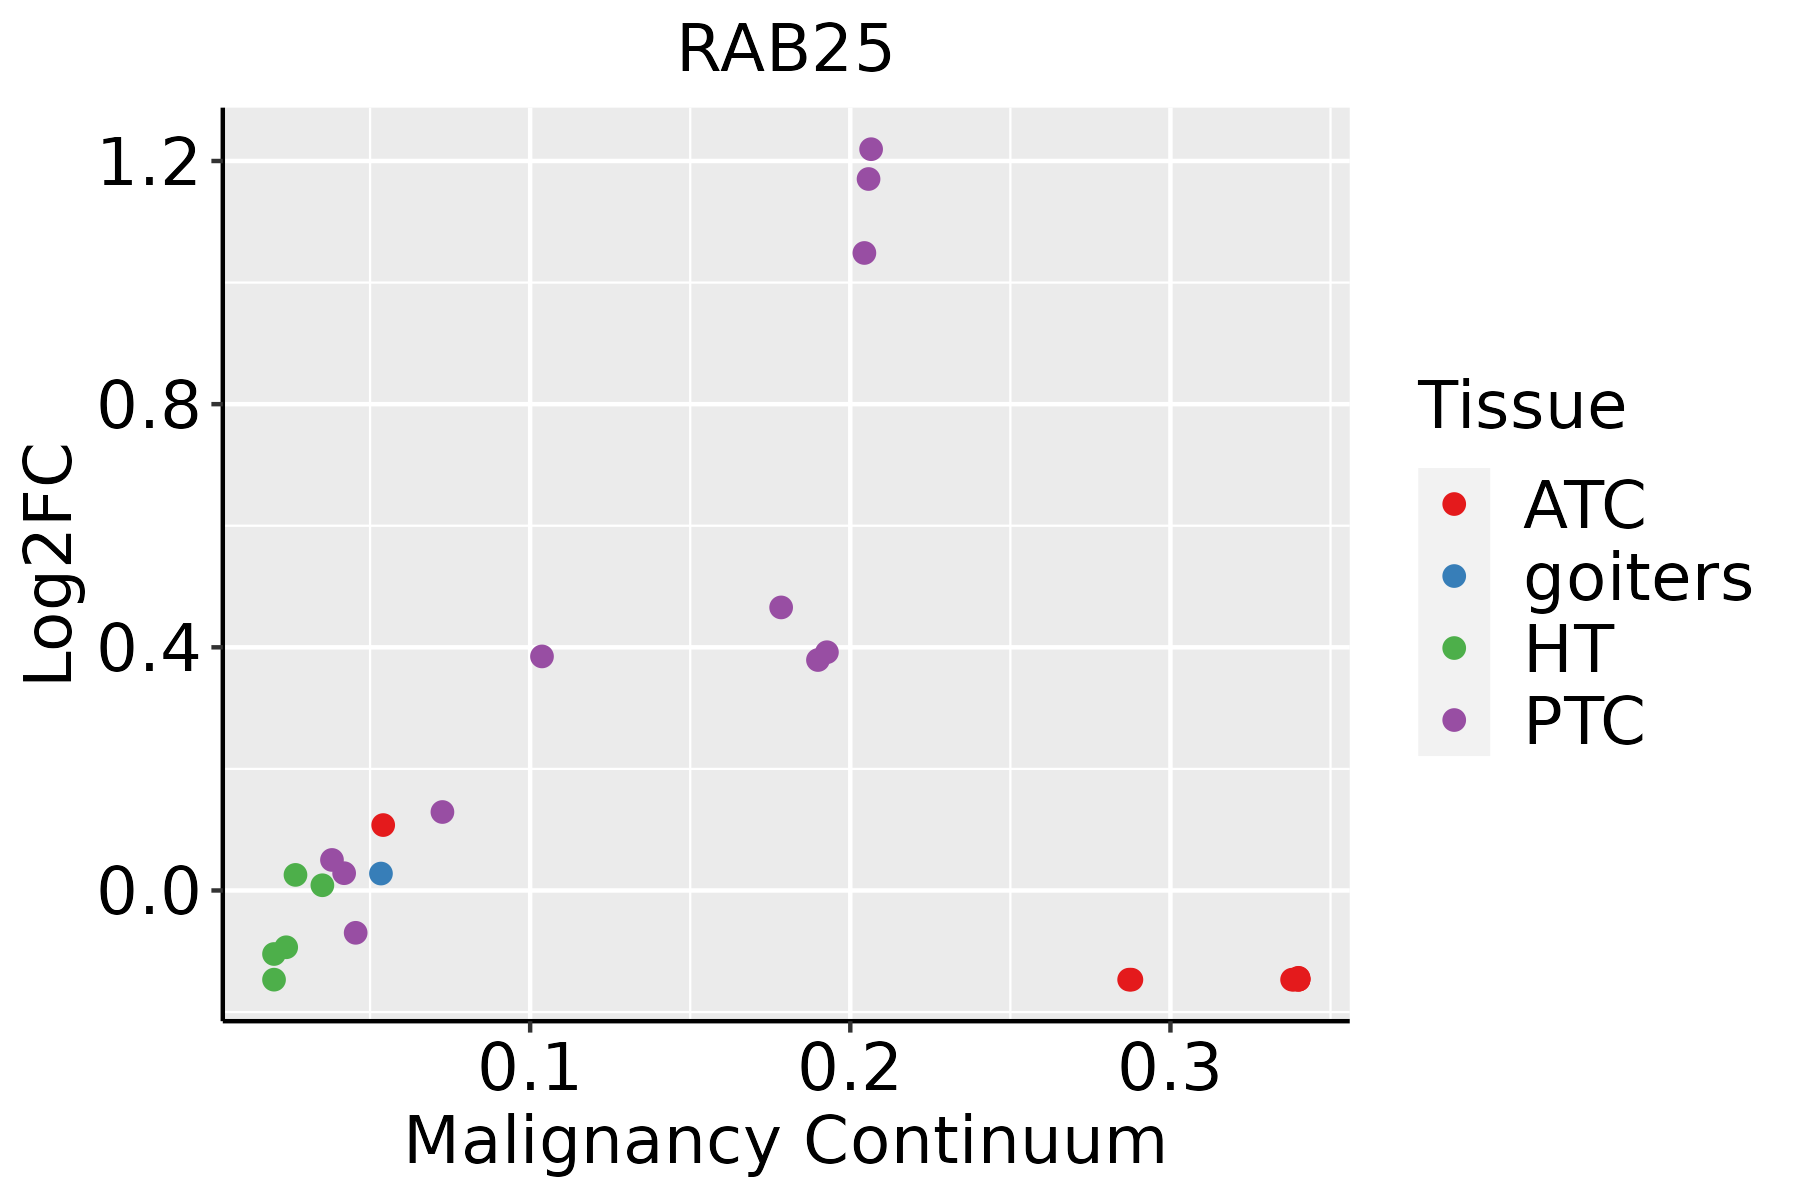
ATC: Anaplastic thyroid cancer
HT: Hashimoto's thyroiditis
PTC: Papillary thyroid cancer
∗log2FC in expression of this searched gene in stem-like cells from each diseased tissue sample relative to stem-like cells in normal samples in each tissue plotted against the malignancy continuum. Samples are colored based on if they are from different disease stage.

Top

Malignant transformation related pathway analysis

check buttonFind out the enriched GO biological processes and KEGG pathways involved in transition from healthy to precancer to cancer
check button Figure of enriched GO biological processes.
TissueDisease StageEnriched GO biological Processes
ColorectumADGO analysis - Figure of enriched GO biological processes: Top 15 enriched GO BP terms are showed in the bar plot of each disease state in each tissue. Each row represents a significant GO biological process which is colored according to the -log10(p.adjust).
ColorectumSERGO analysis - Figure of enriched GO biological processes: Top 15 enriched GO BP terms are showed in the bar plot of each disease state in each tissue. Each row represents a significant GO biological process which is colored according to the -log10(p.adjust).
ColorectumMSSGO analysis - Figure of enriched GO biological processes: Top 15 enriched GO BP terms are showed in the bar plot of each disease state in each tissue. Each row represents a significant GO biological process which is colored according to the -log10(p.adjust).
ColorectumMSI-HGO analysis - Figure of enriched GO biological processes: Top 15 enriched GO BP terms are showed in the bar plot of each disease state in each tissue. Each row represents a significant GO biological process which is colored according to the -log10(p.adjust).
ColorectumFAPGO analysis - Figure of enriched GO biological processes: Top 15 enriched GO BP terms are showed in the bar plot of each disease state in each tissue. Each row represents a significant GO biological process which is colored according to the -log10(p.adjust).
∗Top 15 enriched GO BP terms are showed in the bar plot of each disease state in each tissue. Each row represents a significant GO biological process which is colored according to the -log10(p.adjust).
Page: 1 2 3 4 5 6 7 8 9 

check button Enriched GO biological processes.
GO IDTissueDisease StageDescriptionGene RatioBg Ratiopvaluep.adjustCount
GO:000166714BreastIDCameboidal-type cell migration64/1434475/187236.65e-062.05e-0464
GO:001063112BreastIDCepithelial cell migration51/1434357/187231.14e-053.08e-0451
GO:009013212BreastIDCepithelium migration51/1434360/187231.44e-053.70e-0451
GO:009013012BreastIDCtissue migration51/1434365/187232.11e-055.11e-0451
GO:001063212BreastIDCregulation of epithelial cell migration43/1434292/187232.61e-056.17e-0443
GO:001063413BreastIDCpositive regulation of epithelial cell migration30/1434176/187232.76e-056.50e-0430
GO:000206414BreastIDCepithelial cell development28/1434220/187235.53e-034.05e-0228
GO:001063121BreastDCISepithelial cell migration51/1390357/187234.83e-061.43e-0451
GO:009013221BreastDCISepithelium migration51/1390360/187236.14e-061.75e-0451
GO:009013021BreastDCIStissue migration51/1390365/187239.09e-062.45e-0451
GO:000166723BreastDCISameboidal-type cell migration62/1390475/187239.60e-062.56e-0462
GO:001063221BreastDCISregulation of epithelial cell migration43/1390292/187231.23e-053.13e-0443
GO:001063422BreastDCISpositive regulation of epithelial cell migration30/1390176/187231.53e-053.75e-0430
GO:0002064ColorectumADepithelial cell development89/3918220/187232.98e-113.52e-0989
GO:0001667ColorectumADameboidal-type cell migration137/3918475/187232.17e-054.33e-04137
GO:0090132ColorectumADepithelium migration105/3918360/187231.18e-041.73e-03105
GO:0010632ColorectumADregulation of epithelial cell migration88/3918292/187231.19e-041.75e-0388
GO:0010631ColorectumADepithelial cell migration104/3918357/187231.33e-041.90e-03104
GO:0090130ColorectumADtissue migration105/3918365/187232.10e-042.77e-03105
GO:0010634ColorectumADpositive regulation of epithelial cell migration56/3918176/187234.51e-045.03e-0356
Page: 1 2 3 4 5 6 

check button Enriched KEGG pathways.
Pathway IDTissueDisease StageDescriptionGene RatioBg Ratiopvaluep.adjustqvalueCount
Page: 1 

Top

Cell-cell communication analysis

check buttonIdentification of potential cell-cell interactions between two cell types and their ligand-receptor pairs for different disease states
LigandReceptorLRpairPathwayTissueDisease Stage
Page: 1 

Top

Single-cell gene regulatory network inference analysis

check buttonFind out the significant the regulons (TFs) and the target genes of each regulon across cell types for different disease states
TFCell TypeTissueDisease StageTarget GeneRSSRegulon Activity
∗The dot plots of a searched regulon are shown for all cell subpopulations in each disease state of each tissue based on the regulon specific score inferred using pySCENIC and by calculating the average expression.
Page: 1 

Top

Somatic mutation of malignant transformation related genes

check buttonAnnotation of somatic variants for genes involved in malignant transformation
Hugo SymbolVariant ClassVariant ClassificationdbSNP RSHGVScHGVSpHGVSp ShortSWISSPROTBIOTYPESIFTPolyPhenTumor Sample BarcodeTissueHistologySexAgeStageTherapy TypesDrugsOutcome
RAB25SNVMissense_Mutationc.363G>Ap.Met121Ilep.M121IP57735protein_codingdeleterious_low_confidence(0.03)probably_damaging(0.978)TCGA-A8-A07W-01Breastbreast invasive carcinomaFemale>=65III/IVHormone TherapyexemestaneSD
RAB25SNVMissense_Mutationc.262G>Ap.Ala88Thrp.A88TP57735protein_codingdeleterious_low_confidence(0)probably_damaging(0.998)TCGA-BH-A0B1-01Breastbreast invasive carcinomaFemale>=65I/IIChemotherapyadriamycinSD
RAB25SNVMissense_Mutationrs368546153c.358G>Ap.Val120Ilep.V120IP57735protein_codingtolerated_low_confidence(1)probably_damaging(0.985)TCGA-2W-A8YY-01Cervixcervical & endocervical cancerFemale<65I/IIChemotherapycisplatinCR
RAB25SNVMissense_Mutationc.70N>Ap.Gly24Argp.G24RP57735protein_codingdeleterious_low_confidence(0)probably_damaging(1)TCGA-AA-3875-01Colorectumcolon adenocarcinomaFemale>=65I/IIUnknownUnknownSD
RAB25SNVMissense_Mutationc.393N>Tp.Gln131Hisp.Q131HP57735protein_codingtolerated_low_confidence(1)benign(0)TCGA-AA-3952-01Colorectumcolon adenocarcinomaMale>=65III/IVUnknownUnknownPD
RAB25SNVMissense_Mutationrs566252037c.92N>Ap.Arg31Glnp.R31QP57735protein_codingdeleterious_low_confidence(0)probably_damaging(0.997)TCGA-G4-6298-01Colorectumcolon adenocarcinomaMale>=65III/IVChemotherapyirinotecanPD
RAB25SNVMissense_Mutationc.142G>Cp.Glu48Glnp.E48QP57735protein_codingdeleterious_low_confidence(0)probably_damaging(0.997)TCGA-AF-3913-01Colorectumrectum adenocarcinomaMale<65III/IVChemotherapyxelodaPD
RAB25SNVMissense_Mutationnovelc.469N>Ap.Leu157Metp.L157MP57735protein_codingdeleterious_low_confidence(0.03)probably_damaging(0.998)TCGA-A5-A0G1-01Endometriumuterine corpus endometrioid carcinomaFemale>=65I/IIUnknownUnknownSD
RAB25SNVMissense_Mutationnovelc.130A>Gp.Thr44Alap.T44AP57735protein_codingdeleterious_low_confidence(0)probably_damaging(0.963)TCGA-A5-A1OF-01Endometriumuterine corpus endometrioid carcinomaFemale<65I/IIUnknownUnknownSD
RAB25SNVMissense_Mutationnovelc.566C>Tp.Ala189Valp.A189VP57735protein_codingtolerated_low_confidence(0.11)benign(0.019)TCGA-A5-A1OF-01Endometriumuterine corpus endometrioid carcinomaFemale<65I/IIUnknownUnknownSD
Page: 1 2 3 

Top

Related drugs of malignant transformation related genes

check buttonIdentification of chemicals and drugs interact with genes involved in malignant transfromation
(DGIdb 4.0)
Entrez IDSymbolCategoryInteraction TypesDrug Claim NameDrug NamePMIDs
Page: 1