
|
|||||
|
 | |
| |
| |
| |
| |
| |
|
Gene: RAB22A |
Gene summary for RAB22A |
| Gene information | Species | Human | Gene symbol | RAB22A | Gene ID | 57403 |
| Gene name | RAB22A, member RAS oncogene family | |
| Gene Alias | RAB22A | |
| Cytomap | 20q13.32 | |
| Gene Type | protein-coding | GO ID | GO:0006810 | UniProtAcc | Q9UL26 |
Top |
Malignant transformation analysis |
| Identification of the aberrant gene expression in precancerous and cancerous lesions by comparing the gene expression of stem-like cells in diseased tissues with normal stem cells |
| Entrez ID | Symbol | Replicates | Species | Organ | Tissue | Adj P-value | Log2FC | Malignancy |
| 57403 | RAB22A | LZE4T | Human | Esophagus | ESCC | 1.77e-04 | 2.29e-02 | 0.0811 |
| 57403 | RAB22A | LZE8T | Human | Esophagus | ESCC | 2.12e-02 | -2.68e-02 | 0.067 |
| 57403 | RAB22A | LZE24T | Human | Esophagus | ESCC | 5.12e-14 | 3.74e-01 | 0.0596 |
| 57403 | RAB22A | P1T-E | Human | Esophagus | ESCC | 1.16e-04 | 3.81e-01 | 0.0875 |
| 57403 | RAB22A | P2T-E | Human | Esophagus | ESCC | 5.23e-30 | 7.30e-01 | 0.1177 |
| 57403 | RAB22A | P4T-E | Human | Esophagus | ESCC | 2.43e-17 | 4.60e-01 | 0.1323 |
| 57403 | RAB22A | P5T-E | Human | Esophagus | ESCC | 5.88e-36 | 7.61e-01 | 0.1327 |
| 57403 | RAB22A | P8T-E | Human | Esophagus | ESCC | 1.27e-13 | 1.18e-01 | 0.0889 |
| 57403 | RAB22A | P9T-E | Human | Esophagus | ESCC | 4.69e-11 | 2.19e-01 | 0.1131 |
| 57403 | RAB22A | P10T-E | Human | Esophagus | ESCC | 7.40e-44 | 8.63e-01 | 0.116 |
| 57403 | RAB22A | P11T-E | Human | Esophagus | ESCC | 1.31e-07 | 5.98e-01 | 0.1426 |
| 57403 | RAB22A | P12T-E | Human | Esophagus | ESCC | 1.06e-14 | 2.67e-01 | 0.1122 |
| 57403 | RAB22A | P15T-E | Human | Esophagus | ESCC | 1.83e-19 | 3.44e-01 | 0.1149 |
| 57403 | RAB22A | P16T-E | Human | Esophagus | ESCC | 8.10e-24 | 3.31e-01 | 0.1153 |
| 57403 | RAB22A | P19T-E | Human | Esophagus | ESCC | 2.96e-02 | 4.38e-01 | 0.1662 |
| 57403 | RAB22A | P20T-E | Human | Esophagus | ESCC | 2.34e-18 | 3.83e-01 | 0.1124 |
| 57403 | RAB22A | P21T-E | Human | Esophagus | ESCC | 7.94e-23 | 4.71e-01 | 0.1617 |
| 57403 | RAB22A | P22T-E | Human | Esophagus | ESCC | 3.79e-28 | 3.71e-01 | 0.1236 |
| 57403 | RAB22A | P23T-E | Human | Esophagus | ESCC | 1.85e-22 | 7.77e-01 | 0.108 |
| 57403 | RAB22A | P24T-E | Human | Esophagus | ESCC | 6.50e-20 | 3.50e-01 | 0.1287 |
| Page: 1 2 3 4 5 6 |
| Tissue | Expression Dynamics | Abbreviation |
| Esophagus | 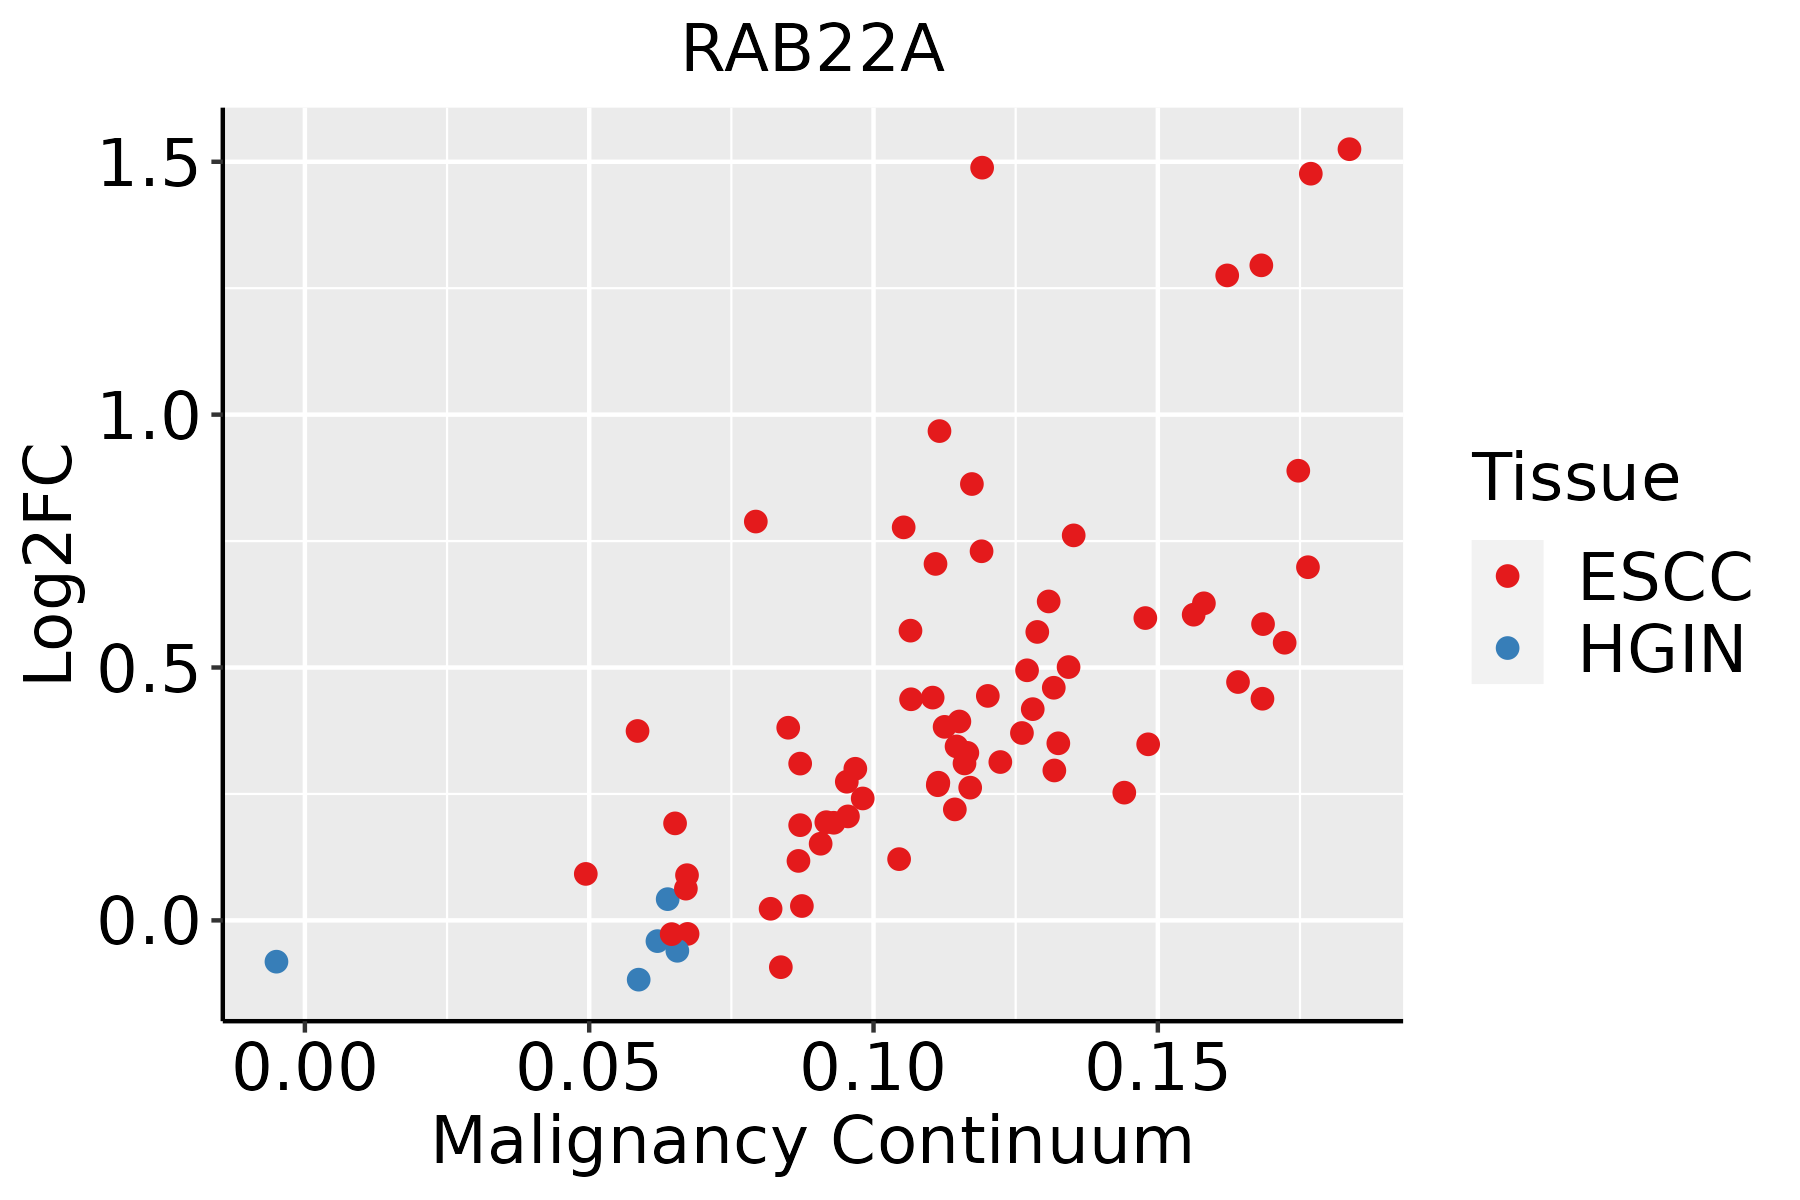 | ESCC: Esophageal squamous cell carcinoma |
| HGIN: High-grade intraepithelial neoplasias | ||
| LGIN: Low-grade intraepithelial neoplasias | ||
| Liver | 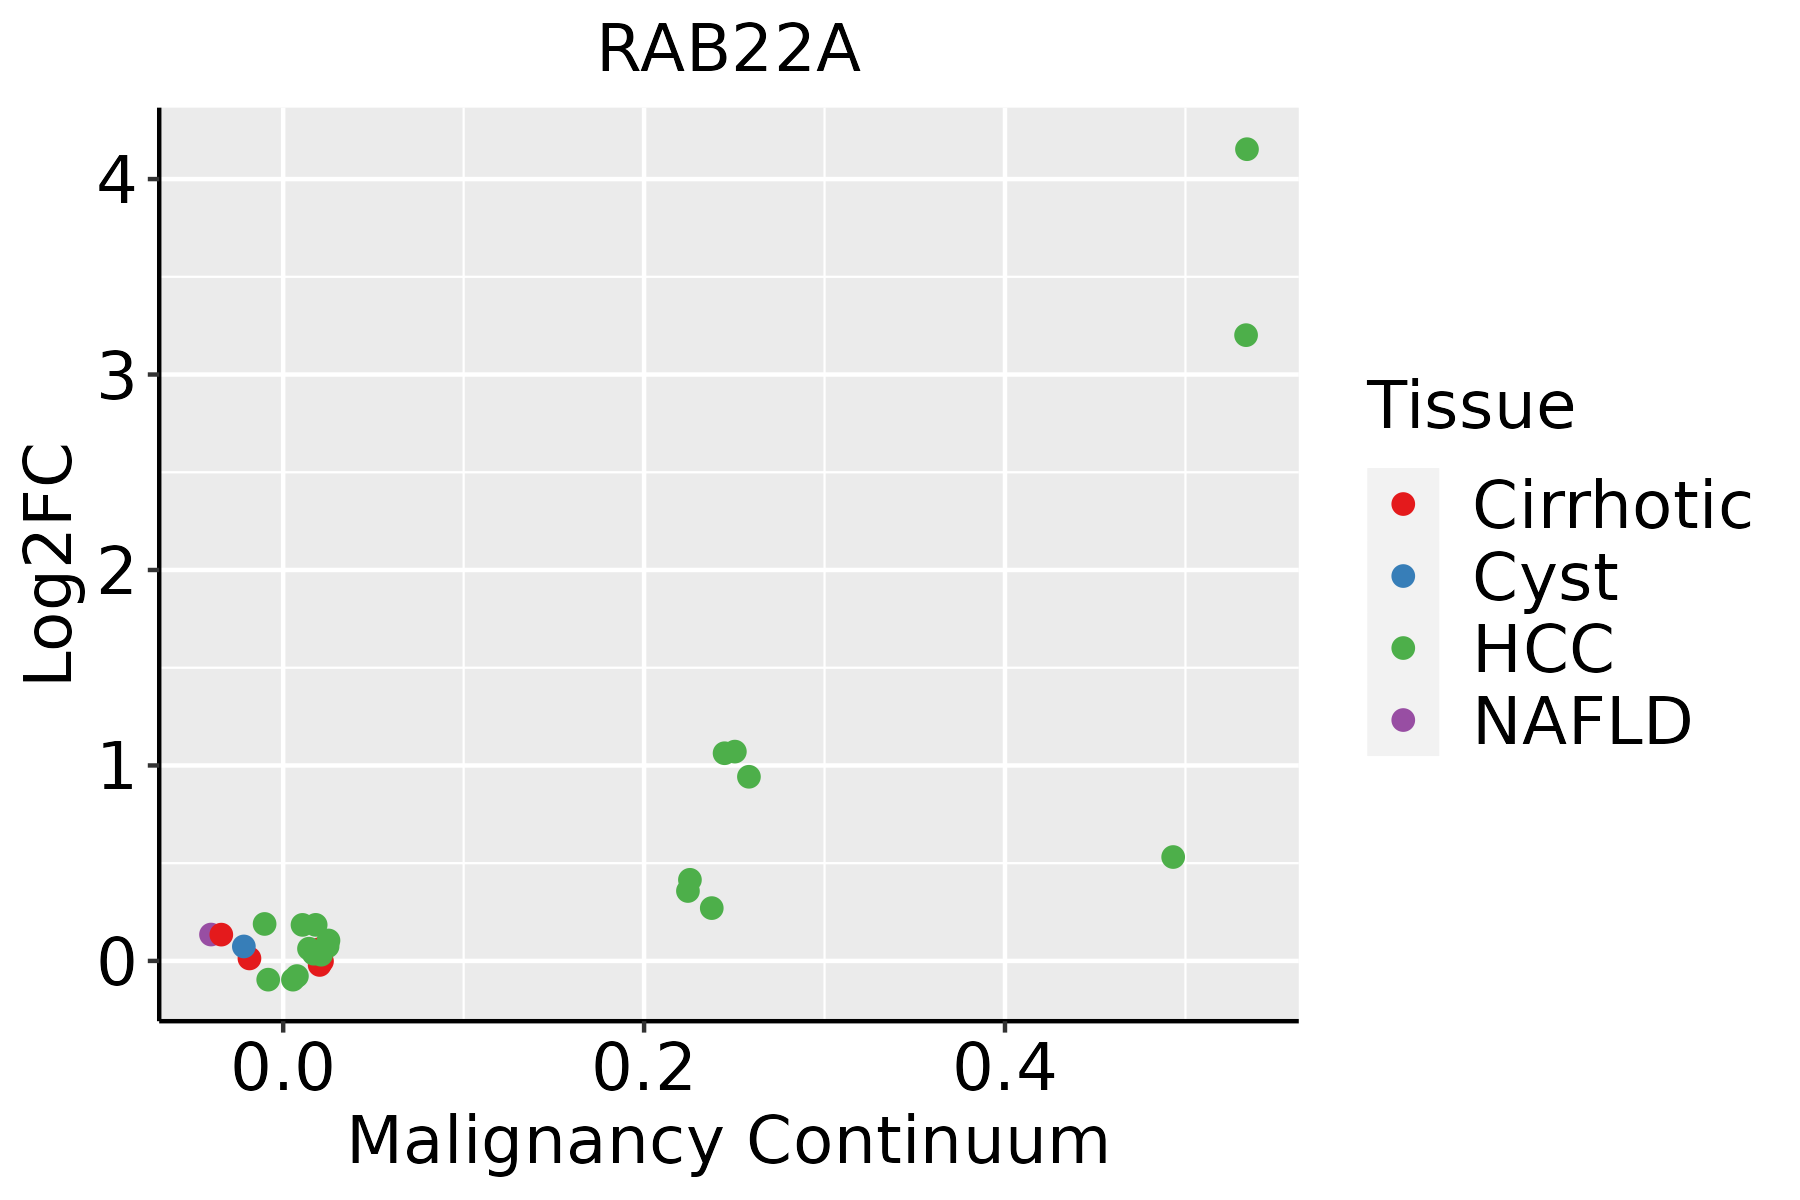 | HCC: Hepatocellular carcinoma |
| NAFLD: Non-alcoholic fatty liver disease | ||
| Oral Cavity | 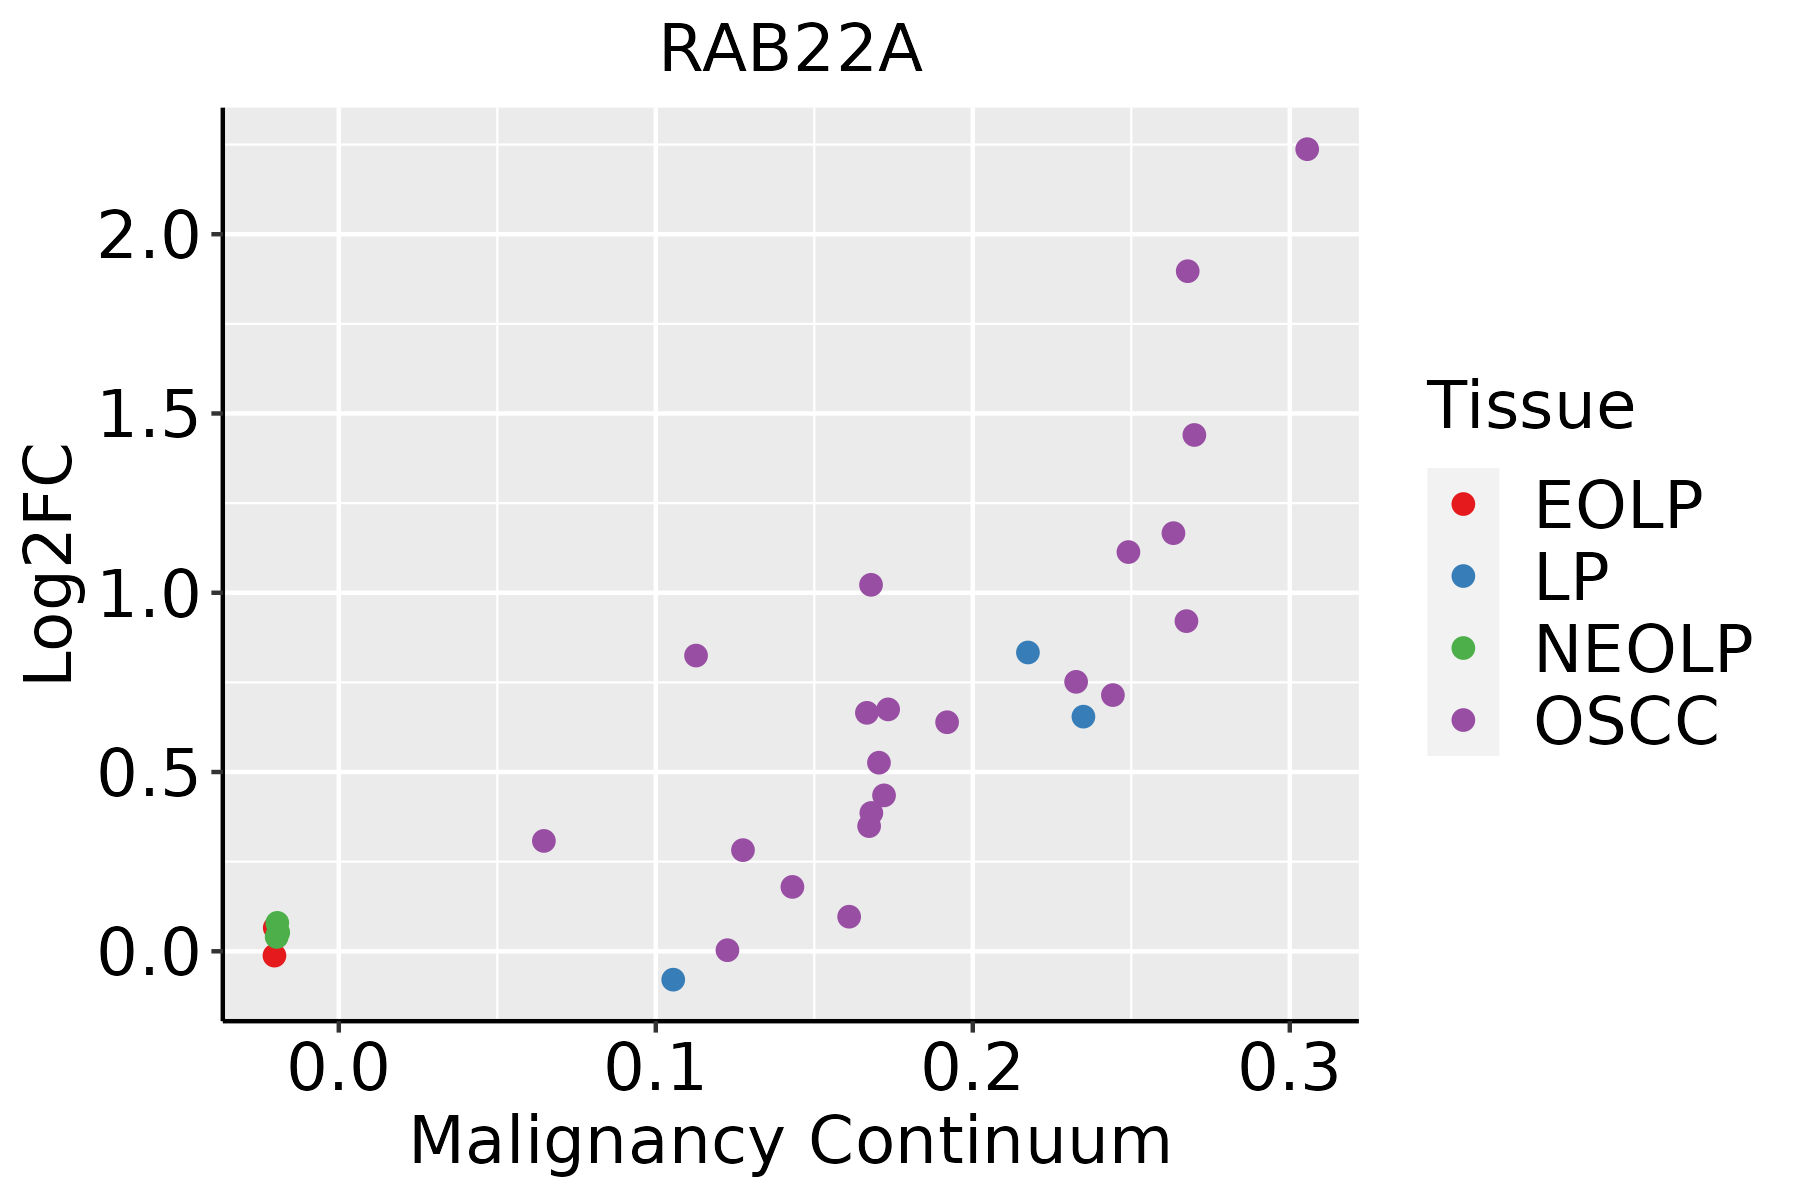 | EOLP: Erosive Oral lichen planus |
| LP: leukoplakia | ||
| NEOLP: Non-erosive oral lichen planus | ||
| OSCC: Oral squamous cell carcinoma | ||
| Skin | 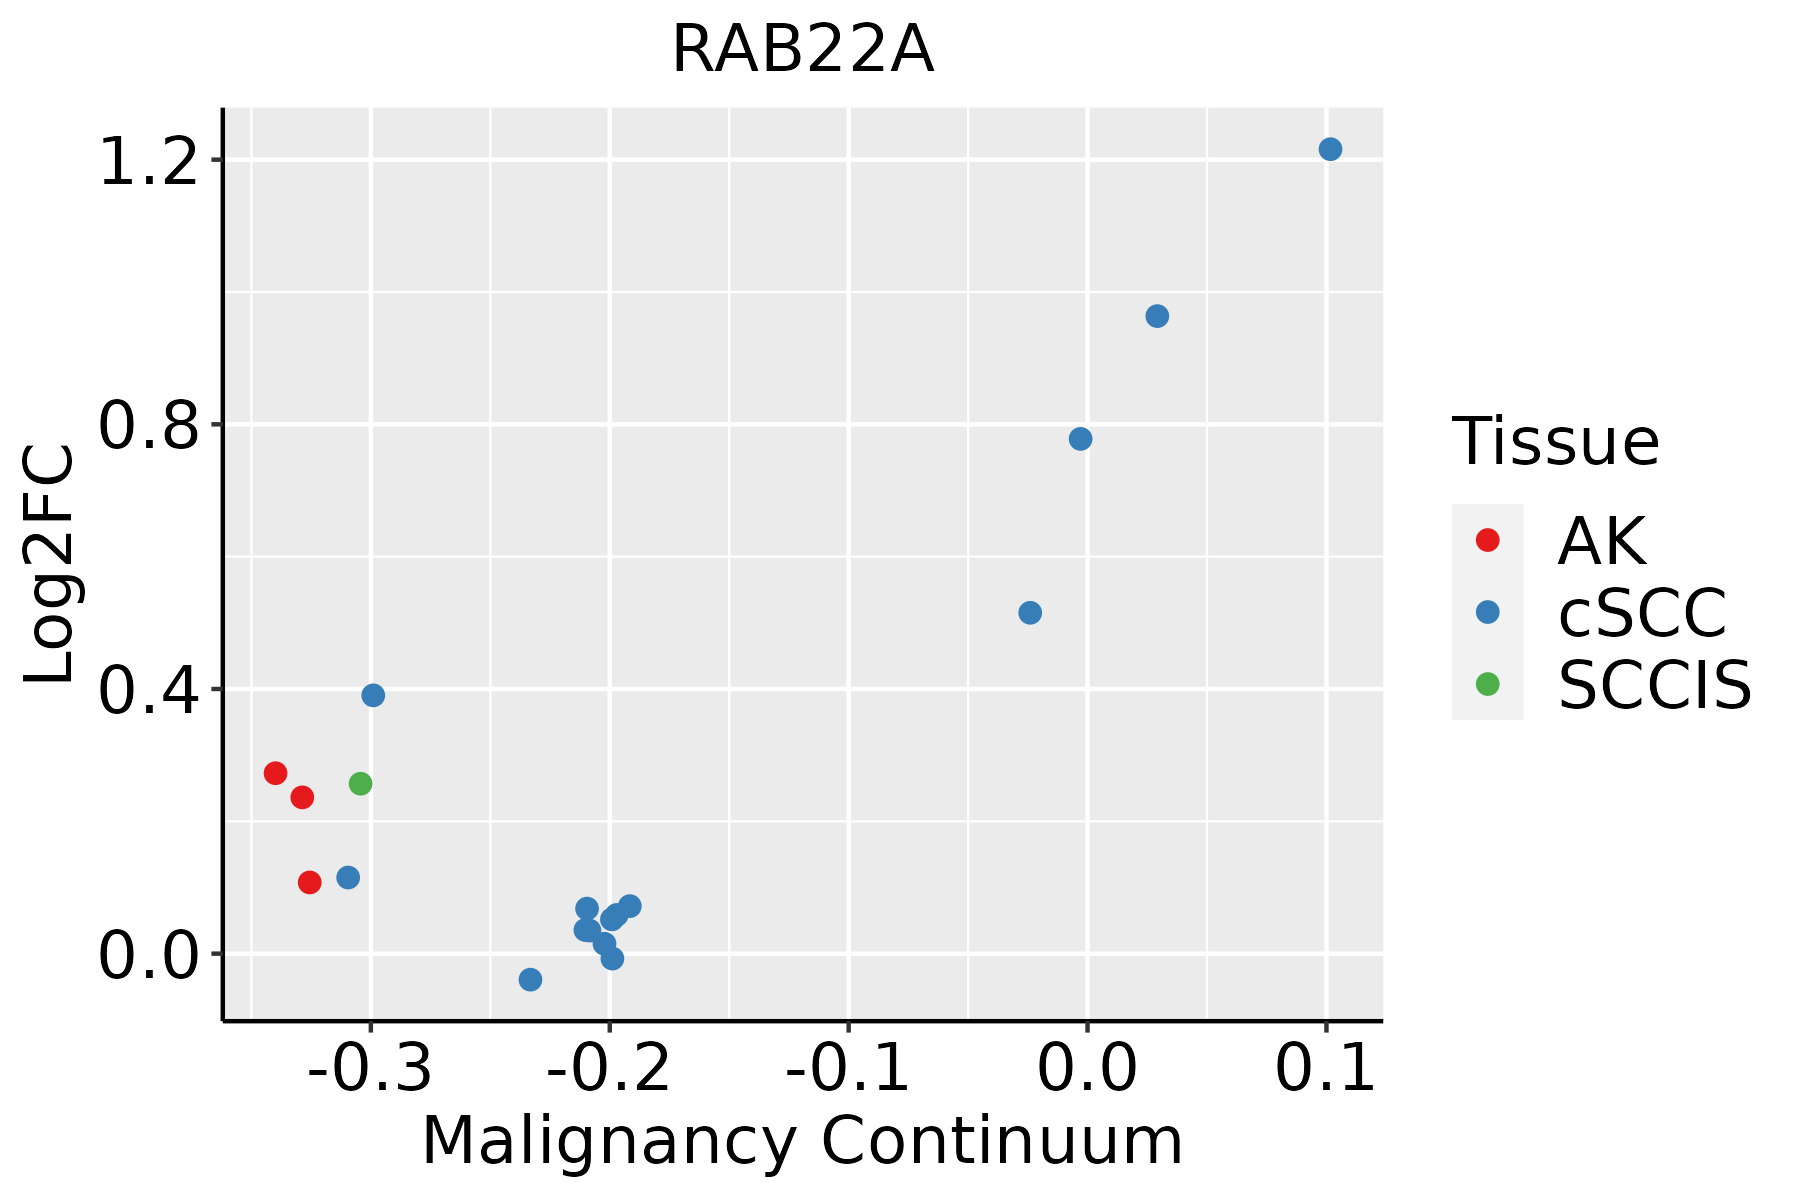 | AK: Actinic keratosis |
| cSCC: Cutaneous squamous cell carcinoma | ||
| SCCIS:squamous cell carcinoma in situ | ||
| Thyroid | 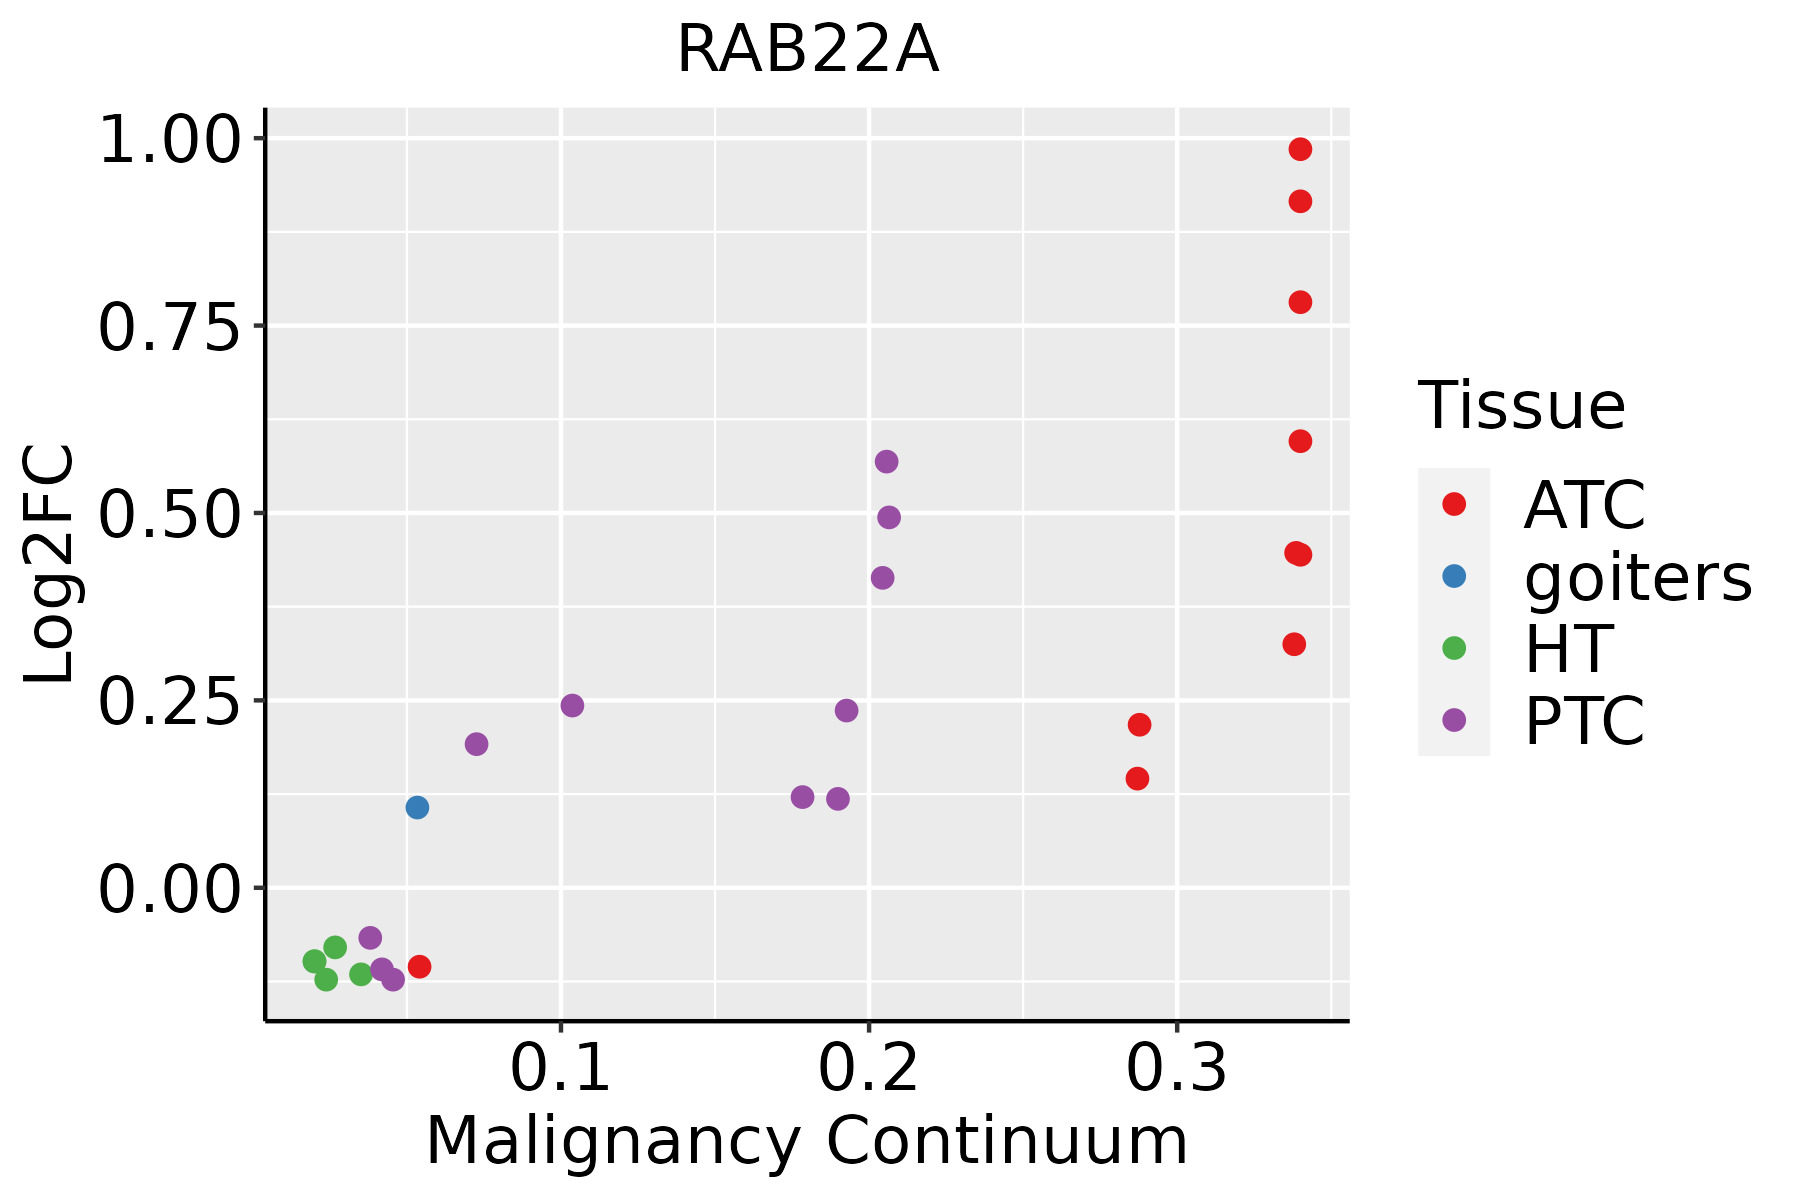 | ATC: Anaplastic thyroid cancer |
| HT: Hashimoto's thyroiditis | ||
| PTC: Papillary thyroid cancer |
| ∗log2FC in expression of this searched gene in stem-like cells from each diseased tissue sample relative to stem-like cells in normal samples in each tissue plotted against the malignancy continuum. Samples are colored based on if they are from different disease stage. |
Top |
Malignant transformation related pathway analysis |
| Find out the enriched GO biological processes and KEGG pathways involved in transition from healthy to precancer to cancer |
| Tissue | Disease Stage | Enriched GO biological Processes |
| Colorectum | AD |  |
| Colorectum | SER |  |
| Colorectum | MSS |  |
| Colorectum | MSI-H |  |
| Colorectum | FAP |  |
| ∗Top 15 enriched GO BP terms are showed in the bar plot of each disease state in each tissue. Each row represents a significant GO biological process which is colored according to the -log10(p.adjust). |
| Page: 1 2 3 4 5 6 7 8 9 |
| GO ID | Tissue | Disease Stage | Description | Gene Ratio | Bg Ratio | pvalue | p.adjust | Count |
| GO:001605014 | Esophagus | ESCC | vesicle organization | 211/8552 | 300/18723 | 2.85e-18 | 2.87e-16 | 211 |
| GO:003253520 | Esophagus | ESCC | regulation of cellular component size | 227/8552 | 383/18723 | 4.77e-08 | 8.60e-07 | 227 |
| GO:000703214 | Esophagus | ESCC | endosome organization | 61/8552 | 82/18723 | 1.13e-07 | 1.85e-06 | 61 |
| GO:001605021 | Liver | HCC | vesicle organization | 194/7958 | 300/18723 | 5.58e-15 | 3.97e-13 | 194 |
| GO:000703211 | Liver | HCC | endosome organization | 61/7958 | 82/18723 | 4.36e-09 | 1.15e-07 | 61 |
| GO:003253522 | Liver | HCC | regulation of cellular component size | 217/7958 | 383/18723 | 1.28e-08 | 3.14e-07 | 217 |
| GO:0097494 | Liver | HCC | regulation of vesicle size | 9/7958 | 11/18723 | 9.51e-03 | 3.60e-02 | 9 |
| GO:00160508 | Oral cavity | OSCC | vesicle organization | 189/7305 | 300/18723 | 2.40e-17 | 2.14e-15 | 189 |
| GO:00070327 | Oral cavity | OSCC | endosome organization | 59/7305 | 82/18723 | 1.41e-09 | 3.39e-08 | 59 |
| GO:003253519 | Oral cavity | OSCC | regulation of cellular component size | 201/7305 | 383/18723 | 4.80e-08 | 8.88e-07 | 201 |
| GO:003253524 | Skin | AK | regulation of cellular component size | 62/1910 | 383/18723 | 1.66e-04 | 1.94e-03 | 62 |
| GO:001605010 | Skin | AK | vesicle organization | 45/1910 | 300/18723 | 5.44e-03 | 3.02e-02 | 45 |
| GO:00070329 | Skin | AK | endosome organization | 16/1910 | 82/18723 | 8.04e-03 | 4.05e-02 | 16 |
| GO:001605015 | Skin | cSCC | vesicle organization | 135/4864 | 300/18723 | 5.98e-13 | 3.44e-11 | 135 |
| GO:000703215 | Skin | cSCC | endosome organization | 42/4864 | 82/18723 | 8.86e-07 | 1.63e-05 | 42 |
| GO:0032535111 | Skin | cSCC | regulation of cellular component size | 131/4864 | 383/18723 | 1.89e-04 | 1.59e-03 | 131 |
| GO:001605017 | Thyroid | PTC | vesicle organization | 163/5968 | 300/18723 | 4.74e-16 | 3.69e-14 | 163 |
| GO:0032535112 | Thyroid | PTC | regulation of cellular component size | 181/5968 | 383/18723 | 1.70e-10 | 5.64e-09 | 181 |
| GO:000703210 | Thyroid | PTC | endosome organization | 48/5968 | 82/18723 | 5.65e-07 | 9.04e-06 | 48 |
| GO:001605023 | Thyroid | ATC | vesicle organization | 166/6293 | 300/18723 | 6.14e-15 | 3.92e-13 | 166 |
| Page: 1 2 |
| Pathway ID | Tissue | Disease Stage | Description | Gene Ratio | Bg Ratio | pvalue | p.adjust | qvalue | Count |
| hsa04144210 | Esophagus | ESCC | Endocytosis | 186/4205 | 251/8465 | 9.74e-16 | 4.66e-14 | 2.39e-14 | 186 |
| hsa0414437 | Esophagus | ESCC | Endocytosis | 186/4205 | 251/8465 | 9.74e-16 | 4.66e-14 | 2.39e-14 | 186 |
| hsa0414422 | Liver | HCC | Endocytosis | 178/4020 | 251/8465 | 2.03e-14 | 5.22e-13 | 2.91e-13 | 178 |
| hsa0414432 | Liver | HCC | Endocytosis | 178/4020 | 251/8465 | 2.03e-14 | 5.22e-13 | 2.91e-13 | 178 |
| hsa0414427 | Oral cavity | OSCC | Endocytosis | 174/3704 | 251/8465 | 9.42e-17 | 4.51e-15 | 2.29e-15 | 174 |
| hsa04144112 | Oral cavity | OSCC | Endocytosis | 174/3704 | 251/8465 | 9.42e-17 | 4.51e-15 | 2.29e-15 | 174 |
| Page: 1 |
Top |
Cell-cell communication analysis |
| Identification of potential cell-cell interactions between two cell types and their ligand-receptor pairs for different disease states |
| Ligand | Receptor | LRpair | Pathway | Tissue | Disease Stage |
| Page: 1 |
Top |
Single-cell gene regulatory network inference analysis |
| Find out the significant the regulons (TFs) and the target genes of each regulon across cell types for different disease states |
| TF | Cell Type | Tissue | Disease Stage | Target Gene | RSS | Regulon Activity |
| ∗The dot plots of a searched regulon are shown for all cell subpopulations in each disease state of each tissue based on the regulon specific score inferred using pySCENIC and by calculating the average expression. |
| Page: 1 |
Top |
Somatic mutation of malignant transformation related genes |
| Annotation of somatic variants for genes involved in malignant transformation |
| Hugo Symbol | Variant Class | Variant Classification | dbSNP RS | HGVSc | HGVSp | HGVSp Short | SWISSPROT | BIOTYPE | SIFT | PolyPhen | Tumor Sample Barcode | Tissue | Histology | Sex | Age | Stage | Therapy Types | Drugs | Outcome |
| RAB22A | SNV | Missense_Mutation | c.437N>C | p.Glu146Ala | p.E146A | Q9UL26 | protein_coding | deleterious(0) | probably_damaging(0.983) | TCGA-A2-A0T0-01 | Breast | breast invasive carcinoma | Female | <65 | I/II | Chemotherapy | taxotere | SD | |
| RAB22A | SNV | Missense_Mutation | c.438N>T | p.Glu146Asp | p.E146D | Q9UL26 | protein_coding | deleterious(0) | probably_damaging(0.929) | TCGA-A2-A0T0-01 | Breast | breast invasive carcinoma | Female | <65 | I/II | Chemotherapy | taxotere | SD | |
| RAB22A | SNV | Missense_Mutation | c.379G>C | p.Glu127Gln | p.E127Q | Q9UL26 | protein_coding | tolerated(0.14) | probably_damaging(0.978) | TCGA-DS-A1OC-01 | Cervix | cervical & endocervical cancer | Female | <65 | I/II | Chemotherapy | gemcitabine | SD | |
| RAB22A | SNV | Missense_Mutation | novel | c.91N>C | p.Asp31His | p.D31H | Q9UL26 | protein_coding | tolerated(0.84) | probably_damaging(0.994) | TCGA-JW-A5VL-01 | Cervix | cervical & endocervical cancer | Female | <65 | I/II | Unknown | Unknown | SD |
| RAB22A | insertion | Frame_Shift_Ins | novel | c.446_447insA | p.Asn151LysfsTer7 | p.N151Kfs*7 | Q9UL26 | protein_coding | TCGA-AA-3950-01 | Colorectum | colon adenocarcinoma | Female | >=65 | I/II | Unknown | Unknown | SD | ||
| RAB22A | SNV | Missense_Mutation | rs373476700 | c.455N>T | p.Ala152Val | p.A152V | Q9UL26 | protein_coding | deleterious(0) | probably_damaging(0.95) | TCGA-A5-A0G2-01 | Endometrium | uterine corpus endometrioid carcinoma | Female | <65 | III/IV | Unknown | Unknown | SD |
| RAB22A | SNV | Missense_Mutation | novel | c.307N>A | p.Leu103Ile | p.L103I | Q9UL26 | protein_coding | deleterious(0) | probably_damaging(1) | TCGA-A5-A1OF-01 | Endometrium | uterine corpus endometrioid carcinoma | Female | <65 | I/II | Unknown | Unknown | SD |
| RAB22A | SNV | Missense_Mutation | novel | c.520N>T | p.Pro174Ser | p.P174S | Q9UL26 | protein_coding | tolerated(0.26) | benign(0.005) | TCGA-AX-A0J1-01 | Endometrium | uterine corpus endometrioid carcinoma | Female | >=65 | I/II | Unknown | Unknown | SD |
| RAB22A | SNV | Missense_Mutation | rs148684735 | c.548N>A | p.Arg183Gln | p.R183Q | Q9UL26 | protein_coding | tolerated(0.62) | benign(0.034) | TCGA-BG-A0M4-01 | Endometrium | uterine corpus endometrioid carcinoma | Female | <65 | I/II | Chemotherapy | carboplatin | SD |
| RAB22A | SNV | Missense_Mutation | c.554N>C | p.Gln185Pro | p.Q185P | Q9UL26 | protein_coding | tolerated(0.28) | benign(0.003) | TCGA-BS-A0UJ-01 | Endometrium | uterine corpus endometrioid carcinoma | Female | >=65 | I/II | Unknown | Unknown | SD |
| Page: 1 2 |
Top |
Related drugs of malignant transformation related genes |
| Identification of chemicals and drugs interact with genes involved in malignant transfromation |
| (DGIdb 4.0) |
| Entrez ID | Symbol | Category | Interaction Types | Drug Claim Name | Drug Name | PMIDs |
| Page: 1 |

Copyright 2023-Present -The University of Texas Health Science Center at Houston |