
|
|||||
|
 | |
| |
| |
| |
| |
| |
|
Gene: RAB21 |
Gene summary for RAB21 |
| Gene information | Species | Human | Gene symbol | RAB21 | Gene ID | 23011 |
| Gene name | RAB21, member RAS oncogene family | |
| Gene Alias | RAB21 | |
| Cytomap | 12q21.1 | |
| Gene Type | protein-coding | GO ID | GO:0000902 | UniProtAcc | A0A024RBA9 |
Top |
Malignant transformation analysis |
| Identification of the aberrant gene expression in precancerous and cancerous lesions by comparing the gene expression of stem-like cells in diseased tissues with normal stem cells |
| Entrez ID | Symbol | Replicates | Species | Organ | Tissue | Adj P-value | Log2FC | Malignancy |
| 23011 | RAB21 | AEH-subject1 | Human | Endometrium | AEH | 1.17e-02 | 1.86e-01 | -0.3059 |
| 23011 | RAB21 | EEC-subject3 | Human | Endometrium | EEC | 7.65e-03 | -9.88e-03 | -0.2525 |
| 23011 | RAB21 | GSM5276934 | Human | Endometrium | EEC | 5.45e-24 | 6.18e-01 | -0.0913 |
| 23011 | RAB21 | GSM5276937 | Human | Endometrium | EEC | 1.49e-15 | 5.34e-01 | -0.0897 |
| 23011 | RAB21 | GSM6177620_NYU_UCEC1_lib1_lib1 | Human | Endometrium | EEC | 5.30e-09 | 3.30e-02 | -0.1869 |
| 23011 | RAB21 | GSM6177620_NYU_UCEC1_lib2_lib2 | Human | Endometrium | EEC | 8.34e-08 | -4.99e-02 | -0.1875 |
| 23011 | RAB21 | GSM6177620_NYU_UCEC1_lib3_lib3 | Human | Endometrium | EEC | 1.16e-12 | 7.92e-02 | -0.1883 |
| 23011 | RAB21 | GSM6177621_NYU_UCEC2_lib1_lib1 | Human | Endometrium | EEC | 9.93e-07 | 3.90e-02 | -0.1934 |
| 23011 | RAB21 | GSM6177622_NYU_UCEC3_lib1_lib1 | Human | Endometrium | EEC | 1.43e-13 | 5.71e-02 | -0.1917 |
| 23011 | RAB21 | GSM6177622_NYU_UCEC3_lib2_lib2 | Human | Endometrium | EEC | 7.85e-14 | 1.21e-01 | -0.1916 |
| 23011 | RAB21 | GSM6177623_NYU_UCEC3_Vis | Human | Endometrium | EEC | 4.76e-02 | 1.38e-01 | -0.1269 |
| 23011 | RAB21 | LZE4T | Human | Esophagus | ESCC | 1.71e-09 | 4.44e-01 | 0.0811 |
| 23011 | RAB21 | LZE8T | Human | Esophagus | ESCC | 6.67e-08 | 6.87e-03 | 0.067 |
| 23011 | RAB21 | LZE24T | Human | Esophagus | ESCC | 2.76e-13 | 1.86e-01 | 0.0596 |
| 23011 | RAB21 | LZE21T | Human | Esophagus | ESCC | 2.00e-03 | 1.86e-02 | 0.0655 |
| 23011 | RAB21 | P1T-E | Human | Esophagus | ESCC | 3.06e-05 | 3.12e-01 | 0.0875 |
| 23011 | RAB21 | P2T-E | Human | Esophagus | ESCC | 3.44e-26 | 4.39e-01 | 0.1177 |
| 23011 | RAB21 | P4T-E | Human | Esophagus | ESCC | 1.02e-17 | 4.61e-01 | 0.1323 |
| 23011 | RAB21 | P5T-E | Human | Esophagus | ESCC | 1.79e-20 | 2.72e-01 | 0.1327 |
| 23011 | RAB21 | P8T-E | Human | Esophagus | ESCC | 3.73e-19 | 4.21e-01 | 0.0889 |
| Page: 1 2 3 4 5 6 7 |
| Tissue | Expression Dynamics | Abbreviation |
| Endometrium | 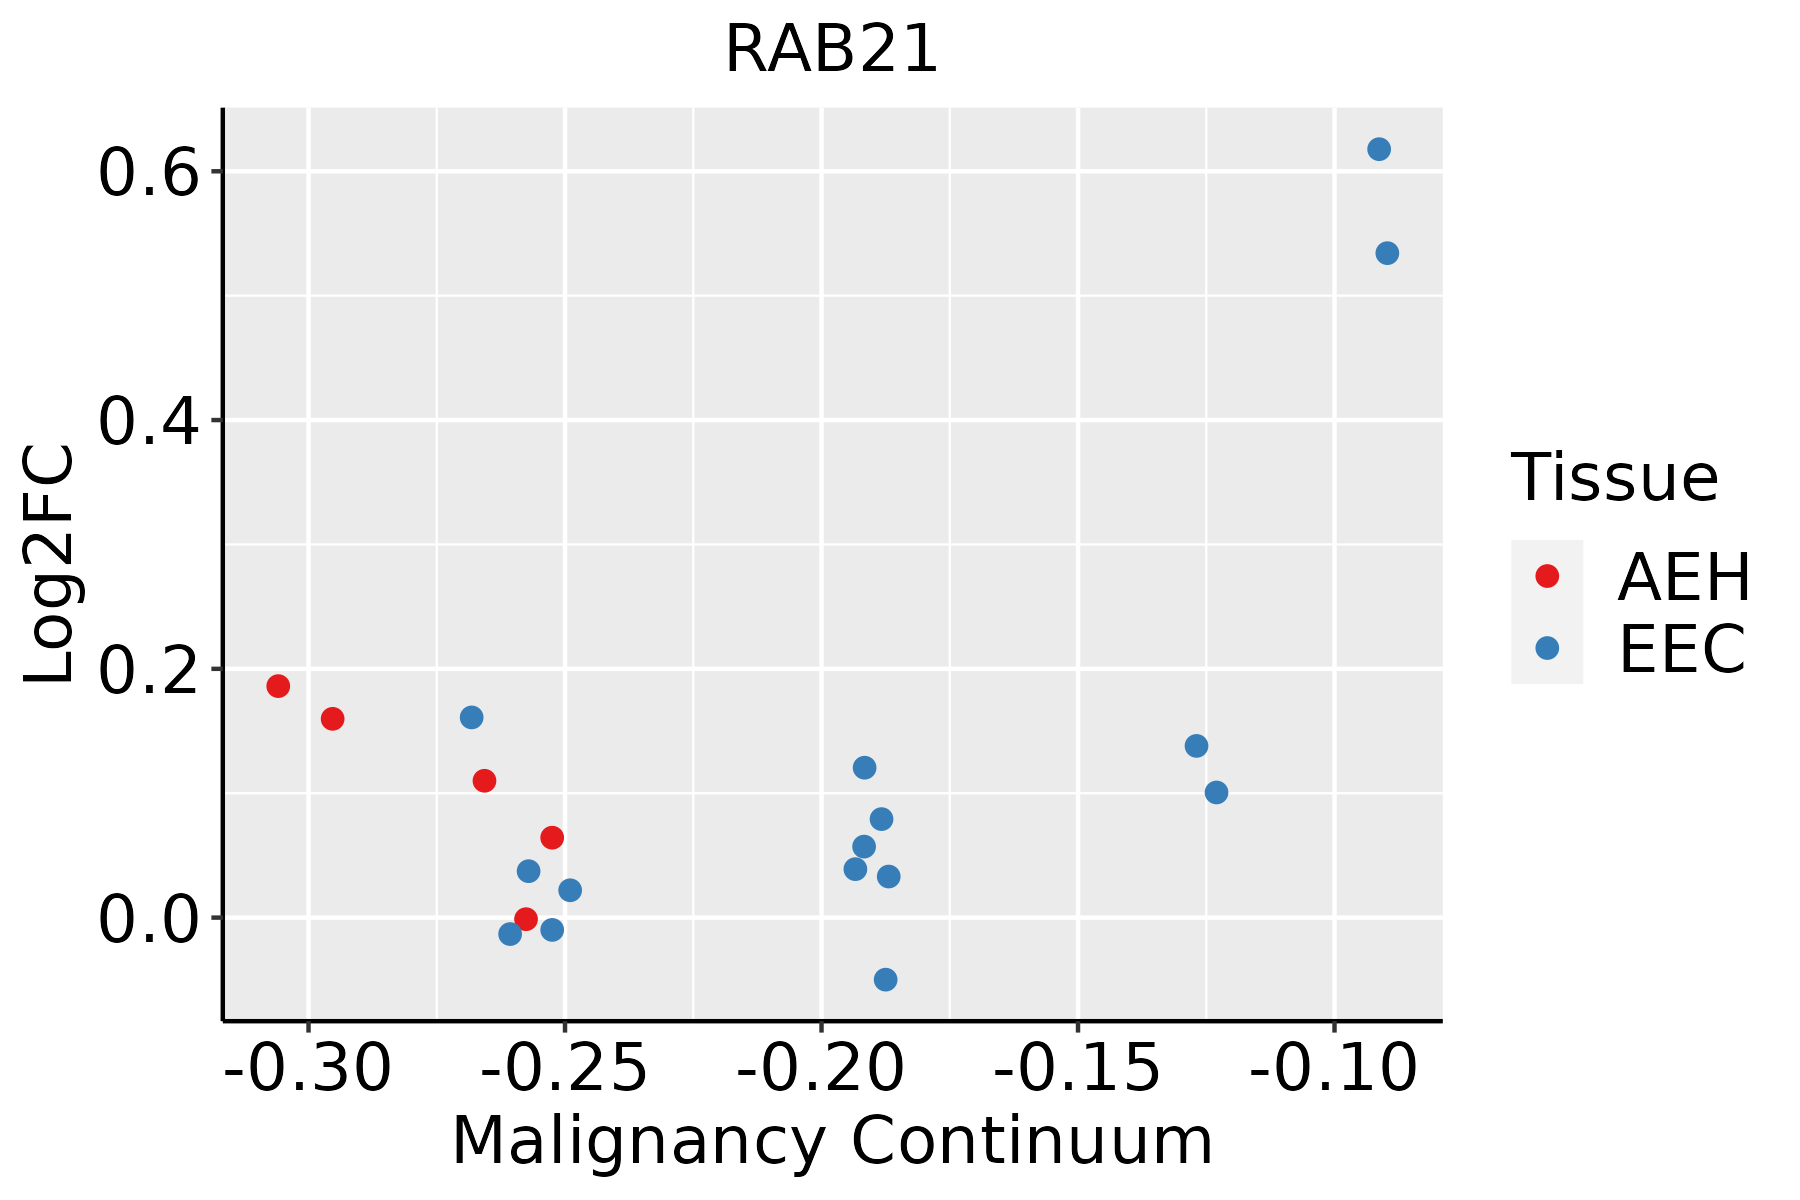 | AEH: Atypical endometrial hyperplasia |
| EEC: Endometrioid Cancer | ||
| Esophagus | 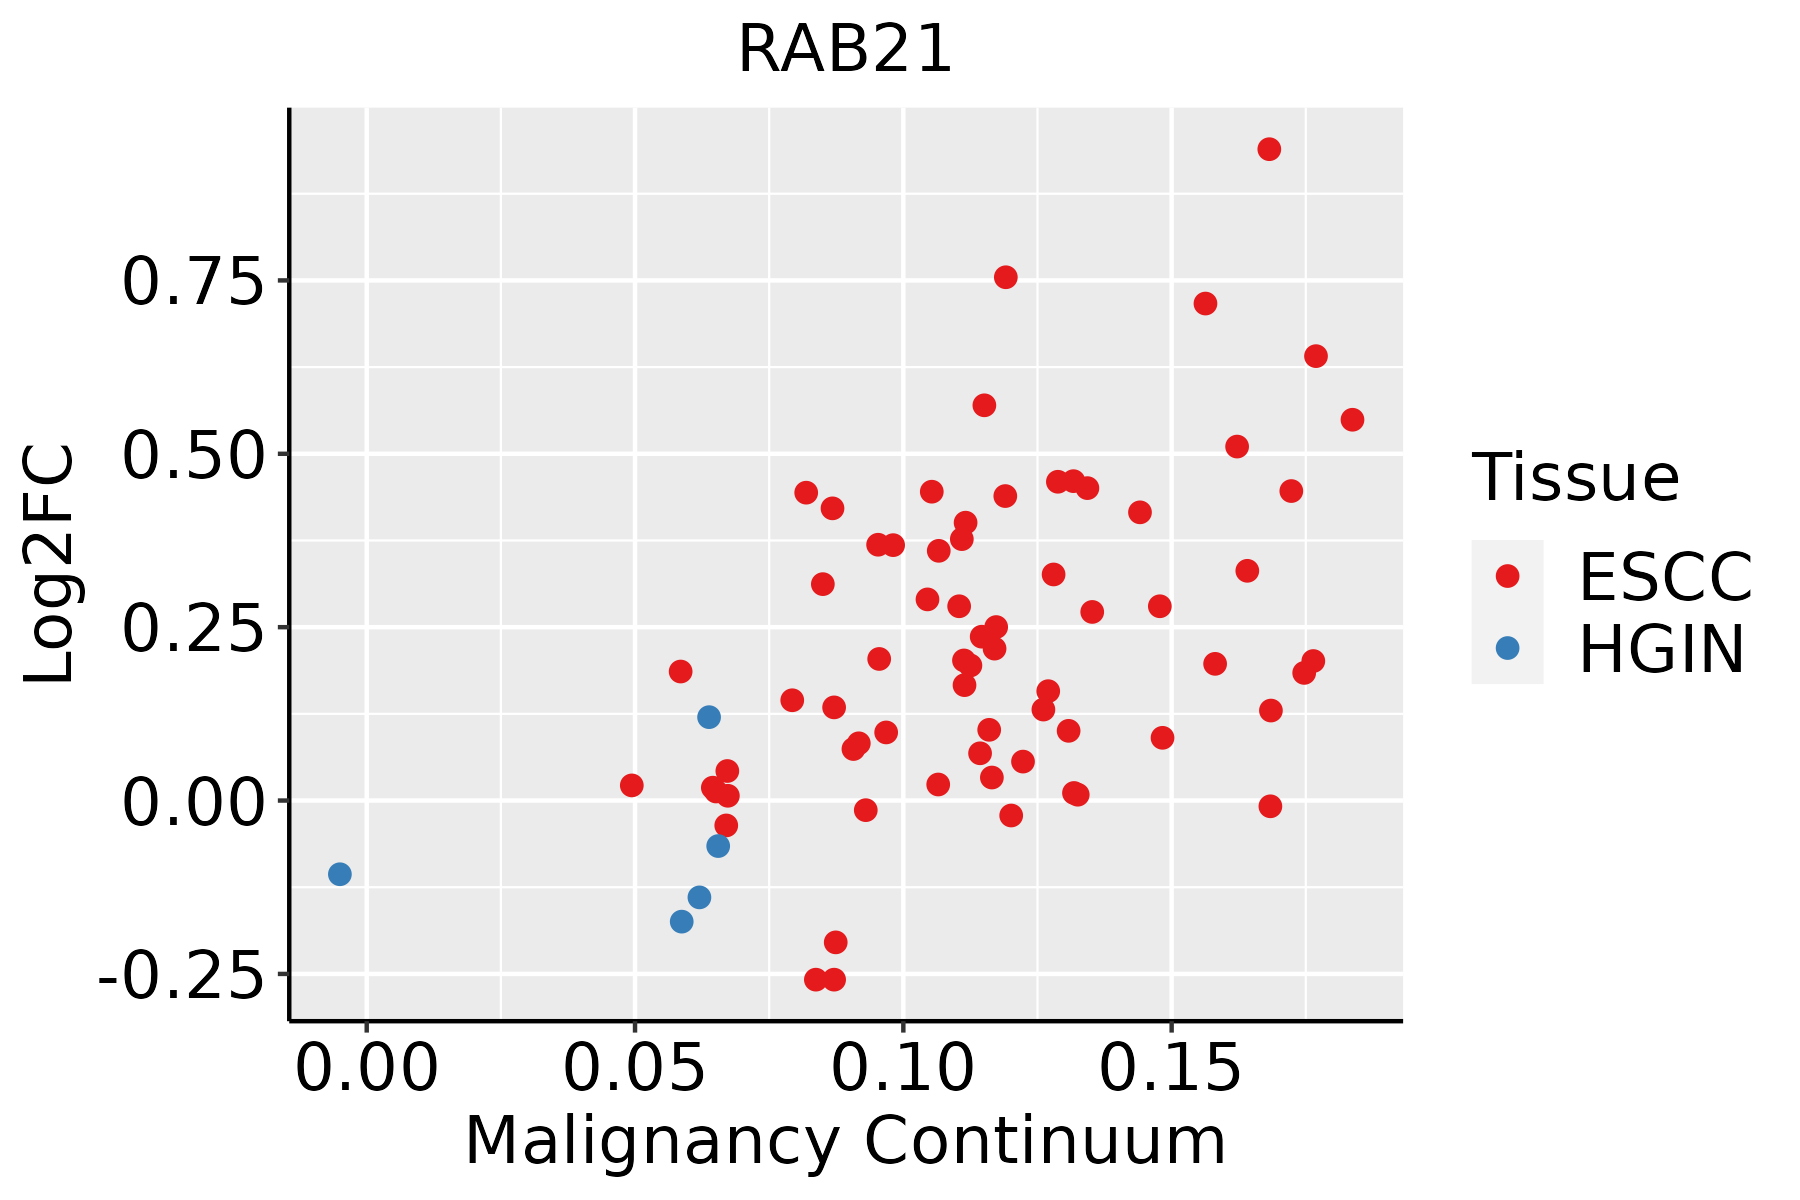 | ESCC: Esophageal squamous cell carcinoma |
| HGIN: High-grade intraepithelial neoplasias | ||
| LGIN: Low-grade intraepithelial neoplasias | ||
| Liver | 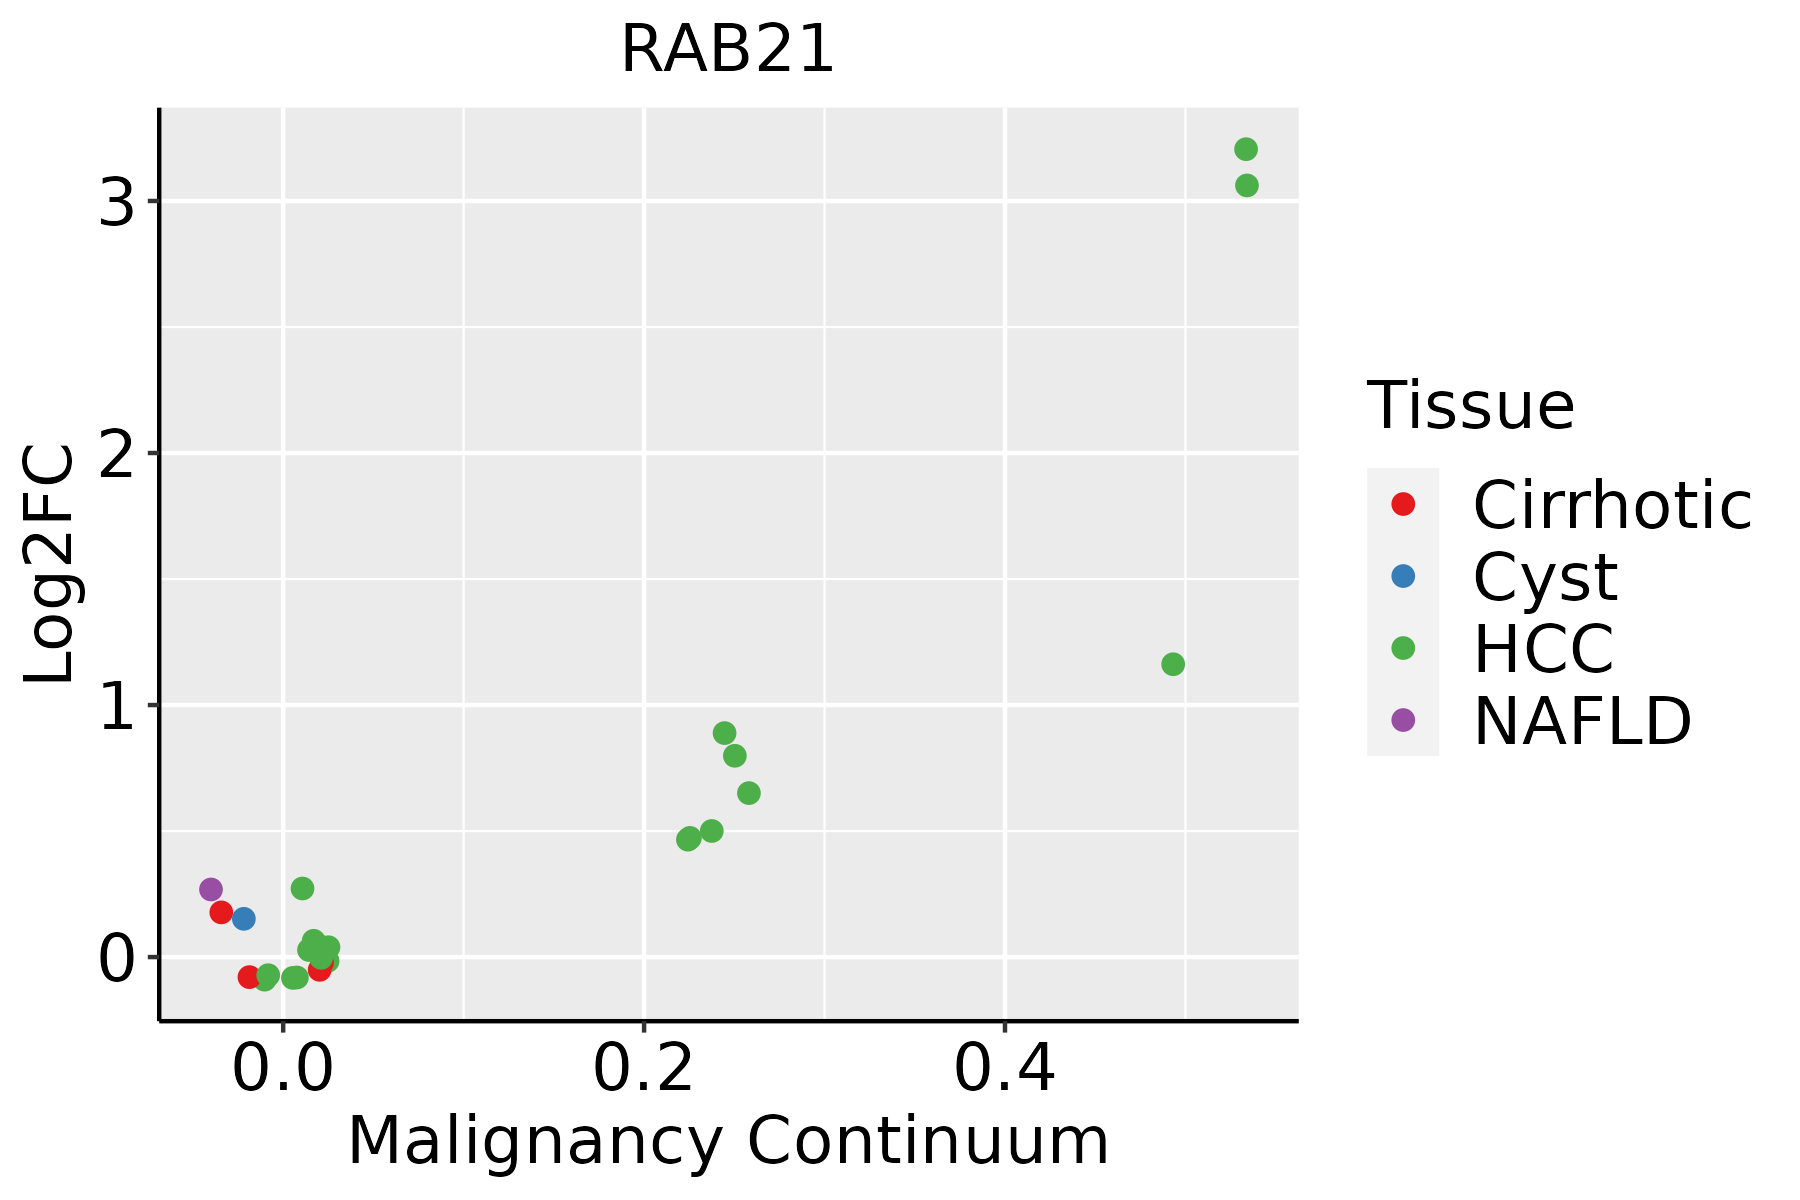 | HCC: Hepatocellular carcinoma |
| NAFLD: Non-alcoholic fatty liver disease | ||
| Oral Cavity | 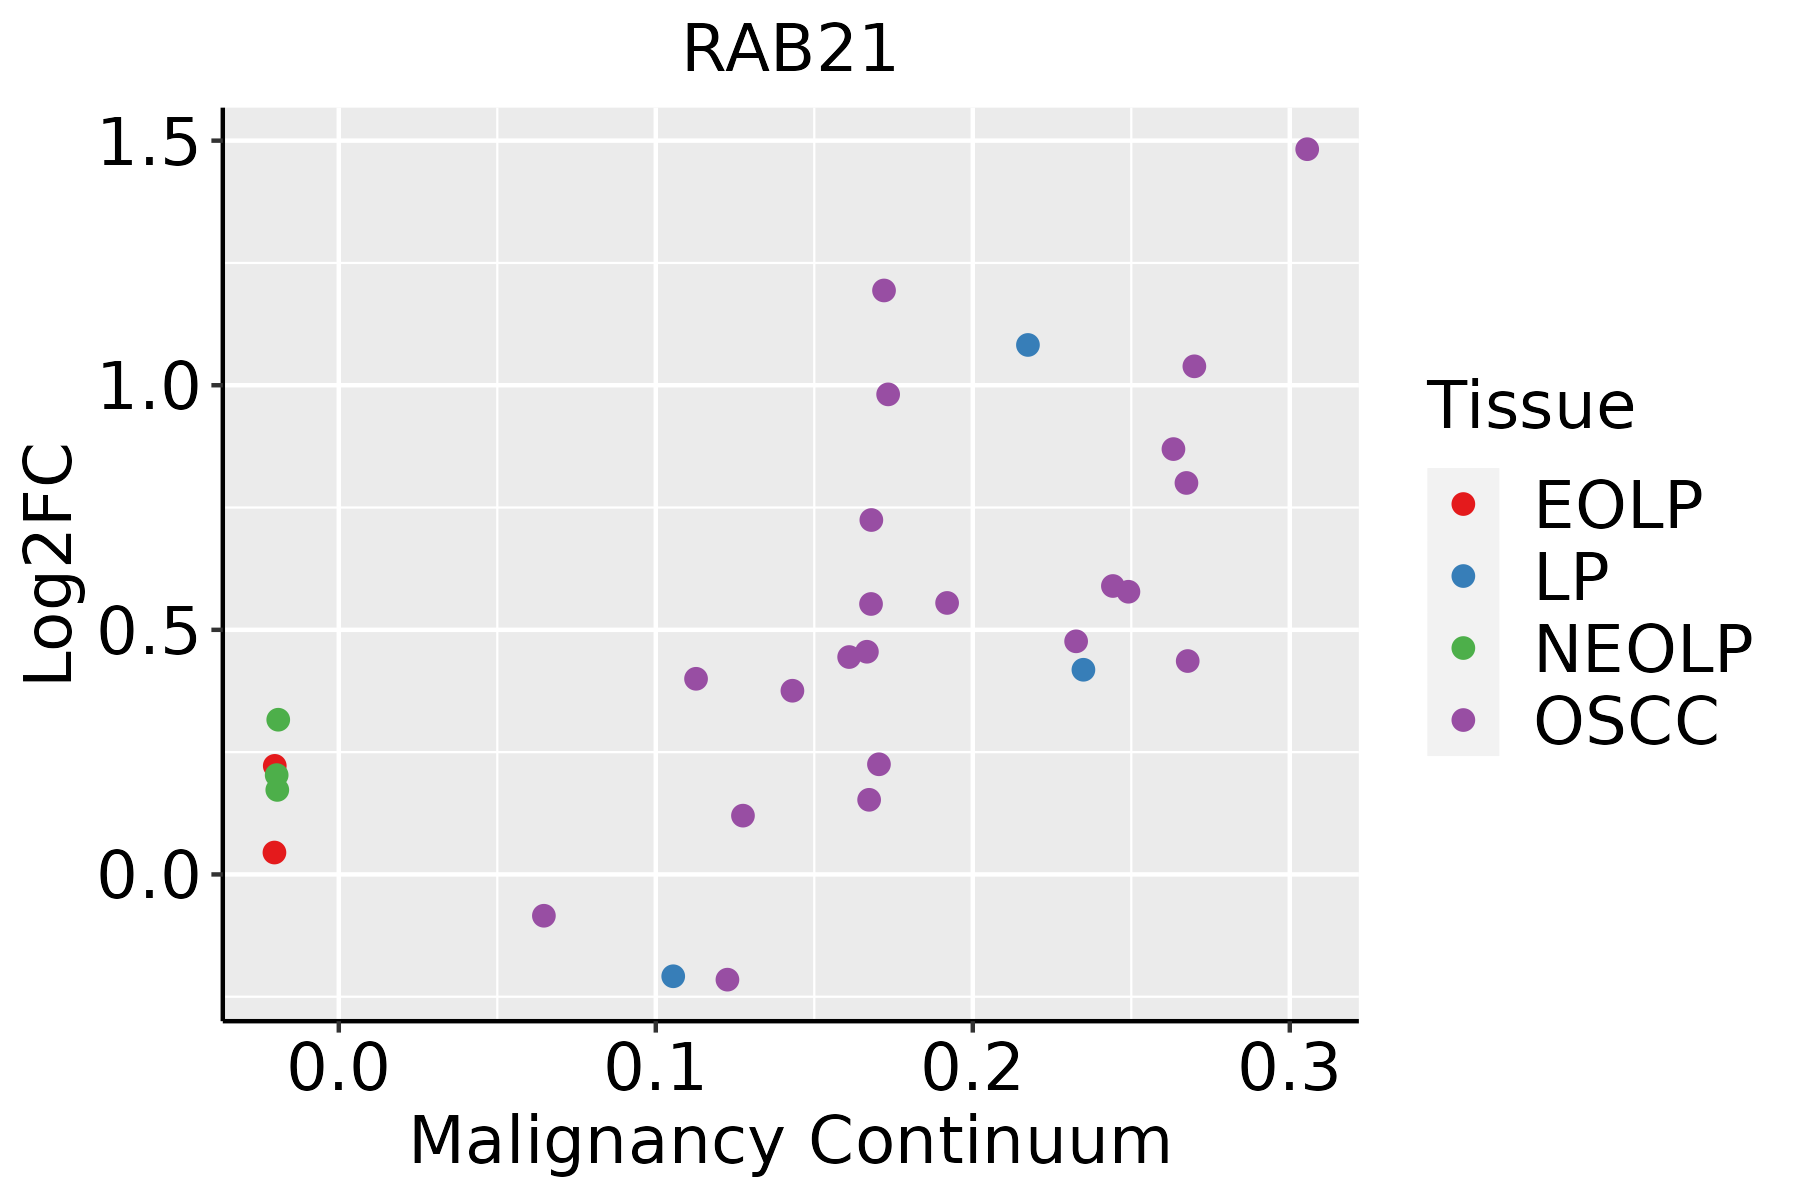 | EOLP: Erosive Oral lichen planus |
| LP: leukoplakia | ||
| NEOLP: Non-erosive oral lichen planus | ||
| OSCC: Oral squamous cell carcinoma | ||
| Prostate | 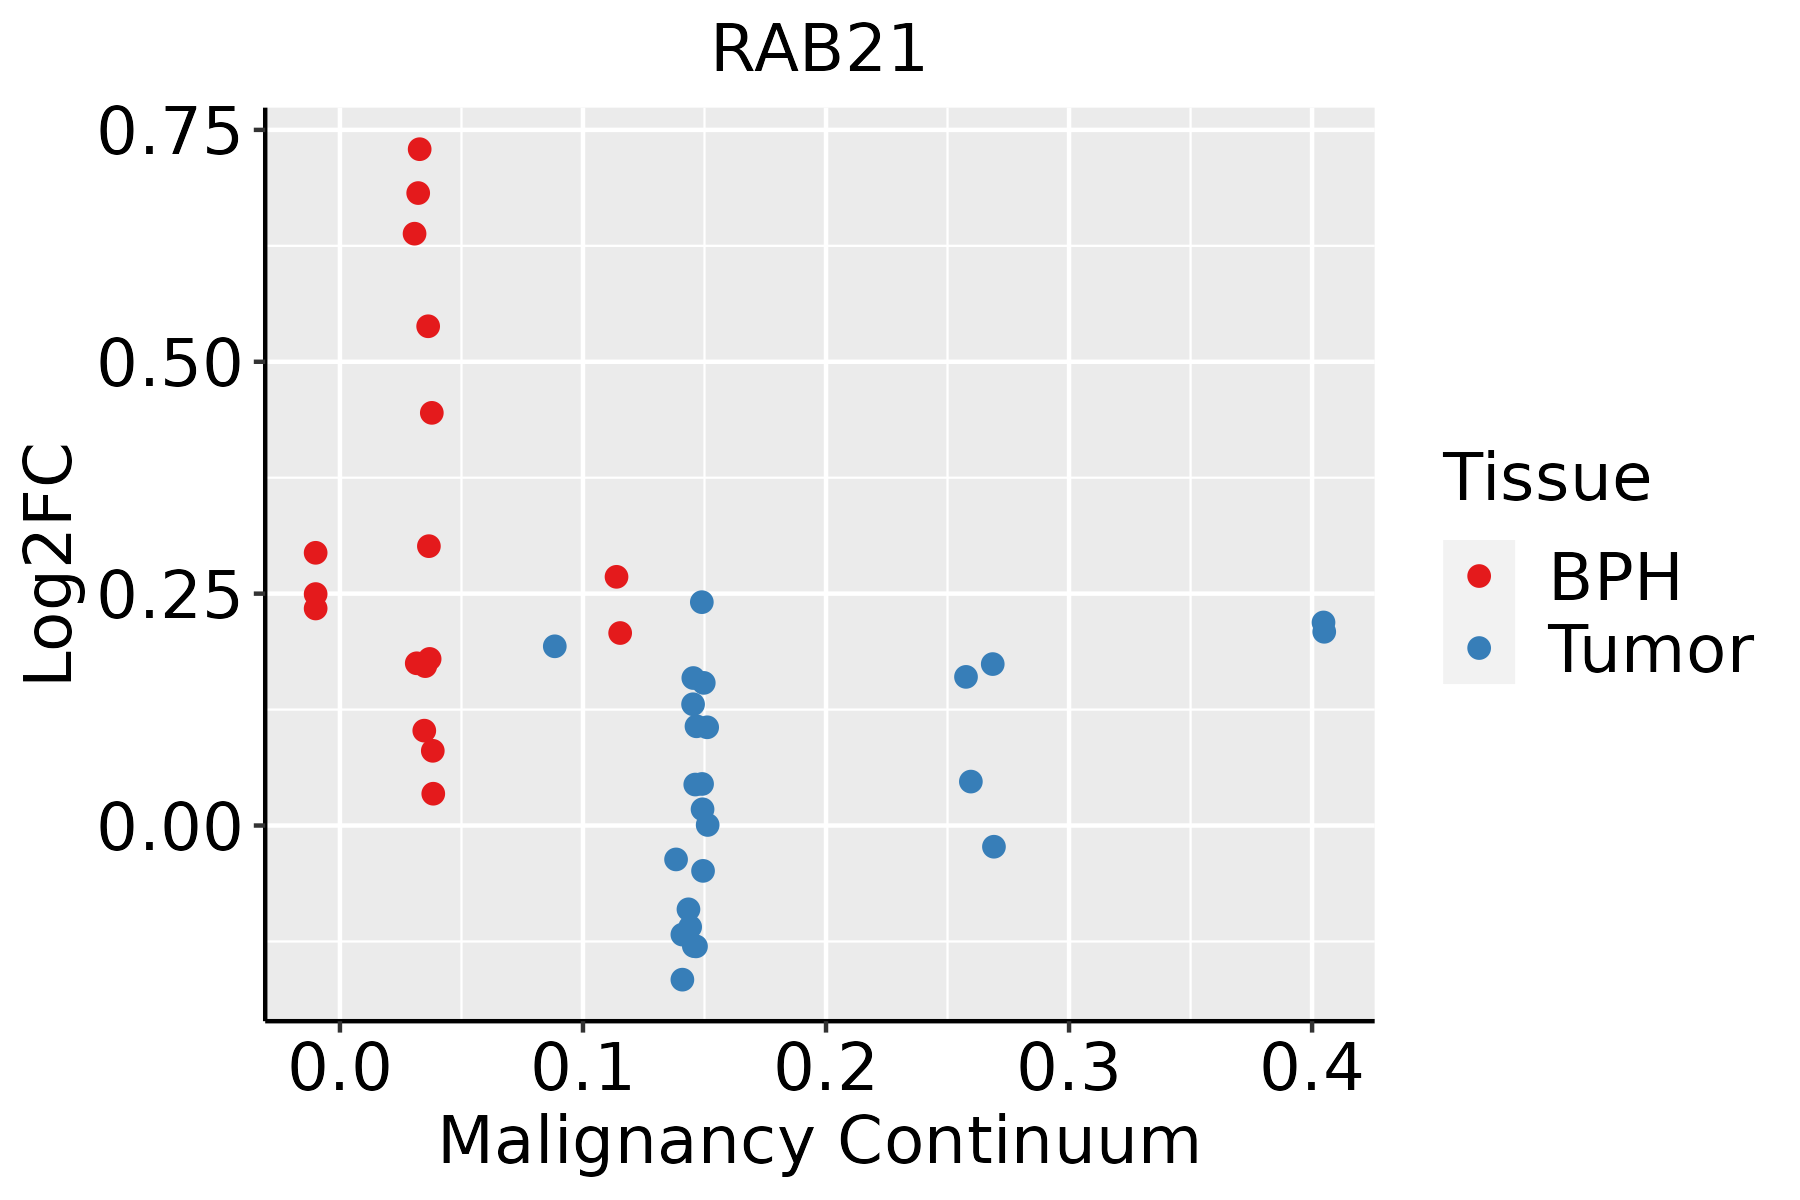 | BPH: Benign Prostatic Hyperplasia |
| Thyroid |  | ATC: Anaplastic thyroid cancer |
| HT: Hashimoto's thyroiditis | ||
| PTC: Papillary thyroid cancer |
| ∗log2FC in expression of this searched gene in stem-like cells from each diseased tissue sample relative to stem-like cells in normal samples in each tissue plotted against the malignancy continuum. Samples are colored based on if they are from different disease stage. |
Top |
Malignant transformation related pathway analysis |
| Find out the enriched GO biological processes and KEGG pathways involved in transition from healthy to precancer to cancer |
| Tissue | Disease Stage | Enriched GO biological Processes |
| Colorectum | AD |  |
| Colorectum | SER |  |
| Colorectum | MSS |  |
| Colorectum | MSI-H |  |
| Colorectum | FAP |  |
| ∗Top 15 enriched GO BP terms are showed in the bar plot of each disease state in each tissue. Each row represents a significant GO biological process which is colored according to the -log10(p.adjust). |
| Page: 1 2 3 4 5 6 7 8 9 |
| GO ID | Tissue | Disease Stage | Description | Gene Ratio | Bg Ratio | pvalue | p.adjust | Count |
| GO:002260415 | Endometrium | AEH | regulation of cell morphogenesis | 79/2100 | 309/18723 | 1.04e-12 | 2.24e-10 | 79 |
| GO:003164716 | Endometrium | AEH | regulation of protein stability | 77/2100 | 298/18723 | 1.13e-12 | 2.26e-10 | 77 |
| GO:005082116 | Endometrium | AEH | protein stabilization | 55/2100 | 191/18723 | 2.19e-11 | 3.20e-09 | 55 |
| GO:001076910 | Endometrium | AEH | regulation of cell morphogenesis involved in differentiation | 31/2100 | 96/18723 | 2.70e-08 | 1.56e-06 | 31 |
| GO:00160499 | Endometrium | AEH | cell growth | 93/2100 | 482/18723 | 1.00e-07 | 4.99e-06 | 93 |
| GO:003253510 | Endometrium | AEH | regulation of cellular component size | 78/2100 | 383/18723 | 1.10e-07 | 5.29e-06 | 78 |
| GO:00605607 | Endometrium | AEH | developmental growth involved in morphogenesis | 53/2100 | 234/18723 | 4.02e-07 | 1.67e-05 | 53 |
| GO:00074098 | Endometrium | AEH | axonogenesis | 81/2100 | 418/18723 | 5.54e-07 | 2.12e-05 | 81 |
| GO:00615648 | Endometrium | AEH | axon development | 88/2100 | 467/18723 | 6.39e-07 | 2.38e-05 | 88 |
| GO:003238810 | Endometrium | AEH | positive regulation of intracellular transport | 46/2100 | 202/18723 | 1.96e-06 | 5.93e-05 | 46 |
| GO:00107709 | Endometrium | AEH | positive regulation of cell morphogenesis involved in differentiation | 24/2100 | 79/18723 | 3.33e-06 | 9.03e-05 | 24 |
| GO:00323869 | Endometrium | AEH | regulation of intracellular transport | 66/2100 | 337/18723 | 4.18e-06 | 1.10e-04 | 66 |
| GO:00486757 | Endometrium | AEH | axon extension | 31/2100 | 120/18723 | 6.13e-06 | 1.50e-04 | 31 |
| GO:00015589 | Endometrium | AEH | regulation of cell growth | 75/2100 | 414/18723 | 1.79e-05 | 3.65e-04 | 75 |
| GO:00482598 | Endometrium | AEH | regulation of receptor-mediated endocytosis | 28/2100 | 110/18723 | 2.28e-05 | 4.35e-04 | 28 |
| GO:00485887 | Endometrium | AEH | developmental cell growth | 48/2100 | 234/18723 | 2.39e-05 | 4.53e-04 | 48 |
| GO:19901386 | Endometrium | AEH | neuron projection extension | 38/2100 | 172/18723 | 3.03e-05 | 5.56e-04 | 38 |
| GO:00072657 | Endometrium | AEH | Ras protein signal transduction | 63/2100 | 337/18723 | 3.09e-05 | 5.66e-04 | 63 |
| GO:00301009 | Endometrium | AEH | regulation of endocytosis | 44/2100 | 211/18723 | 3.39e-05 | 6.05e-04 | 44 |
| GO:00068988 | Endometrium | AEH | receptor-mediated endocytosis | 49/2100 | 244/18723 | 3.54e-05 | 6.24e-04 | 49 |
| Page: 1 2 3 4 5 6 7 8 9 10 11 12 13 14 15 16 17 18 19 20 21 22 |
| Pathway ID | Tissue | Disease Stage | Description | Gene Ratio | Bg Ratio | pvalue | p.adjust | qvalue | Count |
| Page: 1 |
Top |
Cell-cell communication analysis |
| Identification of potential cell-cell interactions between two cell types and their ligand-receptor pairs for different disease states |
| Ligand | Receptor | LRpair | Pathway | Tissue | Disease Stage |
| Page: 1 |
Top |
Single-cell gene regulatory network inference analysis |
| Find out the significant the regulons (TFs) and the target genes of each regulon across cell types for different disease states |
| TF | Cell Type | Tissue | Disease Stage | Target Gene | RSS | Regulon Activity |
| ∗The dot plots of a searched regulon are shown for all cell subpopulations in each disease state of each tissue based on the regulon specific score inferred using pySCENIC and by calculating the average expression. |
| Page: 1 |
Top |
Somatic mutation of malignant transformation related genes |
| Annotation of somatic variants for genes involved in malignant transformation |
| Hugo Symbol | Variant Class | Variant Classification | dbSNP RS | HGVSc | HGVSp | HGVSp Short | SWISSPROT | BIOTYPE | SIFT | PolyPhen | Tumor Sample Barcode | Tissue | Histology | Sex | Age | Stage | Therapy Types | Drugs | Outcome |
| RAB21 | SNV | Missense_Mutation | rs867698104 | c.452C>T | p.Ala151Val | p.A151V | Q9UL25 | protein_coding | deleterious(0) | probably_damaging(0.992) | TCGA-A8-A08B-01 | Breast | breast invasive carcinoma | Female | <65 | I/II | Chemotherapy | 5-fluorouracil | CR |
| RAB21 | SNV | Missense_Mutation | c.398N>G | p.Lys133Arg | p.K133R | Q9UL25 | protein_coding | deleterious(0) | probably_damaging(0.999) | TCGA-AC-A23H-01 | Breast | breast invasive carcinoma | Female | >=65 | I/II | Unknown | Unknown | PD | |
| RAB21 | SNV | Missense_Mutation | rs764554005 | c.506T>C | p.Ile169Thr | p.I169T | Q9UL25 | protein_coding | deleterious(0) | probably_damaging(0.993) | TCGA-E2-A14V-01 | Breast | breast invasive carcinoma | Female | <65 | I/II | Chemotherapy | cyclophosphamide | SD |
| RAB21 | SNV | Missense_Mutation | c.155T>C | p.Leu52Pro | p.L52P | Q9UL25 | protein_coding | deleterious(0) | probably_damaging(0.973) | TCGA-E9-A1R3-01 | Breast | breast invasive carcinoma | Female | >=65 | III/IV | Chemotherapy | methotrexate | SD | |
| RAB21 | SNV | Missense_Mutation | novel | c.503N>A | p.Gly168Glu | p.G168E | Q9UL25 | protein_coding | deleterious(0) | probably_damaging(0.999) | TCGA-AA-3984-01 | Colorectum | colon adenocarcinoma | Female | <65 | I/II | Unknown | Unknown | SD |
| RAB21 | SNV | Missense_Mutation | rs750306178 | c.132N>G | p.Phe44Leu | p.F44L | Q9UL25 | protein_coding | deleterious(0) | probably_damaging(0.985) | TCGA-AZ-6601-01 | Colorectum | colon adenocarcinoma | Male | >=65 | I/II | Unknown | Unknown | PD |
| RAB21 | SNV | Missense_Mutation | c.49N>T | p.Ala17Ser | p.A17S | Q9UL25 | protein_coding | tolerated(1) | benign(0) | TCGA-DM-A1HB-01 | Colorectum | colon adenocarcinoma | Male | >=65 | III/IV | Unknown | Unknown | SD | |
| RAB21 | SNV | Missense_Mutation | novel | c.513A>C | p.Glu171Asp | p.E171D | Q9UL25 | protein_coding | tolerated(0.16) | benign(0.062) | TCGA-A5-A0G2-01 | Endometrium | uterine corpus endometrioid carcinoma | Female | <65 | III/IV | Unknown | Unknown | SD |
| RAB21 | SNV | Missense_Mutation | novel | c.269G>A | p.Arg90Lys | p.R90K | Q9UL25 | protein_coding | deleterious(0) | probably_damaging(0.922) | TCGA-A5-A1OF-01 | Endometrium | uterine corpus endometrioid carcinoma | Female | <65 | I/II | Unknown | Unknown | SD |
| RAB21 | SNV | Missense_Mutation | c.524A>C | p.Asp175Ala | p.D175A | Q9UL25 | protein_coding | tolerated(0.11) | benign(0.038) | TCGA-AP-A056-01 | Endometrium | uterine corpus endometrioid carcinoma | Female | <65 | I/II | Unknown | Unknown | SD |
| Page: 1 2 |
Top |
Related drugs of malignant transformation related genes |
| Identification of chemicals and drugs interact with genes involved in malignant transfromation |
| (DGIdb 4.0) |
| Entrez ID | Symbol | Category | Interaction Types | Drug Claim Name | Drug Name | PMIDs |
| Page: 1 |

Copyright 2023-Present -The University of Texas Health Science Center at Houston |