
|
|||||
|
 | |
| |
| |
| |
| |
| |
|
Gene: RAB1B |
Gene summary for RAB1B |
| Gene information | Species | Human | Gene symbol | RAB1B | Gene ID | 81876 |
| Gene name | RAB1B, member RAS oncogene family | |
| Gene Alias | RAB1B | |
| Cytomap | 11q13.2 | |
| Gene Type | protein-coding | GO ID | GO:0000045 | UniProtAcc | Q9H0U4 |
Top |
Malignant transformation analysis |
| Identification of the aberrant gene expression in precancerous and cancerous lesions by comparing the gene expression of stem-like cells in diseased tissues with normal stem cells |
| Entrez ID | Symbol | Replicates | Species | Organ | Tissue | Adj P-value | Log2FC | Malignancy |
| 81876 | RAB1B | LZE2T | Human | Esophagus | ESCC | 9.71e-06 | 7.58e-01 | 0.082 |
| 81876 | RAB1B | LZE4T | Human | Esophagus | ESCC | 3.31e-14 | 4.95e-01 | 0.0811 |
| 81876 | RAB1B | LZE5T | Human | Esophagus | ESCC | 2.90e-04 | 4.41e-01 | 0.0514 |
| 81876 | RAB1B | LZE7T | Human | Esophagus | ESCC | 3.89e-07 | 7.24e-01 | 0.0667 |
| 81876 | RAB1B | LZE8T | Human | Esophagus | ESCC | 4.98e-14 | 5.78e-01 | 0.067 |
| 81876 | RAB1B | LZE20T | Human | Esophagus | ESCC | 6.12e-23 | 1.36e+00 | 0.0662 |
| 81876 | RAB1B | LZE22D1 | Human | Esophagus | HGIN | 2.90e-05 | 2.28e-01 | 0.0595 |
| 81876 | RAB1B | LZE22T | Human | Esophagus | ESCC | 1.49e-05 | 9.90e-01 | 0.068 |
| 81876 | RAB1B | LZE24T | Human | Esophagus | ESCC | 4.26e-21 | 8.16e-01 | 0.0596 |
| 81876 | RAB1B | LZE6T | Human | Esophagus | ESCC | 2.93e-06 | 7.15e-01 | 0.0845 |
| 81876 | RAB1B | P1T-E | Human | Esophagus | ESCC | 1.10e-07 | 7.57e-01 | 0.0875 |
| 81876 | RAB1B | P2T-E | Human | Esophagus | ESCC | 1.26e-38 | 8.99e-01 | 0.1177 |
| 81876 | RAB1B | P4T-E | Human | Esophagus | ESCC | 9.81e-46 | 1.37e+00 | 0.1323 |
| 81876 | RAB1B | P5T-E | Human | Esophagus | ESCC | 5.70e-43 | 1.23e+00 | 0.1327 |
| 81876 | RAB1B | P8T-E | Human | Esophagus | ESCC | 1.85e-67 | 1.60e+00 | 0.0889 |
| 81876 | RAB1B | P9T-E | Human | Esophagus | ESCC | 6.88e-27 | 7.39e-01 | 0.1131 |
| 81876 | RAB1B | P10T-E | Human | Esophagus | ESCC | 1.30e-45 | 1.02e+00 | 0.116 |
| 81876 | RAB1B | P11T-E | Human | Esophagus | ESCC | 4.62e-27 | 1.41e+00 | 0.1426 |
| 81876 | RAB1B | P12T-E | Human | Esophagus | ESCC | 2.61e-20 | 7.00e-01 | 0.1122 |
| 81876 | RAB1B | P15T-E | Human | Esophagus | ESCC | 1.56e-38 | 1.15e+00 | 0.1149 |
| Page: 1 2 3 4 5 6 7 |
| Tissue | Expression Dynamics | Abbreviation |
| Esophagus | 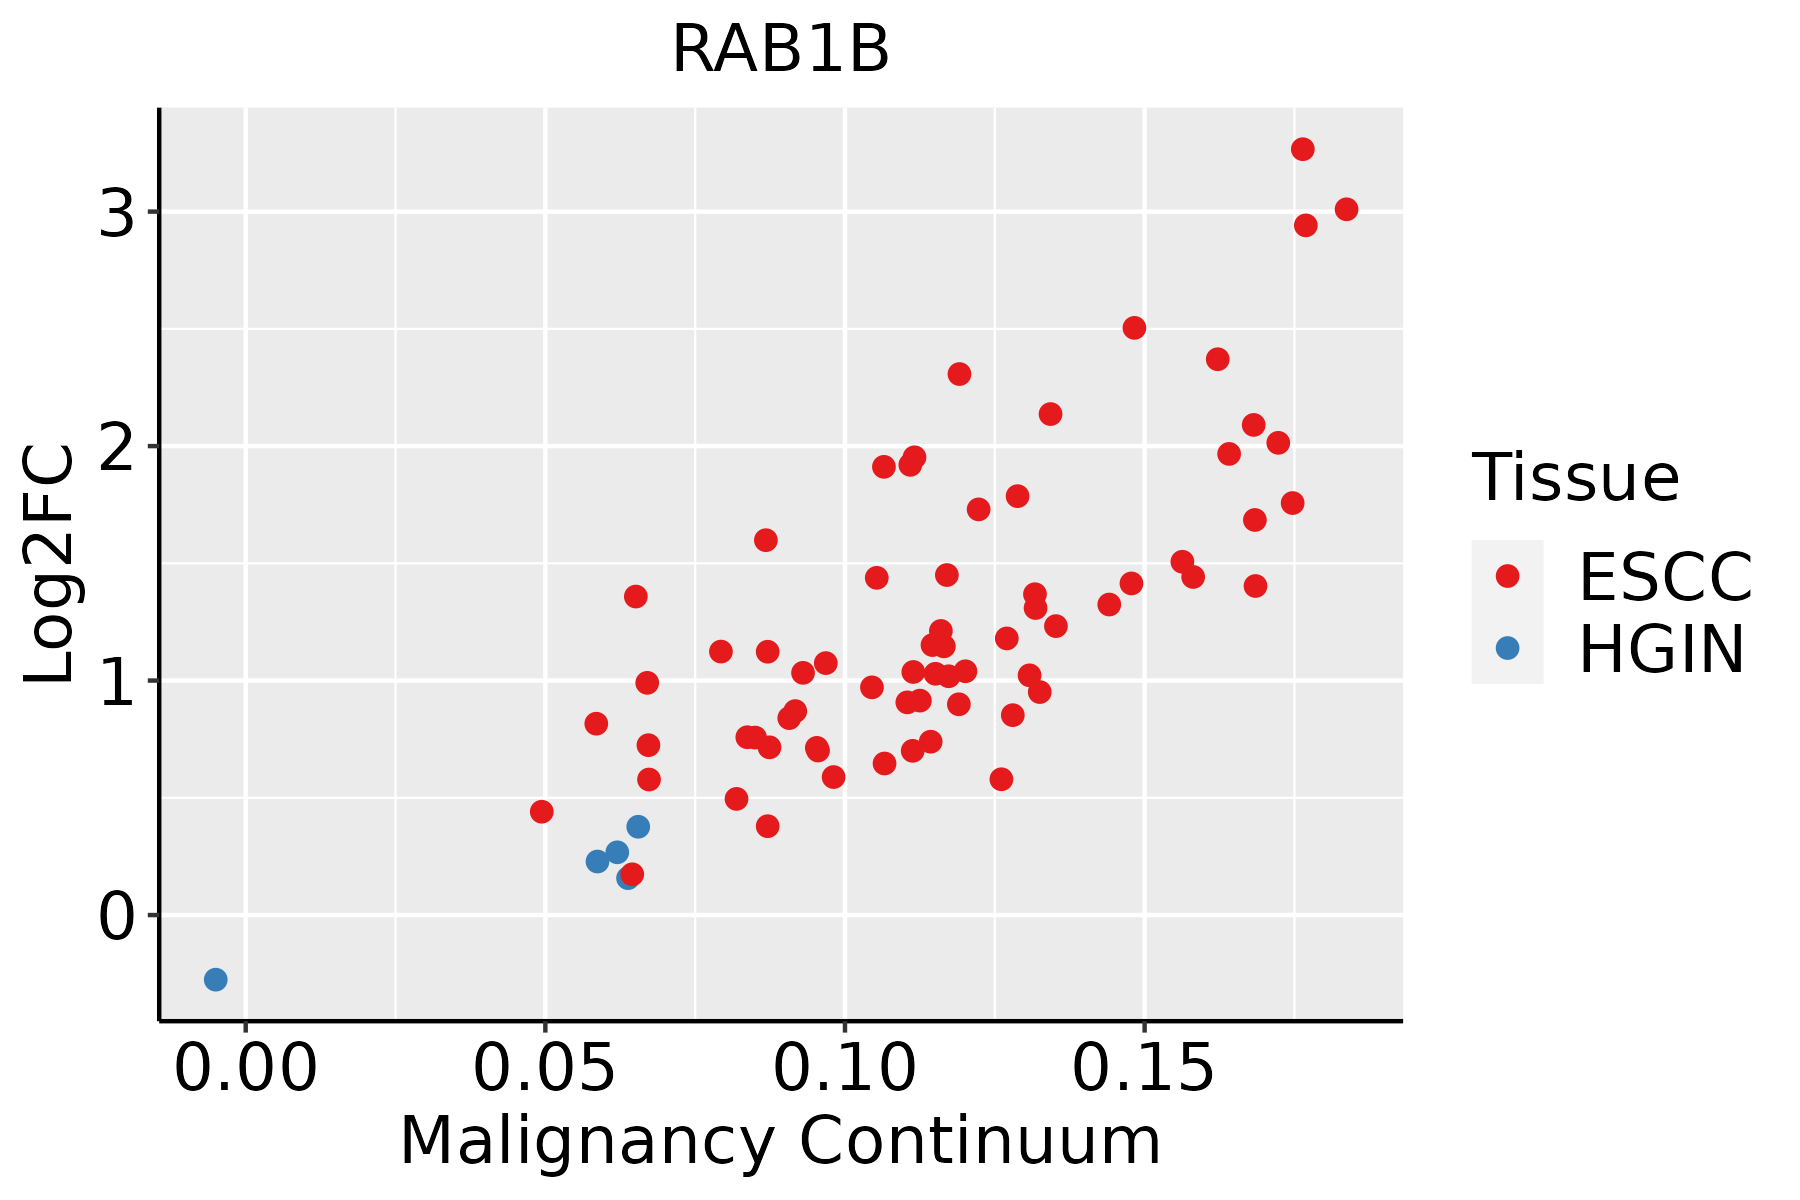 | ESCC: Esophageal squamous cell carcinoma |
| HGIN: High-grade intraepithelial neoplasias | ||
| LGIN: Low-grade intraepithelial neoplasias | ||
| Liver | 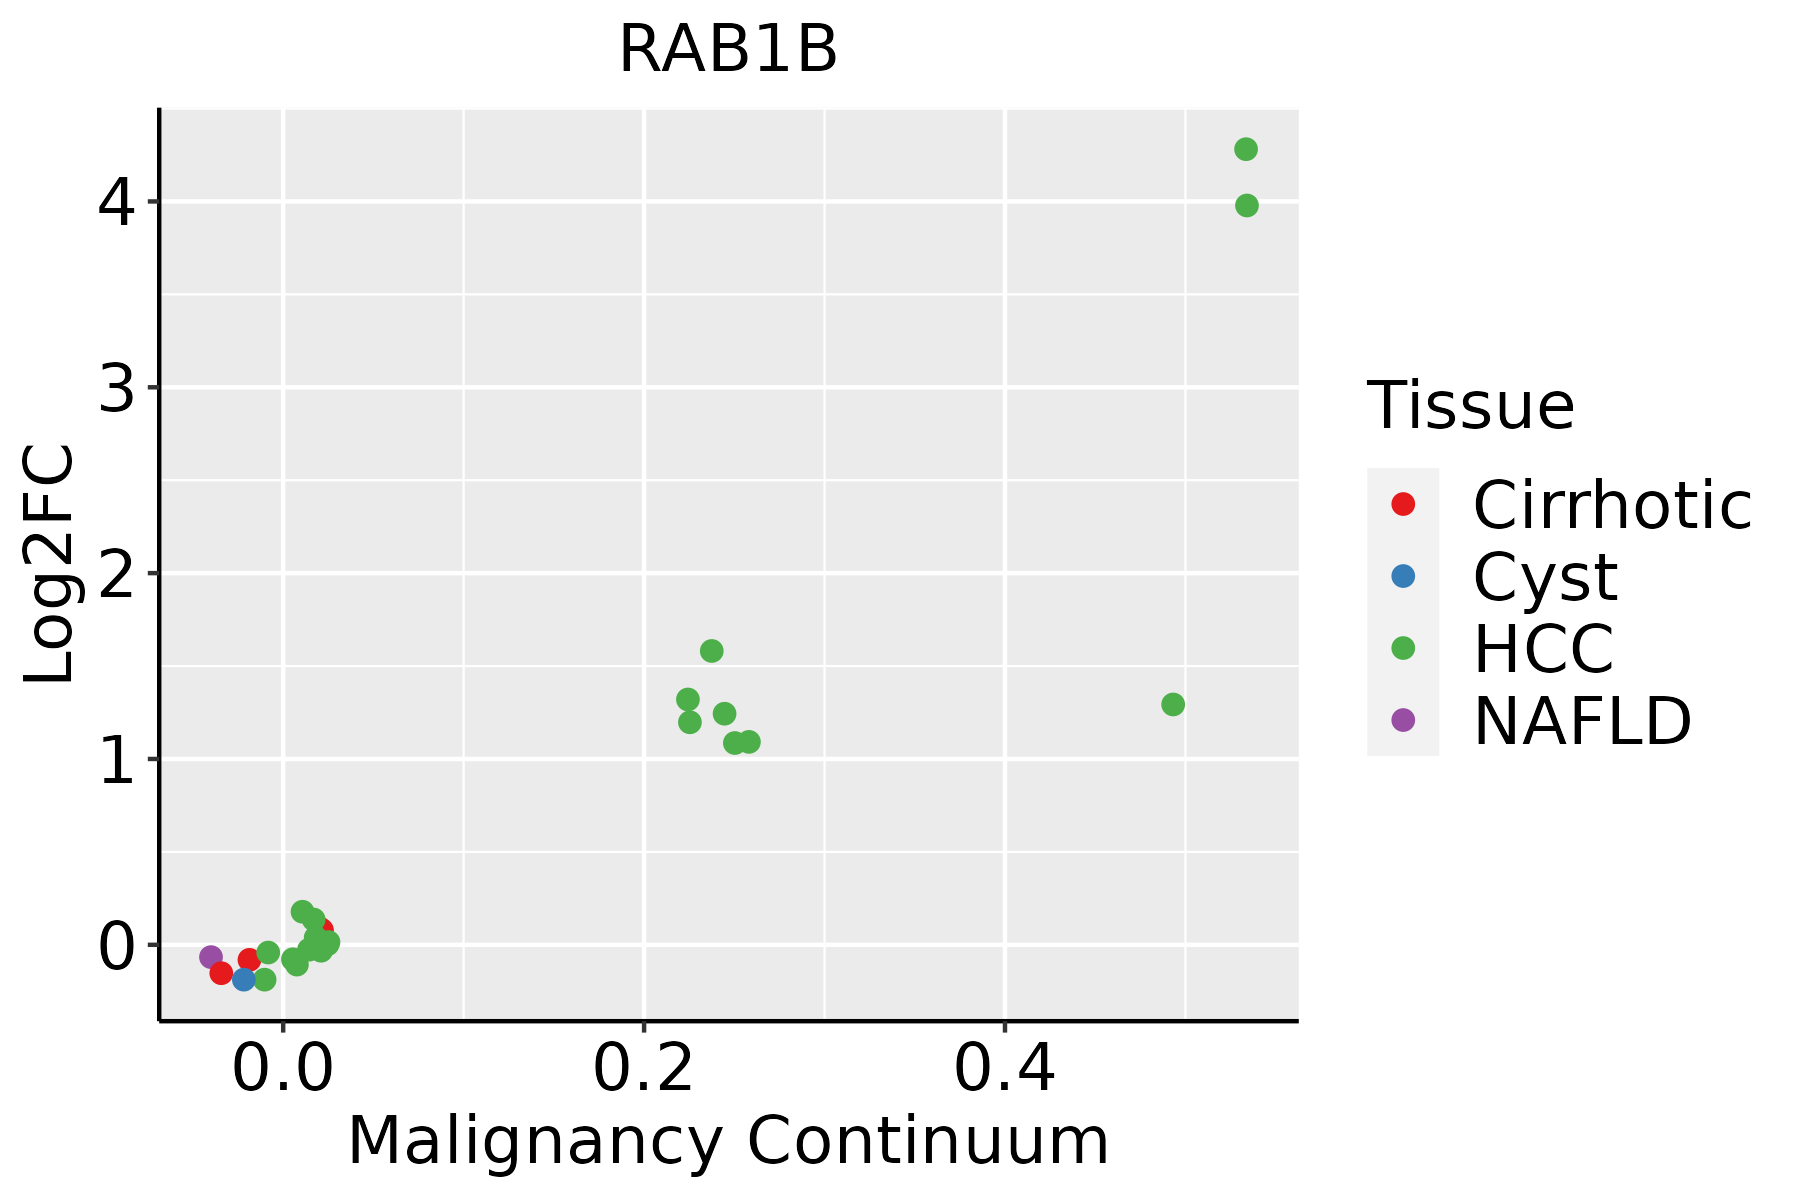 | HCC: Hepatocellular carcinoma |
| NAFLD: Non-alcoholic fatty liver disease | ||
| Oral Cavity | 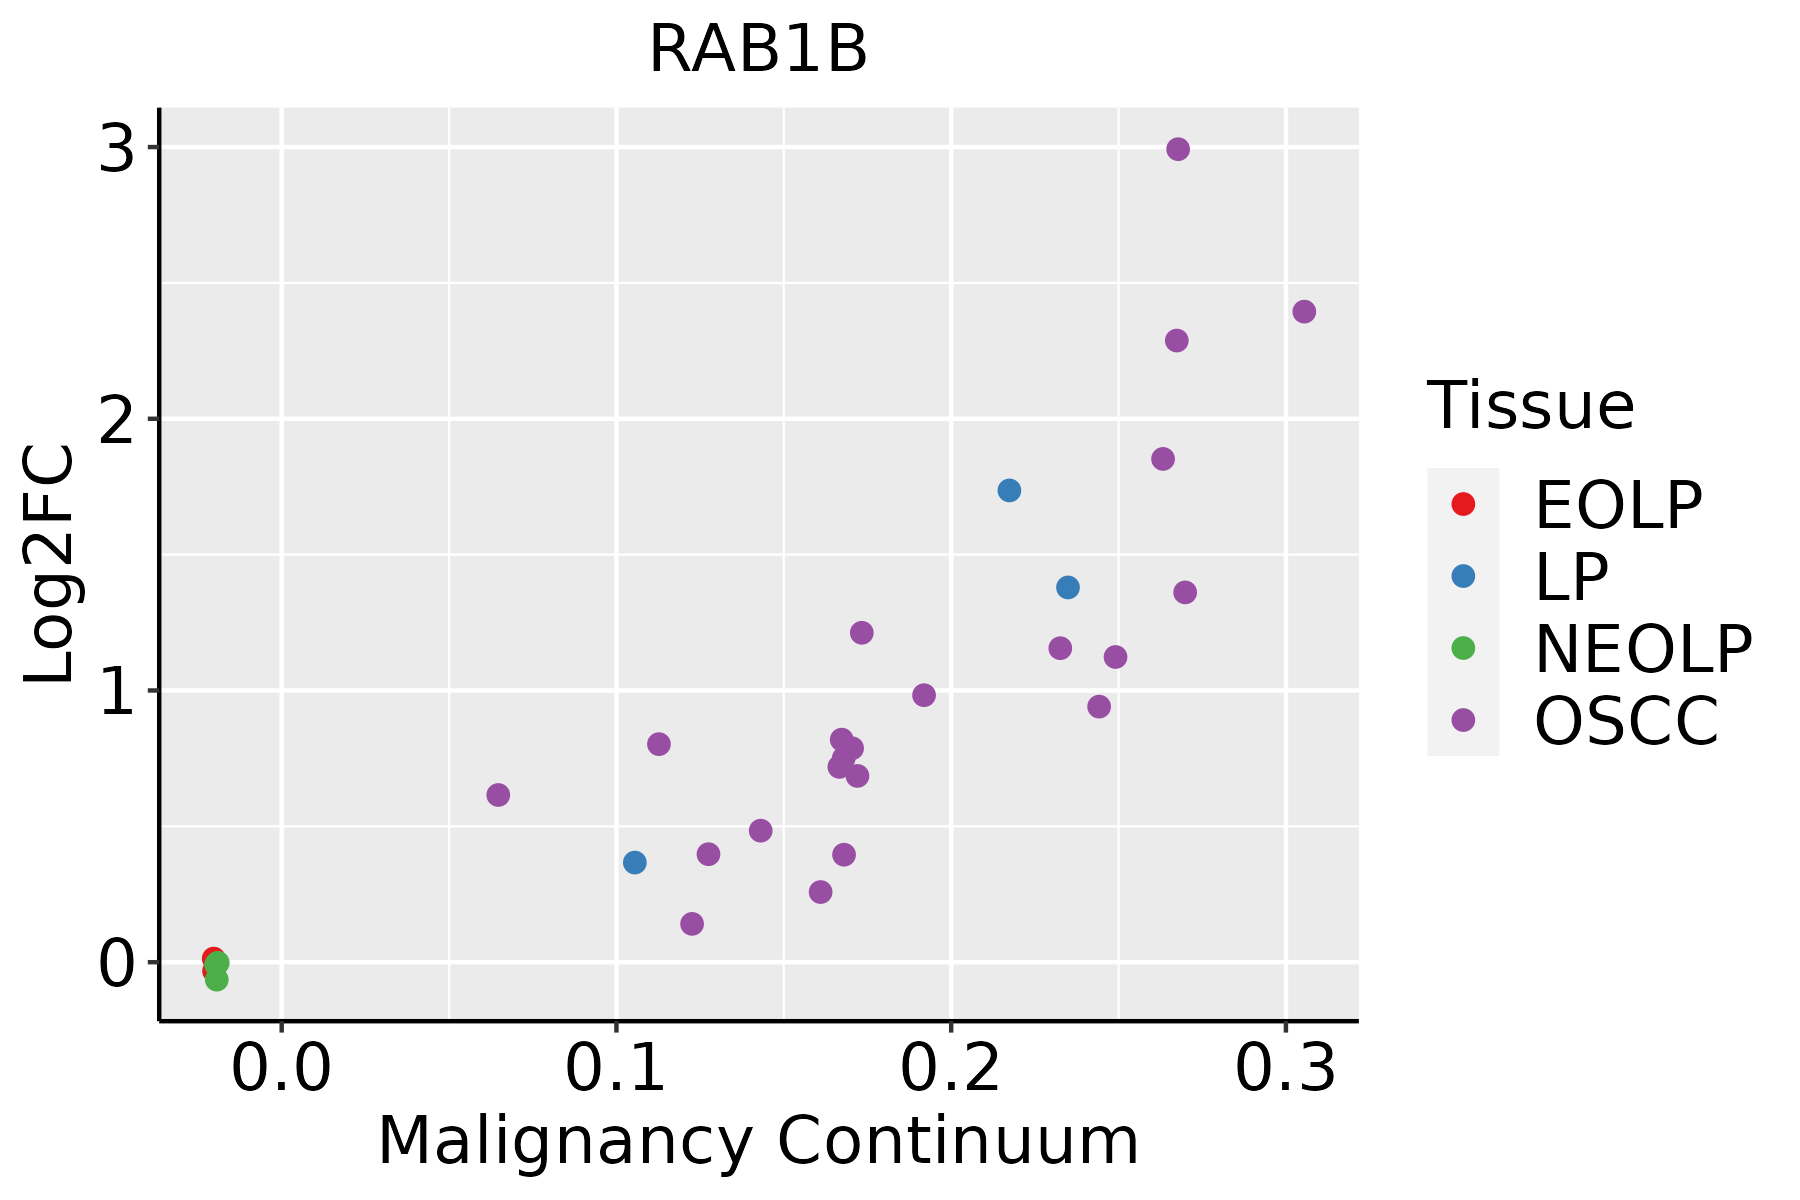 | EOLP: Erosive Oral lichen planus |
| LP: leukoplakia | ||
| NEOLP: Non-erosive oral lichen planus | ||
| OSCC: Oral squamous cell carcinoma | ||
| Skin |  | AK: Actinic keratosis |
| cSCC: Cutaneous squamous cell carcinoma | ||
| SCCIS:squamous cell carcinoma in situ | ||
| Thyroid | 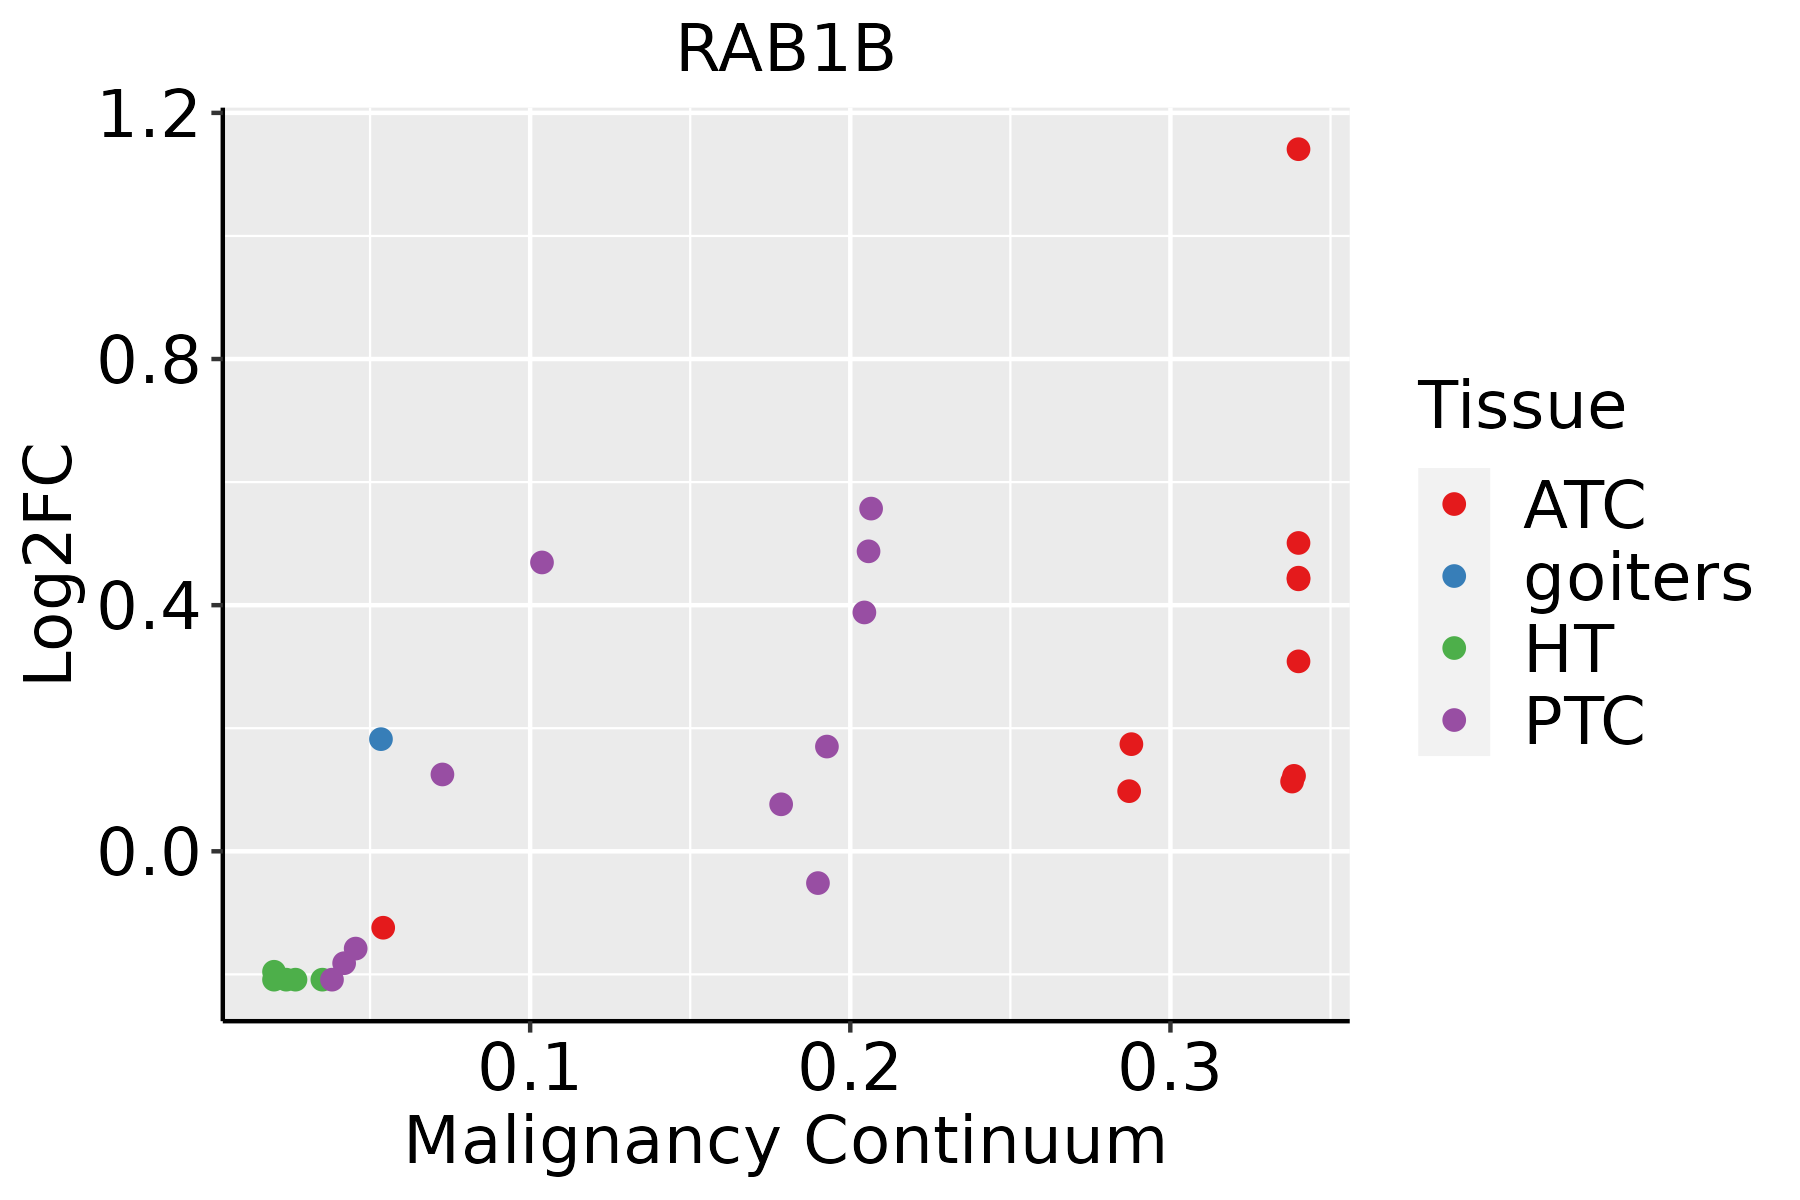 | ATC: Anaplastic thyroid cancer |
| HT: Hashimoto's thyroiditis | ||
| PTC: Papillary thyroid cancer |
| ∗log2FC in expression of this searched gene in stem-like cells from each diseased tissue sample relative to stem-like cells in normal samples in each tissue plotted against the malignancy continuum. Samples are colored based on if they are from different disease stage. |
Top |
Malignant transformation related pathway analysis |
| Find out the enriched GO biological processes and KEGG pathways involved in transition from healthy to precancer to cancer |
| Tissue | Disease Stage | Enriched GO biological Processes |
| Colorectum | AD |  |
| Colorectum | SER |  |
| Colorectum | MSS |  |
| Colorectum | MSI-H |  |
| Colorectum | FAP |  |
| ∗Top 15 enriched GO BP terms are showed in the bar plot of each disease state in each tissue. Each row represents a significant GO biological process which is colored according to the -log10(p.adjust). |
| Page: 1 2 3 4 5 6 7 8 9 |
| GO ID | Tissue | Disease Stage | Description | Gene Ratio | Bg Ratio | pvalue | p.adjust | Count |
| GO:001603227 | Esophagus | HGIN | viral process | 118/2587 | 415/18723 | 3.01e-15 | 6.22e-13 | 118 |
| GO:001905827 | Esophagus | HGIN | viral life cycle | 93/2587 | 317/18723 | 3.66e-13 | 5.63e-11 | 93 |
| GO:004819317 | Esophagus | HGIN | Golgi vesicle transport | 83/2587 | 296/18723 | 8.59e-11 | 8.89e-09 | 83 |
| GO:001623616 | Esophagus | HGIN | macroautophagy | 77/2587 | 291/18723 | 7.15e-09 | 4.61e-07 | 77 |
| GO:00068889 | Esophagus | HGIN | endoplasmic reticulum to Golgi vesicle-mediated transport | 40/2587 | 130/18723 | 4.67e-07 | 2.07e-05 | 40 |
| GO:19021156 | Esophagus | HGIN | regulation of organelle assembly | 46/2587 | 186/18723 | 4.63e-05 | 1.12e-03 | 46 |
| GO:00070336 | Esophagus | HGIN | vacuole organization | 44/2587 | 180/18723 | 8.97e-05 | 1.96e-03 | 44 |
| GO:19050375 | Esophagus | HGIN | autophagosome organization | 28/2587 | 103/18723 | 2.58e-04 | 4.53e-03 | 28 |
| GO:00190687 | Esophagus | HGIN | virion assembly | 13/2587 | 35/18723 | 4.89e-04 | 7.14e-03 | 13 |
| GO:00440884 | Esophagus | HGIN | regulation of vacuole organization | 15/2587 | 45/18723 | 7.05e-04 | 9.52e-03 | 15 |
| GO:00000455 | Esophagus | HGIN | autophagosome assembly | 26/2587 | 99/18723 | 7.45e-04 | 9.90e-03 | 26 |
| GO:20007853 | Esophagus | HGIN | regulation of autophagosome assembly | 12/2587 | 39/18723 | 4.97e-03 | 4.18e-02 | 12 |
| GO:004819318 | Esophagus | ESCC | Golgi vesicle transport | 231/8552 | 296/18723 | 1.82e-30 | 9.63e-28 | 231 |
| GO:0016032111 | Esophagus | ESCC | viral process | 301/8552 | 415/18723 | 3.34e-29 | 1.32e-26 | 301 |
| GO:001623617 | Esophagus | ESCC | macroautophagy | 216/8552 | 291/18723 | 1.94e-23 | 4.57e-21 | 216 |
| GO:0019058111 | Esophagus | ESCC | viral life cycle | 226/8552 | 317/18723 | 1.17e-20 | 1.76e-18 | 226 |
| GO:000688815 | Esophagus | ESCC | endoplasmic reticulum to Golgi vesicle-mediated transport | 102/8552 | 130/18723 | 1.73e-14 | 9.22e-13 | 102 |
| GO:000703314 | Esophagus | ESCC | vacuole organization | 127/8552 | 180/18723 | 1.04e-11 | 3.85e-10 | 127 |
| GO:001906815 | Esophagus | ESCC | virion assembly | 31/8552 | 35/18723 | 1.40e-07 | 2.25e-06 | 31 |
| GO:190503712 | Esophagus | ESCC | autophagosome organization | 73/8552 | 103/18723 | 1.88e-07 | 2.93e-06 | 73 |
| Page: 1 2 3 4 5 6 7 |
| Pathway ID | Tissue | Disease Stage | Description | Gene Ratio | Bg Ratio | pvalue | p.adjust | qvalue | Count |
| hsa0513427 | Esophagus | HGIN | Legionellosis | 18/1383 | 57/8465 | 3.20e-03 | 2.54e-02 | 2.02e-02 | 18 |
| hsa05134112 | Esophagus | HGIN | Legionellosis | 18/1383 | 57/8465 | 3.20e-03 | 2.54e-02 | 2.02e-02 | 18 |
| hsa0513428 | Esophagus | ESCC | Legionellosis | 42/4205 | 57/8465 | 1.83e-04 | 6.90e-04 | 3.53e-04 | 42 |
| hsa0513436 | Esophagus | ESCC | Legionellosis | 42/4205 | 57/8465 | 1.83e-04 | 6.90e-04 | 3.53e-04 | 42 |
| hsa0513412 | Liver | Cirrhotic | Legionellosis | 28/2530 | 57/8465 | 1.71e-03 | 8.01e-03 | 4.94e-03 | 28 |
| hsa0513413 | Liver | Cirrhotic | Legionellosis | 28/2530 | 57/8465 | 1.71e-03 | 8.01e-03 | 4.94e-03 | 28 |
| hsa0513425 | Oral cavity | OSCC | Legionellosis | 42/3704 | 57/8465 | 4.18e-06 | 2.15e-05 | 1.10e-05 | 42 |
| hsa05134111 | Oral cavity | OSCC | Legionellosis | 42/3704 | 57/8465 | 4.18e-06 | 2.15e-05 | 1.10e-05 | 42 |
| hsa0513426 | Oral cavity | LP | Legionellosis | 33/2418 | 57/8465 | 3.29e-06 | 3.23e-05 | 2.08e-05 | 33 |
| hsa0513435 | Oral cavity | LP | Legionellosis | 33/2418 | 57/8465 | 3.29e-06 | 3.23e-05 | 2.08e-05 | 33 |
| Page: 1 |
Top |
Cell-cell communication analysis |
| Identification of potential cell-cell interactions between two cell types and their ligand-receptor pairs for different disease states |
| Ligand | Receptor | LRpair | Pathway | Tissue | Disease Stage |
| Page: 1 |
Top |
Single-cell gene regulatory network inference analysis |
| Find out the significant the regulons (TFs) and the target genes of each regulon across cell types for different disease states |
| TF | Cell Type | Tissue | Disease Stage | Target Gene | RSS | Regulon Activity |
| ∗The dot plots of a searched regulon are shown for all cell subpopulations in each disease state of each tissue based on the regulon specific score inferred using pySCENIC and by calculating the average expression. |
| Page: 1 |
Top |
Somatic mutation of malignant transformation related genes |
| Annotation of somatic variants for genes involved in malignant transformation |
| Hugo Symbol | Variant Class | Variant Classification | dbSNP RS | HGVSc | HGVSp | HGVSp Short | SWISSPROT | BIOTYPE | SIFT | PolyPhen | Tumor Sample Barcode | Tissue | Histology | Sex | Age | Stage | Therapy Types | Drugs | Outcome |
| RAB1B | SNV | Missense_Mutation | c.502N>A | p.Glu168Lys | p.E168K | Q9H0U4 | protein_coding | deleterious(0.05) | benign(0.084) | TCGA-GM-A2D9-01 | Breast | breast invasive carcinoma | Female | >=65 | I/II | Hormone Therapy | arimidex | SD | |
| RAB1B | insertion | Nonsense_Mutation | novel | c.157_158insGAAGATCACTTTGAGCCCGC | p.Asp53GlyfsTer5 | p.D53Gfs*5 | Q9H0U4 | protein_coding | TCGA-A2-A0D1-01 | Breast | breast invasive carcinoma | Female | >=65 | I/II | Chemotherapy | taxotere | SD | ||
| RAB1B | insertion | Frame_Shift_Ins | novel | c.183_183+1insCACCTGGG | p.Trp62HisfsTer41 | p.W62Hfs*41 | Q9H0U4 | protein_coding | TCGA-A7-A0CE-01 | Breast | breast invasive carcinoma | Female | <65 | I/II | Chemotherapy | adriamycin | SD | ||
| RAB1B | SNV | Missense_Mutation | rs778177996 | c.544N>A | p.Glu182Lys | p.E182K | Q9H0U4 | protein_coding | tolerated(0.79) | benign(0) | TCGA-C5-A901-01 | Cervix | cervical & endocervical cancer | Female | <65 | I/II | Unknown | Unknown | SD |
| RAB1B | SNV | Missense_Mutation | c.235N>T | p.Arg79Trp | p.R79W | Q9H0U4 | protein_coding | deleterious(0) | probably_damaging(0.999) | TCGA-IR-A3LH-01 | Cervix | cervical & endocervical cancer | Female | <65 | I/II | Chemotherapy | cisplatin | CR | |
| RAB1B | SNV | Missense_Mutation | c.80N>A | p.Arg27Gln | p.R27Q | Q9H0U4 | protein_coding | deleterious(0.01) | possibly_damaging(0.861) | TCGA-A6-5665-01 | Colorectum | colon adenocarcinoma | Female | >=65 | I/II | Unknown | Unknown | PD | |
| RAB1B | SNV | Missense_Mutation | c.155T>C | p.Leu52Pro | p.L52P | Q9H0U4 | protein_coding | deleterious(0) | probably_damaging(0.985) | TCGA-AA-3811-01 | Colorectum | colon adenocarcinoma | Female | >=65 | III/IV | Unknown | Unknown | PD | |
| RAB1B | SNV | Missense_Mutation | rs765898903 | c.514N>T | p.Arg172Trp | p.R172W | Q9H0U4 | protein_coding | deleterious(0) | benign(0.11) | TCGA-AA-A01R-01 | Colorectum | colon adenocarcinoma | Male | <65 | III/IV | Chemotherapy | 5-fluorouracil | PD |
| RAB1B | SNV | Missense_Mutation | novel | c.212N>A | p.Arg71Gln | p.R71Q | Q9H0U4 | protein_coding | deleterious(0.01) | possibly_damaging(0.743) | TCGA-A5-A0G2-01 | Endometrium | uterine corpus endometrioid carcinoma | Female | <65 | III/IV | Unknown | Unknown | SD |
| RAB1B | SNV | Missense_Mutation | novel | c.95N>T | p.Thr32Met | p.T32M | Q9H0U4 | protein_coding | deleterious(0.02) | possibly_damaging(0.571) | TCGA-AJ-A3OJ-01 | Endometrium | uterine corpus endometrioid carcinoma | Female | <65 | I/II | Chemotherapy | carboplatin | CR |
| Page: 1 2 3 |
Top |
Related drugs of malignant transformation related genes |
| Identification of chemicals and drugs interact with genes involved in malignant transfromation |
| (DGIdb 4.0) |
| Entrez ID | Symbol | Category | Interaction Types | Drug Claim Name | Drug Name | PMIDs |
| Page: 1 |

Copyright 2023-Present -The University of Texas Health Science Center at Houston |