
|
|||||
|
 | |
| |
| |
| |
| |
| |
|
Gene: RAB1A |
Gene summary for RAB1A |
| Gene information | Species | Human | Gene symbol | RAB1A | Gene ID | 5861 |
| Gene name | RAB1A, member RAS oncogene family | |
| Gene Alias | RAB1 | |
| Cytomap | 2p14 | |
| Gene Type | protein-coding | GO ID | GO:0000045 | UniProtAcc | P62820 |
Top |
Malignant transformation analysis |
| Identification of the aberrant gene expression in precancerous and cancerous lesions by comparing the gene expression of stem-like cells in diseased tissues with normal stem cells |
| Entrez ID | Symbol | Replicates | Species | Organ | Tissue | Adj P-value | Log2FC | Malignancy |
| 5861 | RAB1A | GSM4909281 | Human | Breast | IDC | 5.61e-06 | 3.83e-01 | 0.21 |
| 5861 | RAB1A | GSM4909285 | Human | Breast | IDC | 1.76e-02 | 2.87e-01 | 0.21 |
| 5861 | RAB1A | GSM4909286 | Human | Breast | IDC | 1.83e-04 | -2.91e-01 | 0.1081 |
| 5861 | RAB1A | GSM4909288 | Human | Breast | IDC | 9.77e-03 | -9.88e-02 | 0.0988 |
| 5861 | RAB1A | GSM4909294 | Human | Breast | IDC | 5.56e-05 | -2.40e-01 | 0.2022 |
| 5861 | RAB1A | GSM4909296 | Human | Breast | IDC | 5.97e-11 | -2.49e-01 | 0.1524 |
| 5861 | RAB1A | GSM4909297 | Human | Breast | IDC | 7.91e-11 | -2.49e-01 | 0.1517 |
| 5861 | RAB1A | GSM4909301 | Human | Breast | IDC | 3.12e-02 | -1.69e-01 | 0.1577 |
| 5861 | RAB1A | GSM4909302 | Human | Breast | IDC | 1.42e-03 | -2.64e-01 | 0.1545 |
| 5861 | RAB1A | GSM4909309 | Human | Breast | IDC | 2.11e-02 | -1.86e-01 | 0.0483 |
| 5861 | RAB1A | GSM4909311 | Human | Breast | IDC | 2.08e-32 | -5.25e-01 | 0.1534 |
| 5861 | RAB1A | GSM4909312 | Human | Breast | IDC | 2.21e-10 | -1.21e-01 | 0.1552 |
| 5861 | RAB1A | GSM4909319 | Human | Breast | IDC | 3.38e-42 | -3.79e-01 | 0.1563 |
| 5861 | RAB1A | GSM4909320 | Human | Breast | IDC | 2.19e-11 | -5.64e-01 | 0.1575 |
| 5861 | RAB1A | GSM4909321 | Human | Breast | IDC | 3.70e-16 | -2.56e-01 | 0.1559 |
| 5861 | RAB1A | ctrl6 | Human | Breast | Precancer | 2.29e-03 | 4.30e-01 | -0.0061 |
| 5861 | RAB1A | brca2 | Human | Breast | Precancer | 7.40e-04 | 3.13e-01 | -0.024 |
| 5861 | RAB1A | brca3 | Human | Breast | Precancer | 2.58e-07 | 3.20e-01 | -0.0263 |
| 5861 | RAB1A | M2 | Human | Breast | IDC | 2.69e-02 | 4.13e-02 | 0.21 |
| 5861 | RAB1A | NCCBC14 | Human | Breast | DCIS | 3.45e-09 | -4.17e-02 | 0.2021 |
| Page: 1 2 3 4 5 6 7 8 9 10 11 12 13 |
| Tissue | Expression Dynamics | Abbreviation |
| Breast | 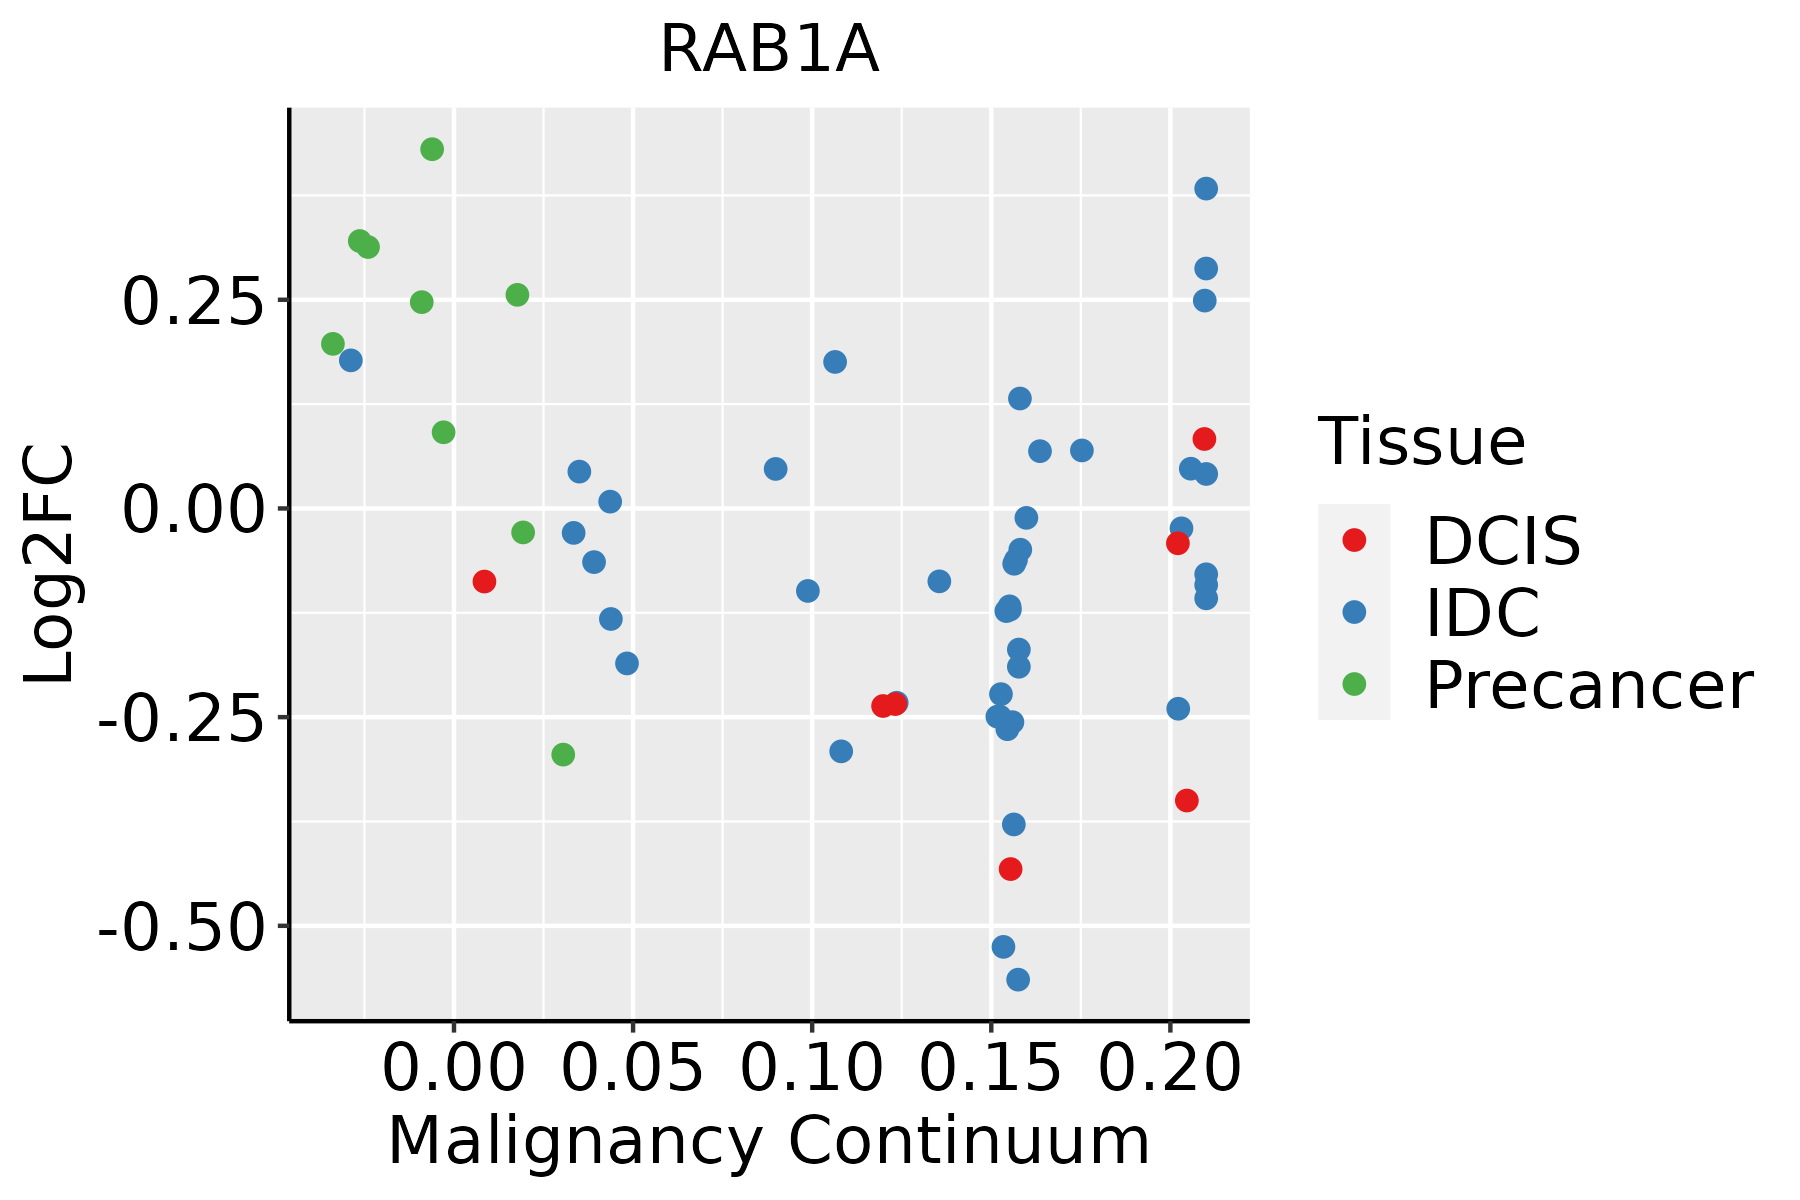 | IDC: Invasive ductal carcinoma |
| DCIS: Ductal carcinoma in situ | ||
| Precancer(BRCA1-mut): Precancerous lesion from BRCA1 mutation carriers | ||
| Cervix | 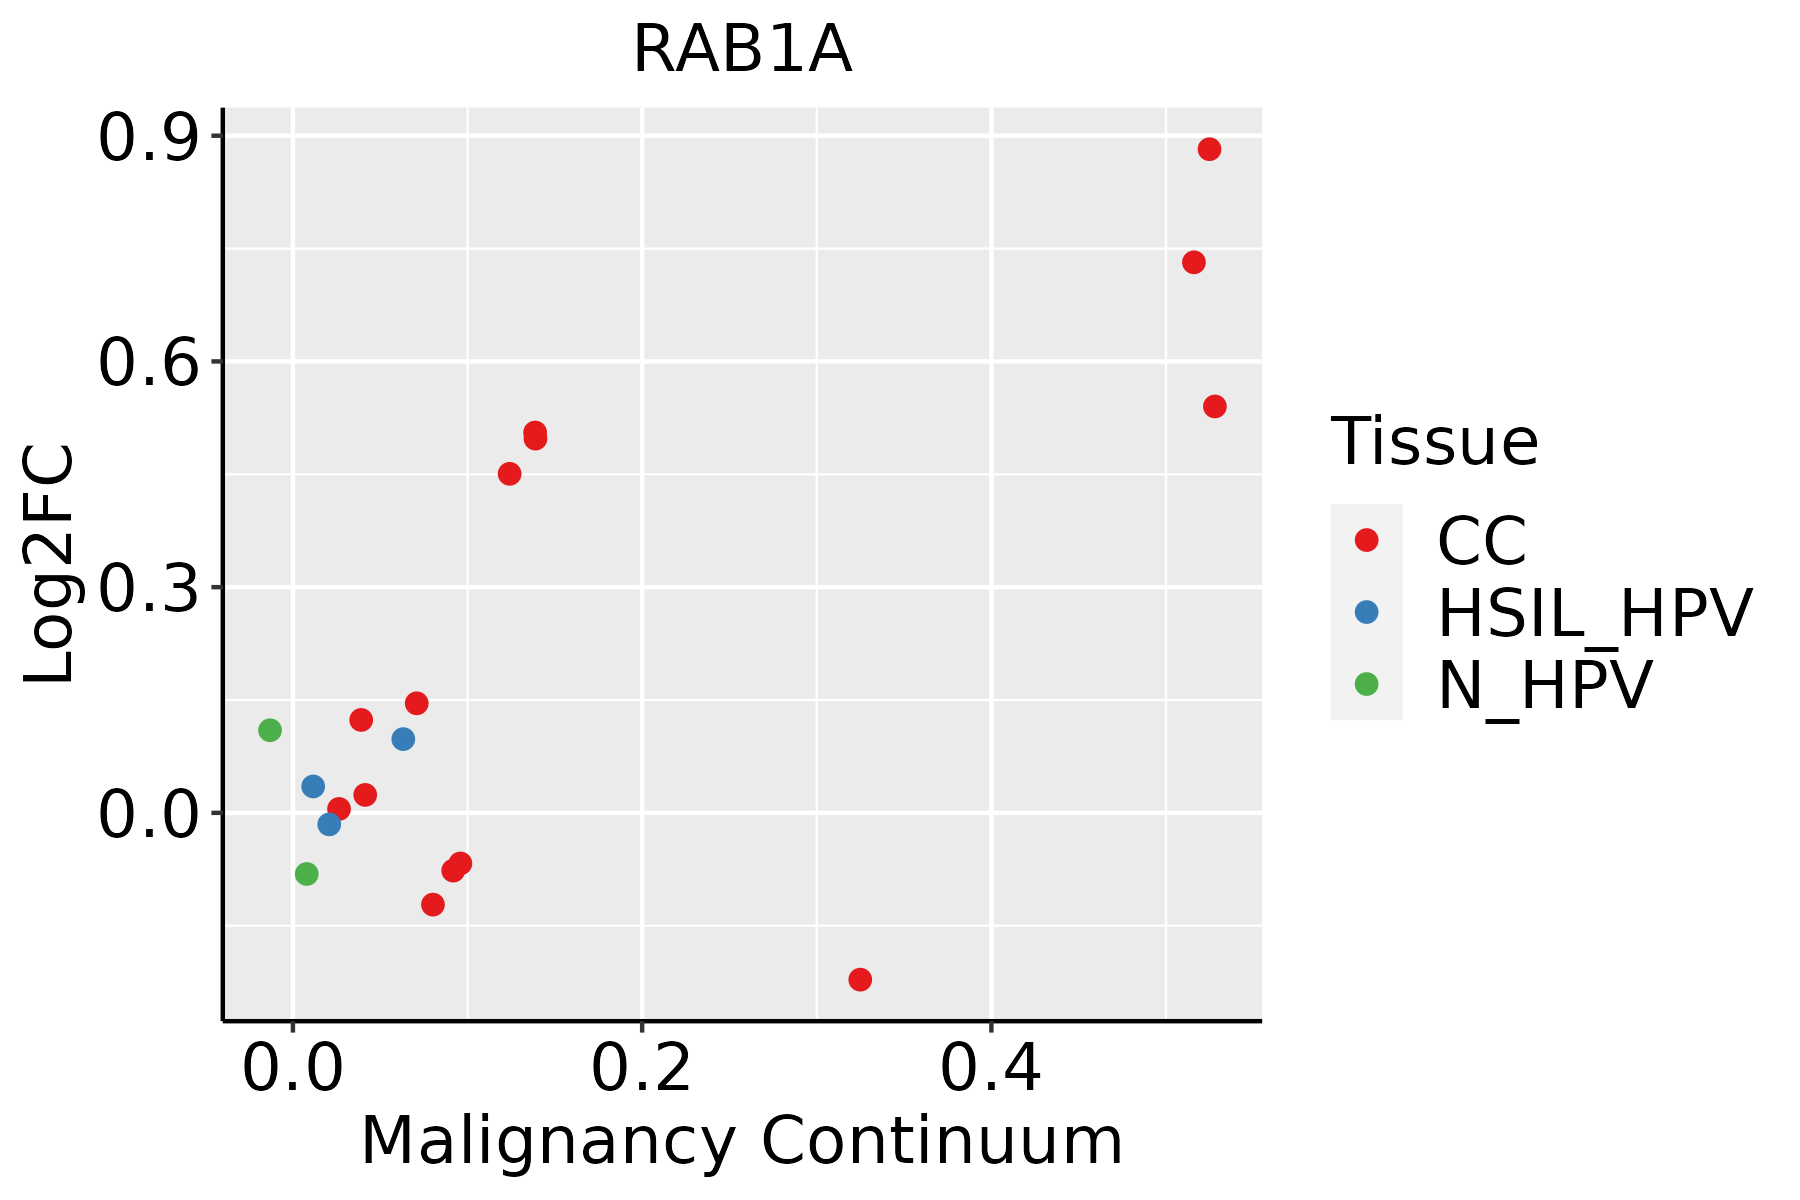 | CC: Cervix cancer |
| HSIL_HPV: HPV-infected high-grade squamous intraepithelial lesions | ||
| N_HPV: HPV-infected normal cervix | ||
| Colorectum (GSE201348) |  | FAP: Familial adenomatous polyposis |
| CRC: Colorectal cancer | ||
| Colorectum (HTA11) |  | AD: Adenomas |
| SER: Sessile serrated lesions | ||
| MSI-H: Microsatellite-high colorectal cancer | ||
| MSS: Microsatellite stable colorectal cancer | ||
| Esophagus |  | ESCC: Esophageal squamous cell carcinoma |
| HGIN: High-grade intraepithelial neoplasias | ||
| LGIN: Low-grade intraepithelial neoplasias | ||
| GC | 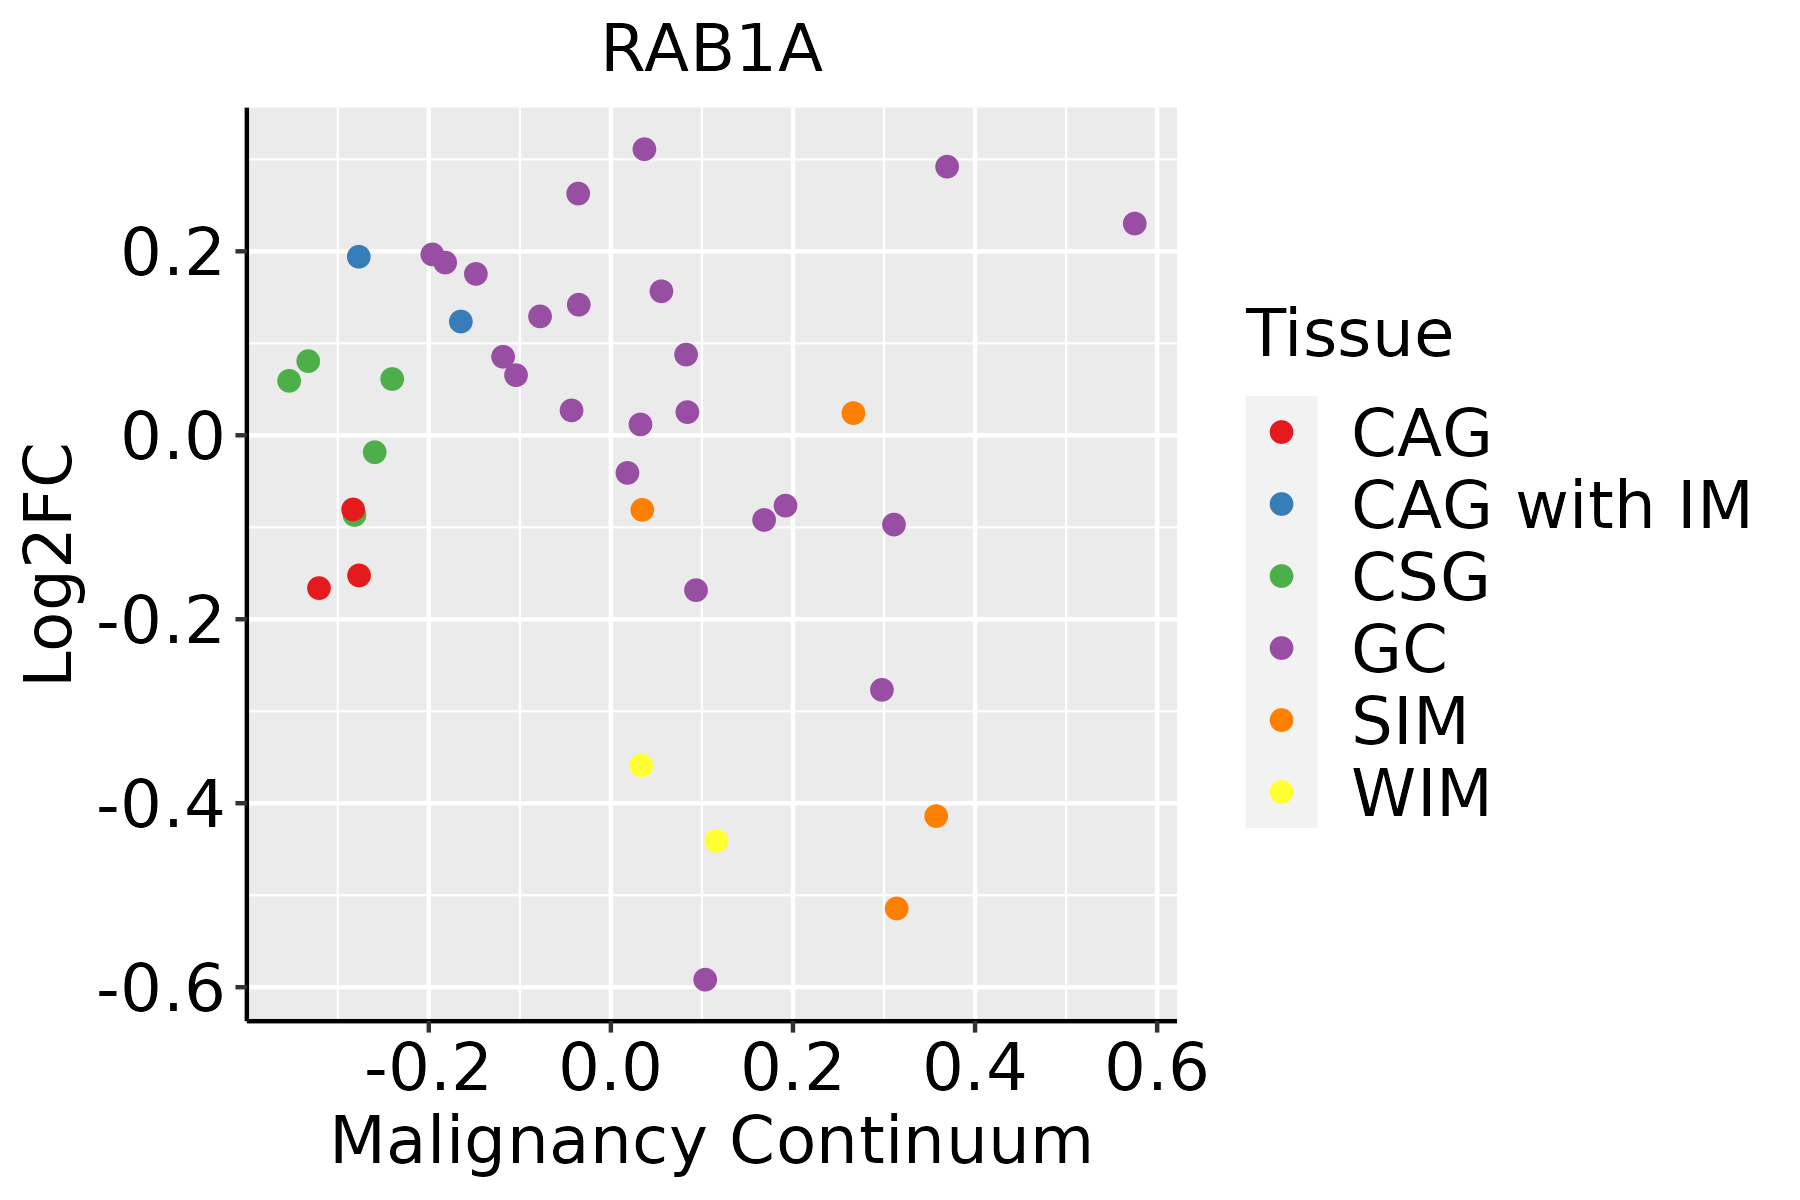 | CAG: Chronic atrophic gastritis |
| CAG with IM: Chronic atrophic gastritis with intestinal metaplasia | ||
| CSG: Chronic superficial gastritis | ||
| GC: Gastric cancer | ||
| SIM: Severe intestinal metaplasia | ||
| WIM: Wild intestinal metaplasia | ||
| Liver |  | HCC: Hepatocellular carcinoma |
| NAFLD: Non-alcoholic fatty liver disease | ||
| Oral Cavity | 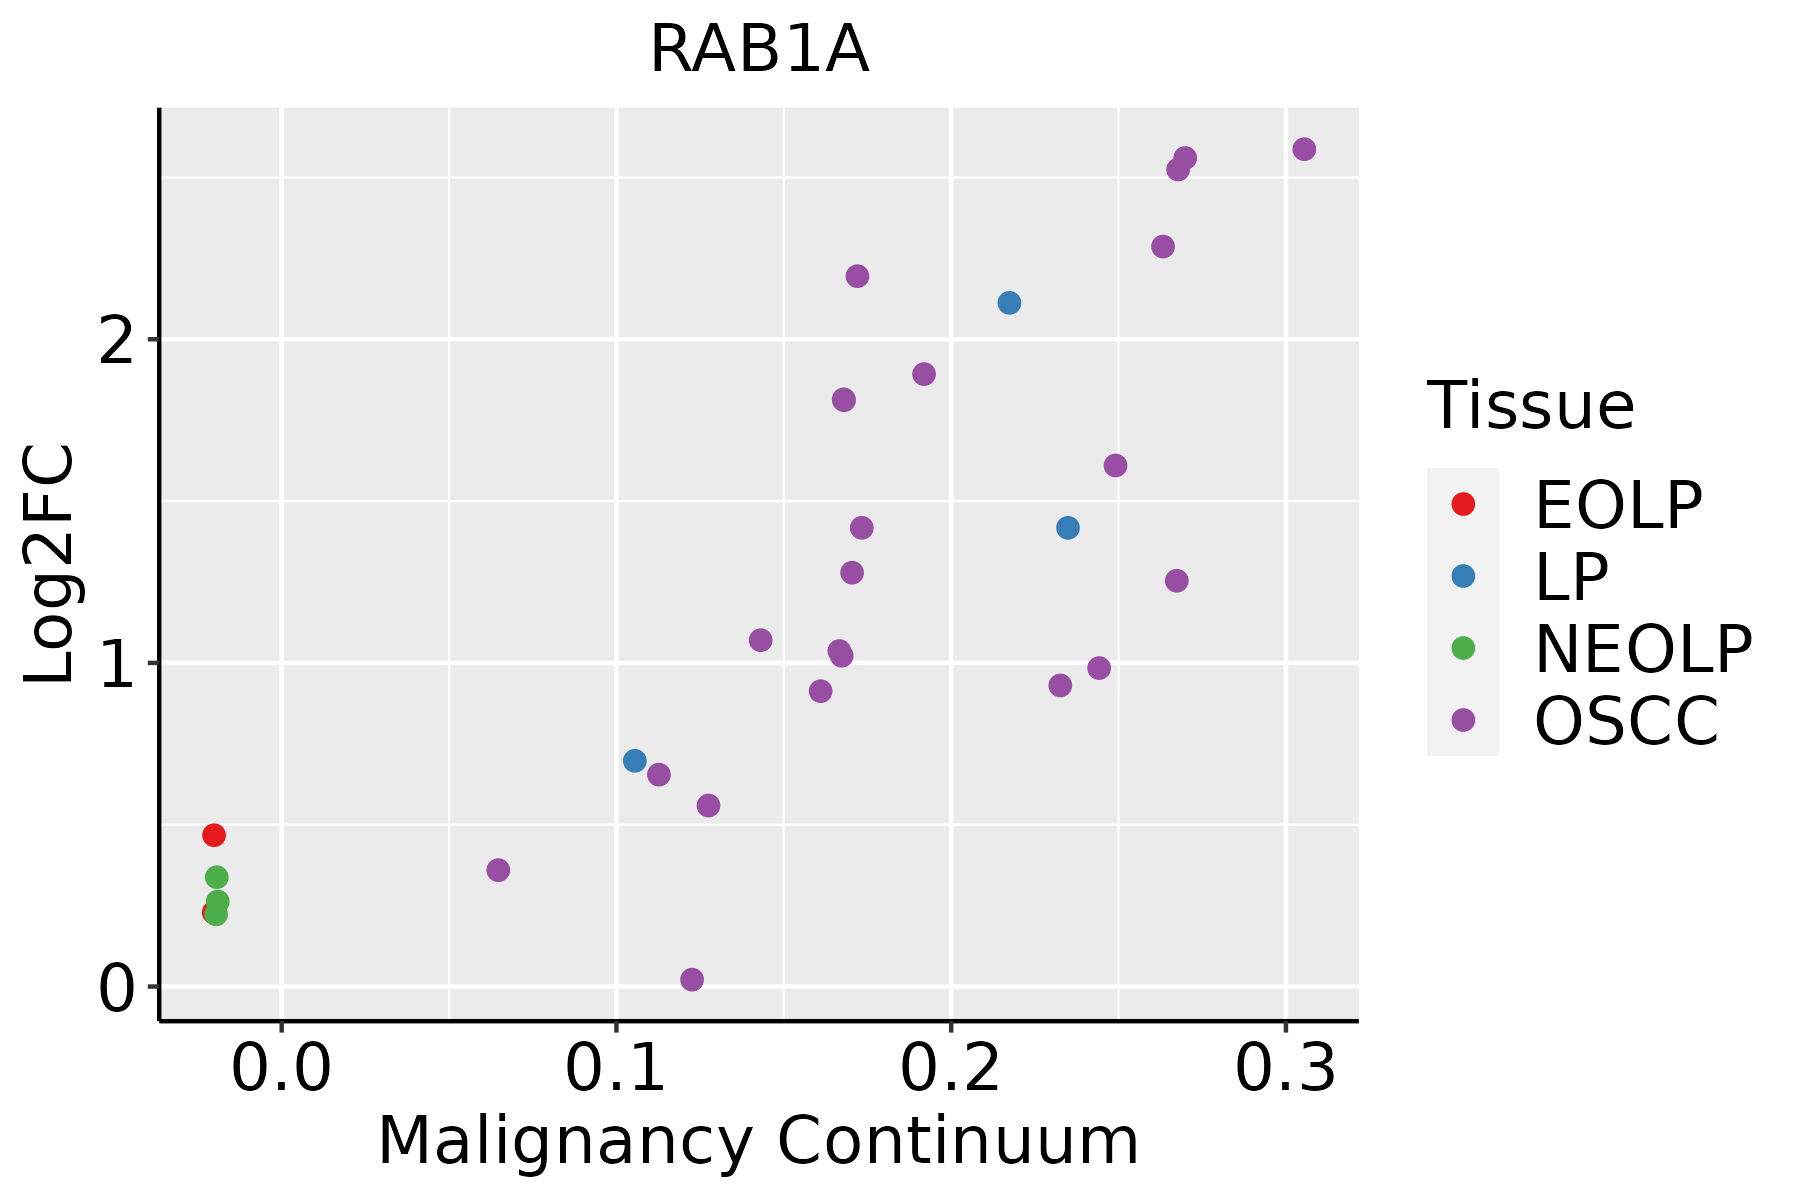 | EOLP: Erosive Oral lichen planus |
| LP: leukoplakia | ||
| NEOLP: Non-erosive oral lichen planus | ||
| OSCC: Oral squamous cell carcinoma | ||
| Prostate | 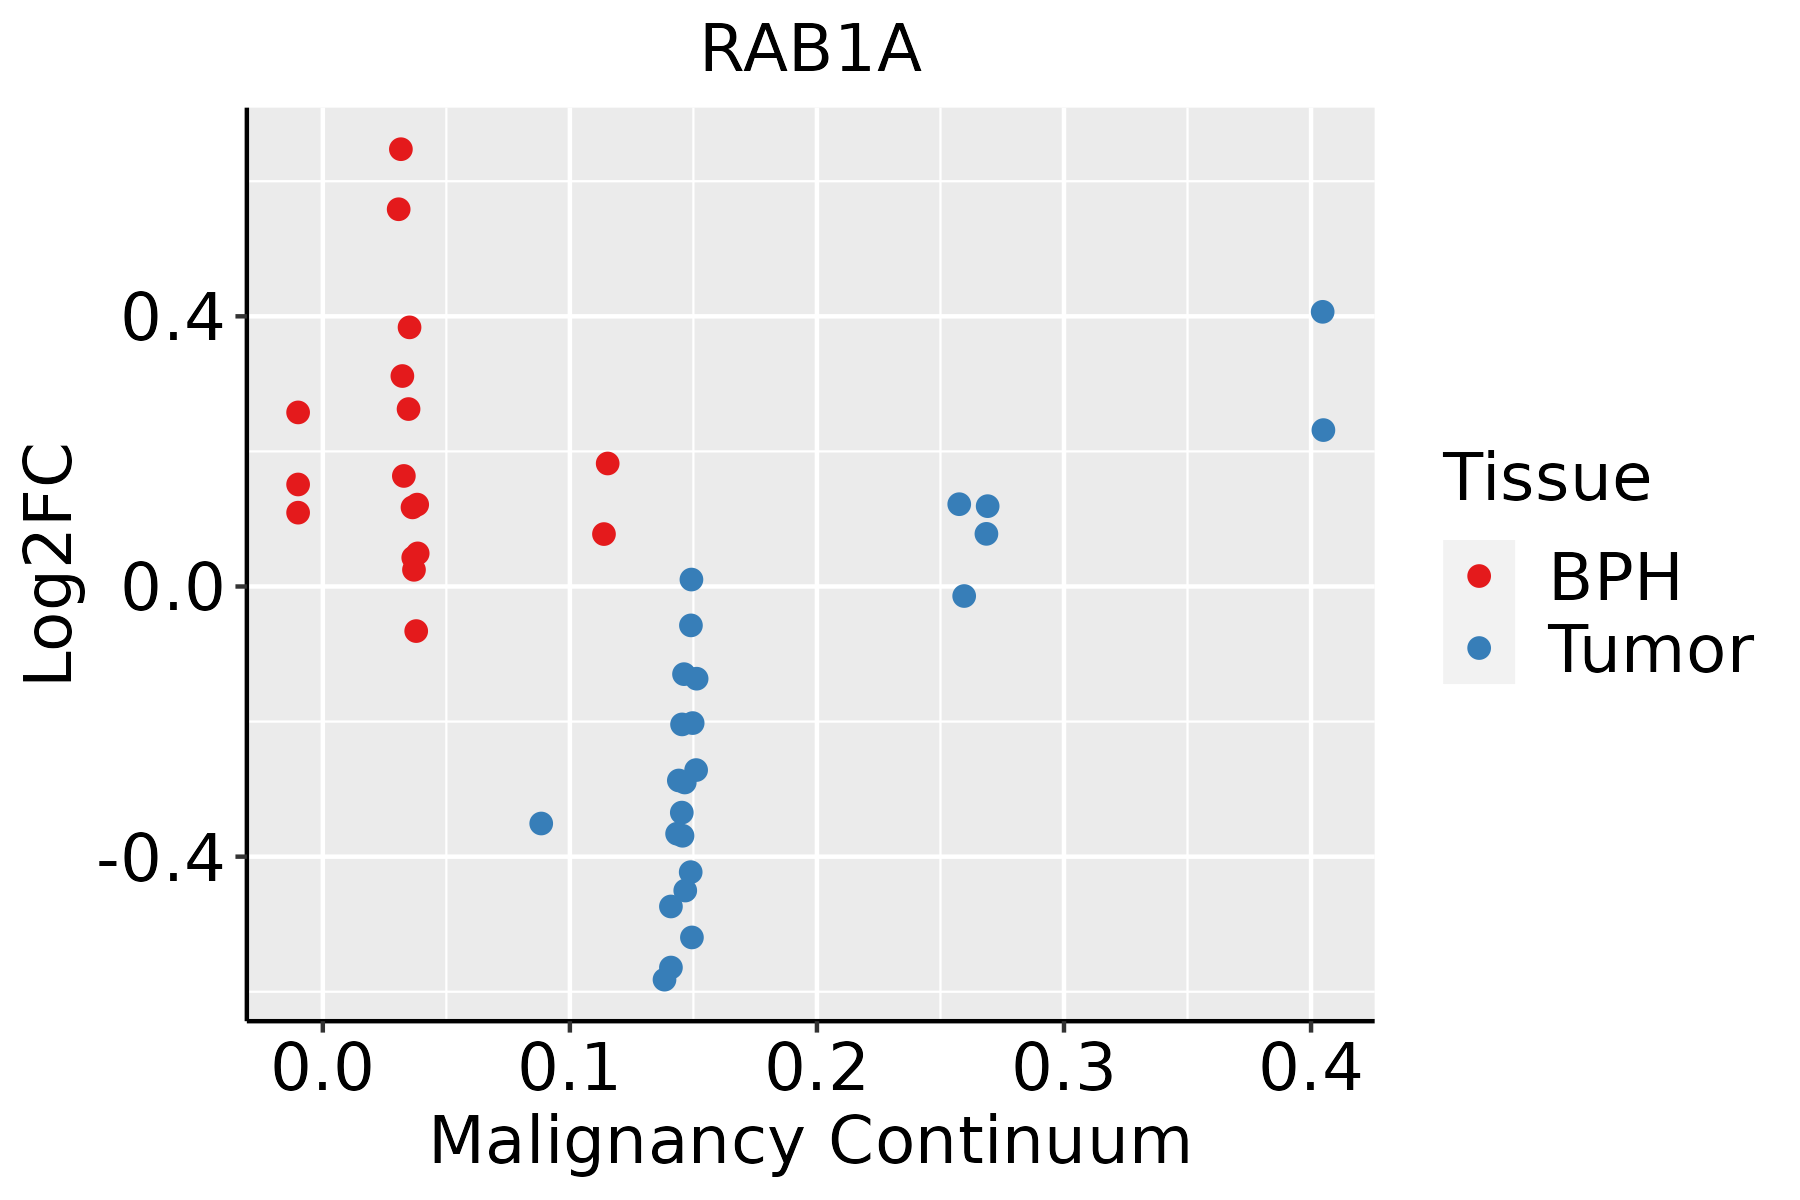 | BPH: Benign Prostatic Hyperplasia |
| Skin | 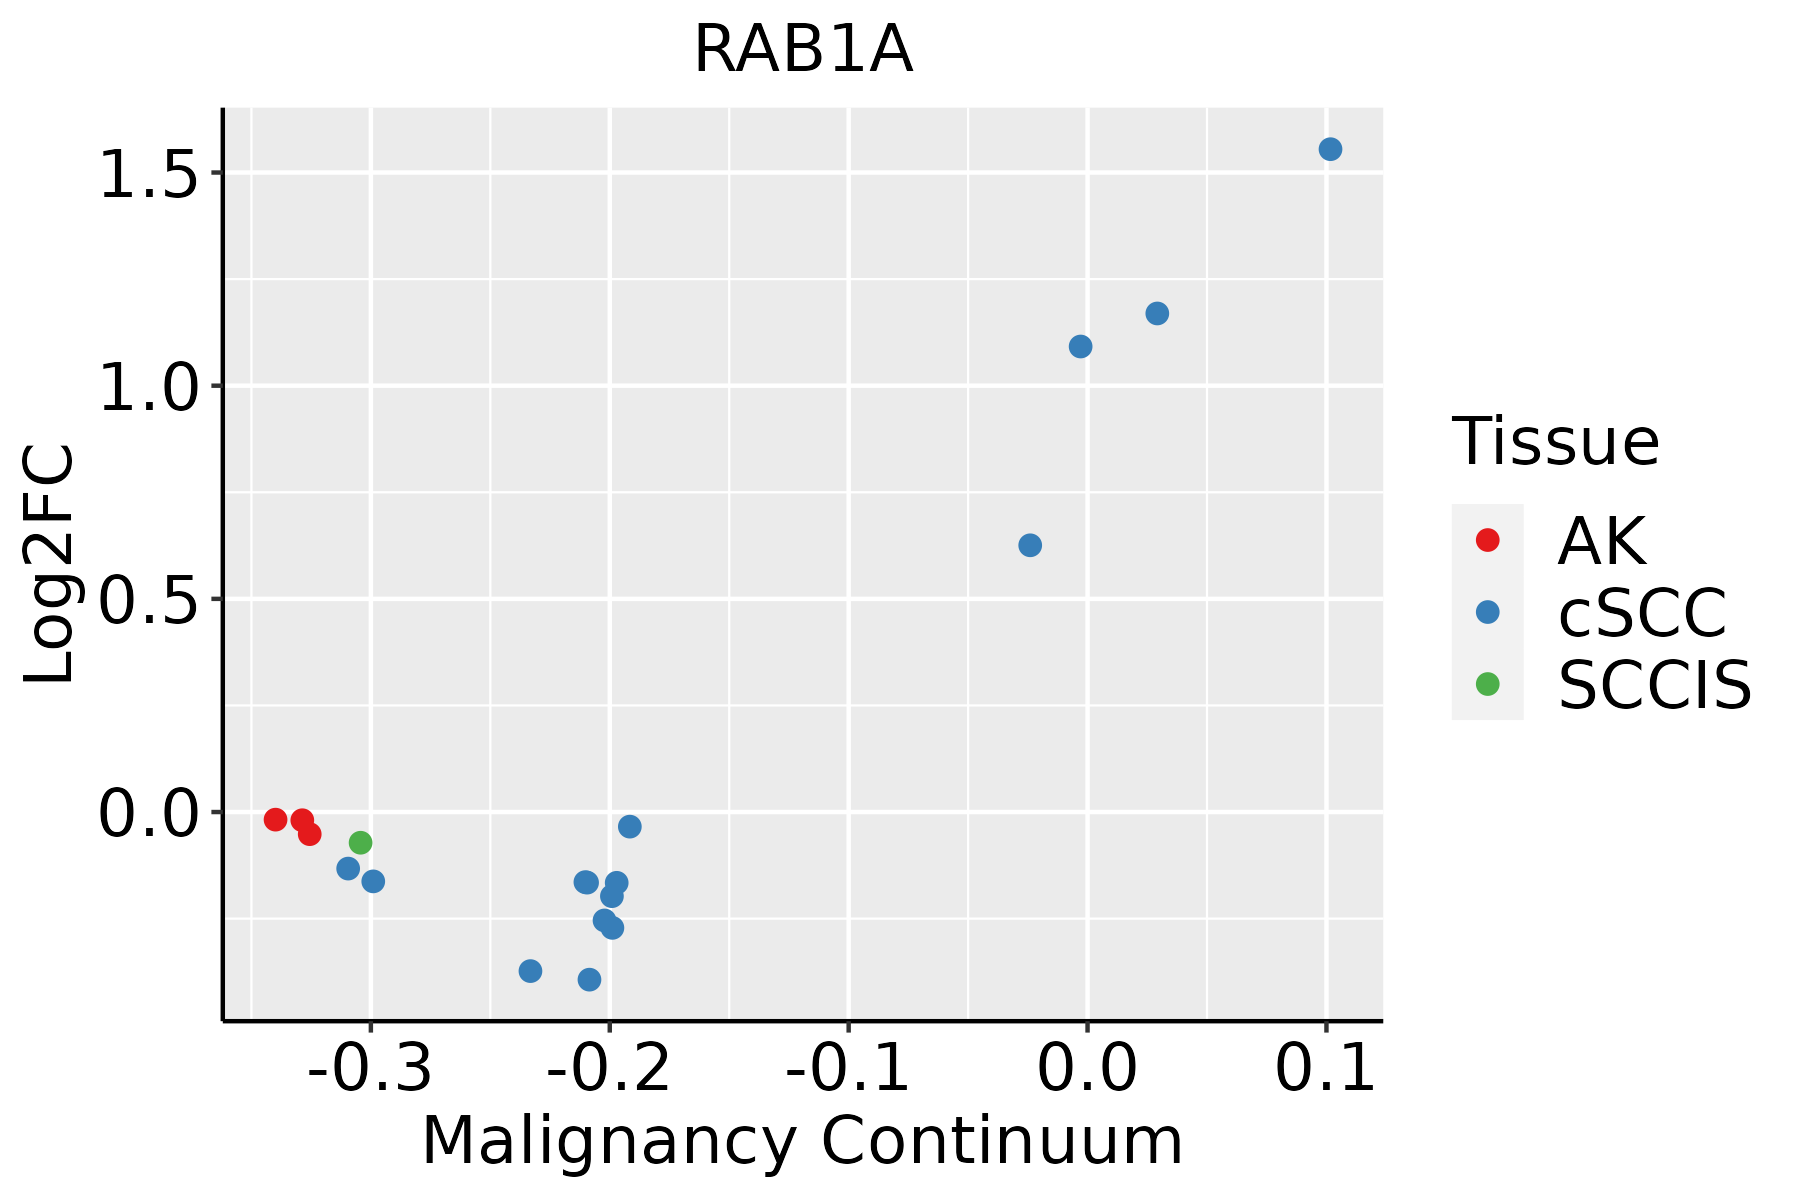 | AK: Actinic keratosis |
| cSCC: Cutaneous squamous cell carcinoma | ||
| SCCIS:squamous cell carcinoma in situ | ||
| Thyroid | 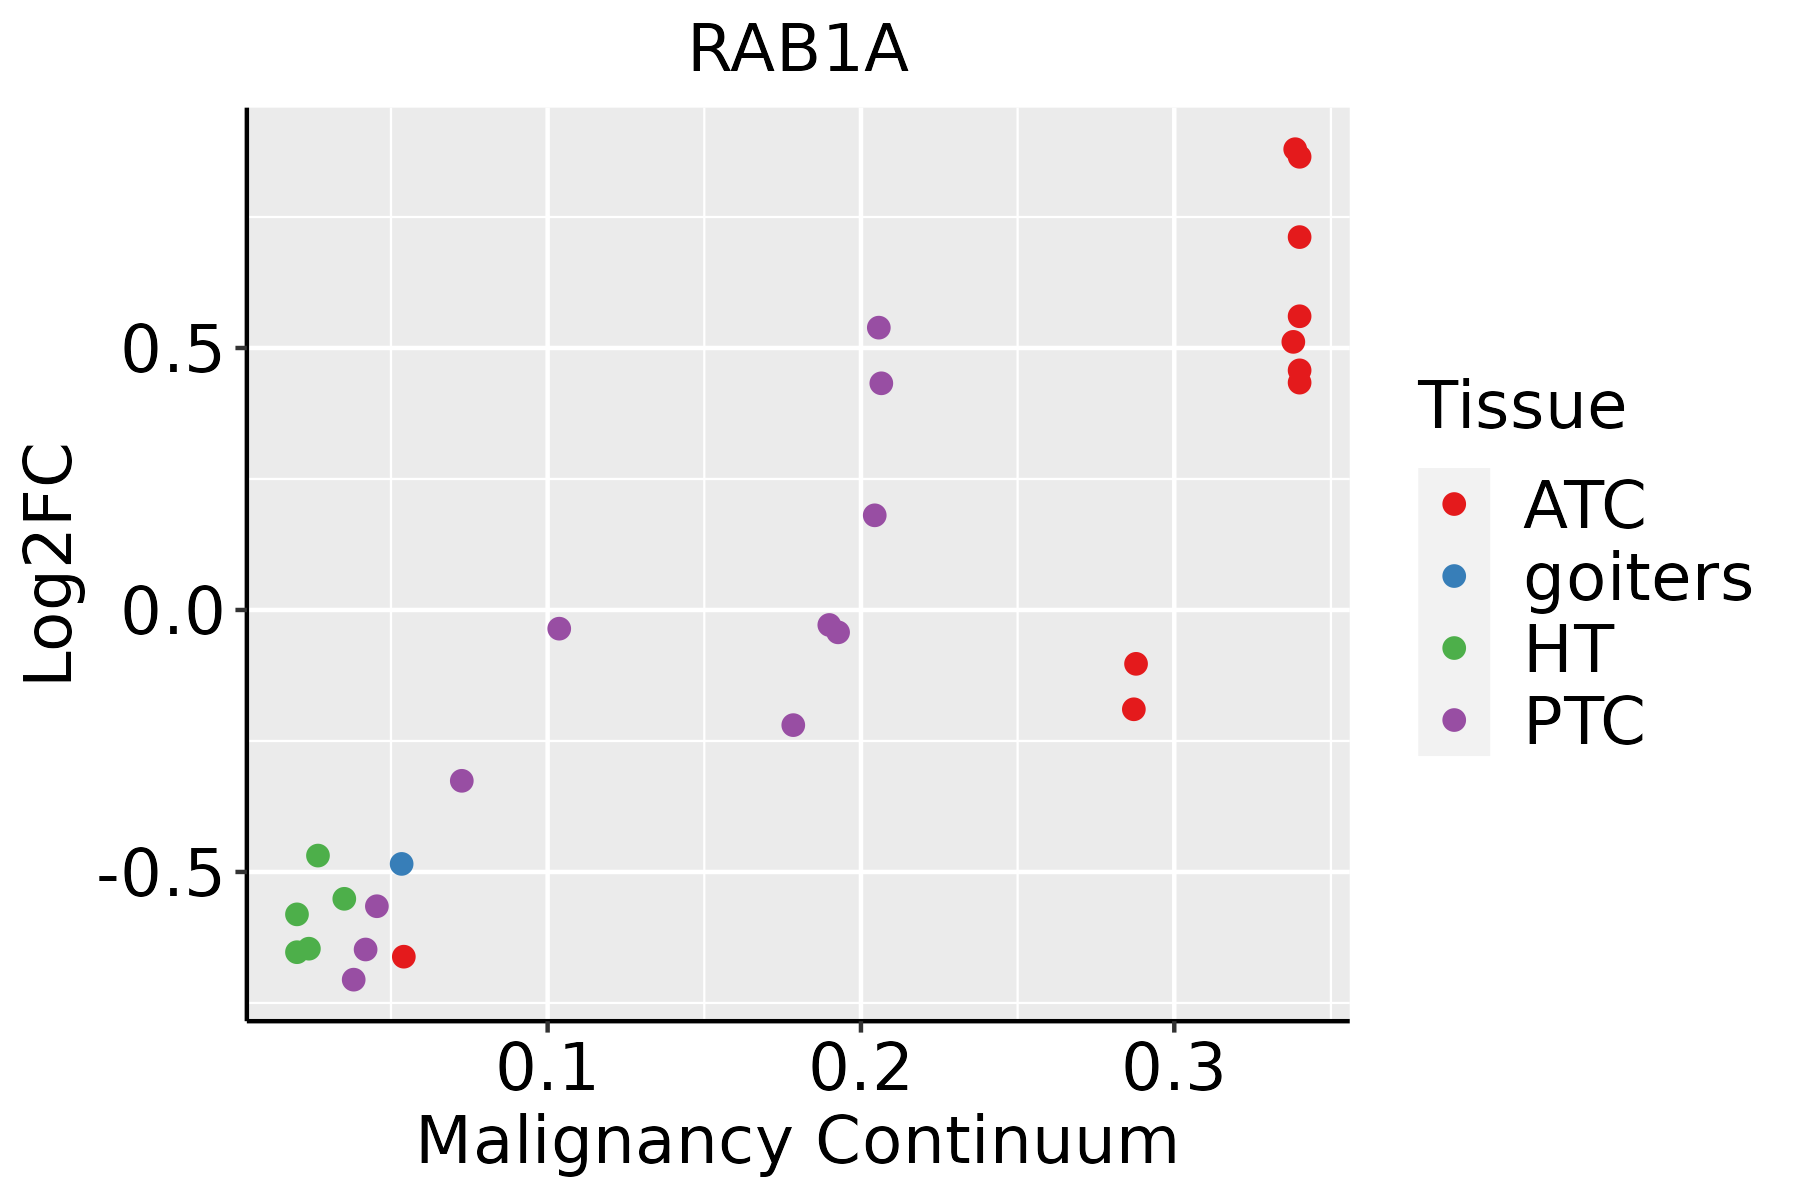 | ATC: Anaplastic thyroid cancer |
| HT: Hashimoto's thyroiditis | ||
| PTC: Papillary thyroid cancer |
| ∗log2FC in expression of this searched gene in stem-like cells from each diseased tissue sample relative to stem-like cells in normal samples in each tissue plotted against the malignancy continuum. Samples are colored based on if they are from different disease stage. |
Top |
Malignant transformation related pathway analysis |
| Find out the enriched GO biological processes and KEGG pathways involved in transition from healthy to precancer to cancer |
| Tissue | Disease Stage | Enriched GO biological Processes |
| Colorectum | AD |  |
| Colorectum | SER |  |
| Colorectum | MSS |  |
| Colorectum | MSI-H |  |
| Colorectum | FAP |  |
| ∗Top 15 enriched GO BP terms are showed in the bar plot of each disease state in each tissue. Each row represents a significant GO biological process which is colored according to the -log10(p.adjust). |
| Page: 1 2 3 4 5 6 7 8 9 |
| GO ID | Tissue | Disease Stage | Description | Gene Ratio | Bg Ratio | pvalue | p.adjust | Count |
| GO:00160329 | Breast | Precancer | viral process | 58/1080 | 415/18723 | 3.42e-10 | 3.16e-08 | 58 |
| GO:00190589 | Breast | Precancer | viral life cycle | 47/1080 | 317/18723 | 2.42e-09 | 1.99e-07 | 47 |
| GO:00018196 | Breast | Precancer | positive regulation of cytokine production | 52/1080 | 467/18723 | 4.18e-06 | 1.29e-04 | 52 |
| GO:00069009 | Breast | Precancer | vesicle budding from membrane | 12/1080 | 61/18723 | 1.61e-04 | 2.69e-03 | 12 |
| GO:00158336 | Breast | Precancer | peptide transport | 27/1080 | 264/18723 | 2.84e-03 | 2.49e-02 | 27 |
| GO:00027904 | Breast | Precancer | peptide secretion | 24/1080 | 242/18723 | 6.87e-03 | 4.67e-02 | 24 |
| GO:001603214 | Breast | IDC | viral process | 75/1434 | 415/18723 | 1.98e-12 | 4.02e-10 | 75 |
| GO:001905814 | Breast | IDC | viral life cycle | 61/1434 | 317/18723 | 1.61e-11 | 2.77e-09 | 61 |
| GO:000181911 | Breast | IDC | positive regulation of cytokine production | 61/1434 | 467/18723 | 2.81e-05 | 6.58e-04 | 61 |
| GO:000690014 | Breast | IDC | vesicle budding from membrane | 12/1434 | 61/18723 | 2.01e-03 | 1.90e-02 | 12 |
| GO:001583312 | Breast | IDC | peptide transport | 32/1434 | 264/18723 | 6.61e-03 | 4.62e-02 | 32 |
| GO:001603224 | Breast | DCIS | viral process | 73/1390 | 415/18723 | 3.40e-12 | 6.88e-10 | 73 |
| GO:001905824 | Breast | DCIS | viral life cycle | 59/1390 | 317/18723 | 4.05e-11 | 5.74e-09 | 59 |
| GO:000181921 | Breast | DCIS | positive regulation of cytokine production | 63/1390 | 467/18723 | 2.76e-06 | 9.42e-05 | 63 |
| GO:000690022 | Breast | DCIS | vesicle budding from membrane | 12/1390 | 61/18723 | 1.54e-03 | 1.54e-02 | 12 |
| GO:001603210 | Cervix | CC | viral process | 109/2311 | 415/18723 | 5.40e-15 | 6.46e-12 | 109 |
| GO:00315898 | Cervix | CC | cell-substrate adhesion | 96/2311 | 363/18723 | 1.48e-13 | 8.85e-11 | 96 |
| GO:001905810 | Cervix | CC | viral life cycle | 87/2311 | 317/18723 | 2.20e-13 | 1.20e-10 | 87 |
| GO:00018197 | Cervix | CC | positive regulation of cytokine production | 95/2311 | 467/18723 | 4.88e-07 | 1.85e-05 | 95 |
| GO:00344469 | Cervix | CC | substrate adhesion-dependent cell spreading | 32/2311 | 108/18723 | 1.36e-06 | 4.55e-05 | 32 |
| Page: 1 2 3 4 5 6 7 8 9 10 11 12 13 14 15 16 17 18 19 20 21 22 23 24 25 26 |
| Pathway ID | Tissue | Disease Stage | Description | Gene Ratio | Bg Ratio | pvalue | p.adjust | qvalue | Count |
| hsa0501416 | Breast | Precancer | Amyotrophic lateral sclerosis | 98/684 | 364/8465 | 2.13e-28 | 8.41e-27 | 6.44e-27 | 98 |
| hsa0502216 | Breast | Precancer | Pathways of neurodegeneration - multiple diseases | 112/684 | 476/8465 | 6.96e-27 | 2.44e-25 | 1.87e-25 | 112 |
| hsa0513414 | Breast | Precancer | Legionellosis | 19/684 | 57/8465 | 4.62e-08 | 9.12e-07 | 6.98e-07 | 19 |
| hsa0513018 | Breast | Precancer | Pathogenic Escherichia coli infection | 38/684 | 197/8465 | 3.12e-07 | 5.81e-06 | 4.45e-06 | 38 |
| hsa0501417 | Breast | Precancer | Amyotrophic lateral sclerosis | 98/684 | 364/8465 | 2.13e-28 | 8.41e-27 | 6.44e-27 | 98 |
| hsa0502217 | Breast | Precancer | Pathways of neurodegeneration - multiple diseases | 112/684 | 476/8465 | 6.96e-27 | 2.44e-25 | 1.87e-25 | 112 |
| hsa0513415 | Breast | Precancer | Legionellosis | 19/684 | 57/8465 | 4.62e-08 | 9.12e-07 | 6.98e-07 | 19 |
| hsa0513019 | Breast | Precancer | Pathogenic Escherichia coli infection | 38/684 | 197/8465 | 3.12e-07 | 5.81e-06 | 4.45e-06 | 38 |
| hsa0501423 | Breast | IDC | Amyotrophic lateral sclerosis | 102/867 | 364/8465 | 1.29e-22 | 5.22e-21 | 3.91e-21 | 102 |
| hsa0502223 | Breast | IDC | Pathways of neurodegeneration - multiple diseases | 116/867 | 476/8465 | 3.63e-20 | 1.18e-18 | 8.82e-19 | 116 |
| hsa0513422 | Breast | IDC | Legionellosis | 19/867 | 57/8465 | 1.89e-06 | 3.07e-05 | 2.29e-05 | 19 |
| hsa0513024 | Breast | IDC | Pathogenic Escherichia coli infection | 42/867 | 197/8465 | 2.66e-06 | 3.92e-05 | 2.94e-05 | 42 |
| hsa0501433 | Breast | IDC | Amyotrophic lateral sclerosis | 102/867 | 364/8465 | 1.29e-22 | 5.22e-21 | 3.91e-21 | 102 |
| hsa0502233 | Breast | IDC | Pathways of neurodegeneration - multiple diseases | 116/867 | 476/8465 | 3.63e-20 | 1.18e-18 | 8.82e-19 | 116 |
| hsa0513432 | Breast | IDC | Legionellosis | 19/867 | 57/8465 | 1.89e-06 | 3.07e-05 | 2.29e-05 | 19 |
| hsa0513034 | Breast | IDC | Pathogenic Escherichia coli infection | 42/867 | 197/8465 | 2.66e-06 | 3.92e-05 | 2.94e-05 | 42 |
| hsa0501443 | Breast | DCIS | Amyotrophic lateral sclerosis | 101/846 | 364/8465 | 7.14e-23 | 2.88e-21 | 2.12e-21 | 101 |
| hsa0502243 | Breast | DCIS | Pathways of neurodegeneration - multiple diseases | 114/846 | 476/8465 | 4.74e-20 | 1.53e-18 | 1.13e-18 | 114 |
| hsa0513441 | Breast | DCIS | Legionellosis | 19/846 | 57/8465 | 1.30e-06 | 2.10e-05 | 1.55e-05 | 19 |
| hsa0513043 | Breast | DCIS | Pathogenic Escherichia coli infection | 42/846 | 197/8465 | 1.40e-06 | 2.15e-05 | 1.59e-05 | 42 |
| Page: 1 2 3 4 5 6 7 8 9 10 |
Top |
Cell-cell communication analysis |
| Identification of potential cell-cell interactions between two cell types and their ligand-receptor pairs for different disease states |
| Ligand | Receptor | LRpair | Pathway | Tissue | Disease Stage |
| Page: 1 |
Top |
Single-cell gene regulatory network inference analysis |
| Find out the significant the regulons (TFs) and the target genes of each regulon across cell types for different disease states |
| TF | Cell Type | Tissue | Disease Stage | Target Gene | RSS | Regulon Activity |
| ∗The dot plots of a searched regulon are shown for all cell subpopulations in each disease state of each tissue based on the regulon specific score inferred using pySCENIC and by calculating the average expression. |
| Page: 1 |
Top |
Somatic mutation of malignant transformation related genes |
| Annotation of somatic variants for genes involved in malignant transformation |
| Hugo Symbol | Variant Class | Variant Classification | dbSNP RS | HGVSc | HGVSp | HGVSp Short | SWISSPROT | BIOTYPE | SIFT | PolyPhen | Tumor Sample Barcode | Tissue | Histology | Sex | Age | Stage | Therapy Types | Drugs | Outcome |
| RAB1A | SNV | Missense_Mutation | c.550G>T | p.Gly184Cys | p.G184C | P62820 | protein_coding | deleterious(0) | benign(0.345) | TCGA-AO-A1KR-01 | Breast | breast invasive carcinoma | Female | <65 | I/II | Chemotherapy | cyclophosphamide | SD | |
| RAB1A | SNV | Missense_Mutation | c.513N>C | p.Glu171Asp | p.E171D | P62820 | protein_coding | tolerated(0.45) | benign(0.003) | TCGA-AR-A0TS-01 | Breast | breast invasive carcinoma | Female | <65 | I/II | Chemotherapy | doxorubicin | SD | |
| RAB1A | SNV | Missense_Mutation | c.353N>G | p.Asn118Ser | p.N118S | P62820 | protein_coding | tolerated(0.17) | benign(0.013) | TCGA-AZ-6598-01 | Colorectum | colon adenocarcinoma | Female | >=65 | I/II | Unknown | Unknown | SD | |
| RAB1A | SNV | Missense_Mutation | c.476N>T | p.Thr159Met | p.T159M | P62820 | protein_coding | deleterious(0.04) | benign(0.133) | TCGA-AZ-6601-01 | Colorectum | colon adenocarcinoma | Male | >=65 | I/II | Unknown | Unknown | PD | |
| RAB1A | SNV | Missense_Mutation | c.206N>A | p.Gly69Asp | p.G69D | P62820 | protein_coding | deleterious(0) | probably_damaging(0.996) | TCGA-AZ-6608-01 | Colorectum | colon adenocarcinoma | Female | <65 | III/IV | Unknown | Unknown | SD | |
| RAB1A | insertion | In_Frame_Ins | novel | c.292_293insTCAACA | p.Ser98delinsPheAsnThr | p.S98delinsFNT | P62820 | protein_coding | TCGA-AM-5820-01 | Colorectum | colon adenocarcinoma | Female | <65 | I/II | Unknown | Unknown | SD | ||
| RAB1A | SNV | Missense_Mutation | novel | c.578N>G | p.Gln193Arg | p.Q193R | P62820 | protein_coding | tolerated(0.8) | benign(0) | TCGA-A5-A0G2-01 | Endometrium | uterine corpus endometrioid carcinoma | Female | <65 | III/IV | Unknown | Unknown | SD |
| RAB1A | SNV | Missense_Mutation | novel | c.425N>C | p.Phe142Ser | p.F142S | P62820 | protein_coding | deleterious(0) | probably_damaging(0.93) | TCGA-A5-A2K5-01 | Endometrium | uterine corpus endometrioid carcinoma | Female | >=65 | I/II | Unknown | Unknown | SD |
| RAB1A | SNV | Missense_Mutation | c.221N>A | p.Arg74Gln | p.R74Q | P62820 | protein_coding | deleterious(0.01) | possibly_damaging(0.502) | TCGA-AP-A056-01 | Endometrium | uterine corpus endometrioid carcinoma | Female | <65 | I/II | Unknown | Unknown | SD | |
| RAB1A | SNV | Missense_Mutation | c.14N>C | p.Asn5Thr | p.N5T | P62820 | protein_coding | tolerated(0.09) | benign(0.009) | TCGA-AX-A0J0-01 | Endometrium | uterine corpus endometrioid carcinoma | Female | <65 | I/II | Unknown | Unknown | SD |
| Page: 1 2 |
Top |
Related drugs of malignant transformation related genes |
| Identification of chemicals and drugs interact with genes involved in malignant transfromation |
| (DGIdb 4.0) |
| Entrez ID | Symbol | Category | Interaction Types | Drug Claim Name | Drug Name | PMIDs |
| Page: 1 |

Copyright 2023-Present -The University of Texas Health Science Center at Houston |