
|
|||||
|
 | |
| |
| |
| |
| |
| |
|
Gene: RAB17 |
Gene summary for RAB17 |
| Gene information | Species | Human | Gene symbol | RAB17 | Gene ID | 64284 |
| Gene name | RAB17, member RAS oncogene family | |
| Gene Alias | RAB17 | |
| Cytomap | 2q37.3 | |
| Gene Type | protein-coding | GO ID | GO:0002251 | UniProtAcc | A0A024R4A4 |
Top |
Malignant transformation analysis |
| Identification of the aberrant gene expression in precancerous and cancerous lesions by comparing the gene expression of stem-like cells in diseased tissues with normal stem cells |
| Entrez ID | Symbol | Replicates | Species | Organ | Tissue | Adj P-value | Log2FC | Malignancy |
| 64284 | RAB17 | LZE4T | Human | Esophagus | ESCC | 4.57e-02 | 7.58e-02 | 0.0811 |
| 64284 | RAB17 | P1T-E | Human | Esophagus | ESCC | 1.38e-02 | 2.14e-01 | 0.0875 |
| 64284 | RAB17 | P4T-E | Human | Esophagus | ESCC | 1.46e-04 | 8.43e-02 | 0.1323 |
| 64284 | RAB17 | P8T-E | Human | Esophagus | ESCC | 1.13e-25 | 5.20e-01 | 0.0889 |
| 64284 | RAB17 | P10T-E | Human | Esophagus | ESCC | 6.97e-08 | 1.11e-01 | 0.116 |
| 64284 | RAB17 | P15T-E | Human | Esophagus | ESCC | 8.61e-03 | 9.54e-02 | 0.1149 |
| 64284 | RAB17 | P17T-E | Human | Esophagus | ESCC | 1.38e-02 | 1.29e-01 | 0.1278 |
| 64284 | RAB17 | P20T-E | Human | Esophagus | ESCC | 2.78e-04 | 3.01e-02 | 0.1124 |
| 64284 | RAB17 | P21T-E | Human | Esophagus | ESCC | 6.19e-13 | 2.81e-01 | 0.1617 |
| 64284 | RAB17 | P30T-E | Human | Esophagus | ESCC | 3.41e-04 | 1.30e-01 | 0.137 |
| 64284 | RAB17 | P36T-E | Human | Esophagus | ESCC | 2.27e-10 | 1.73e-01 | 0.1187 |
| 64284 | RAB17 | P37T-E | Human | Esophagus | ESCC | 1.24e-13 | 1.88e-01 | 0.1371 |
| 64284 | RAB17 | P48T-E | Human | Esophagus | ESCC | 1.11e-07 | 6.80e-02 | 0.0959 |
| 64284 | RAB17 | P49T-E | Human | Esophagus | ESCC | 3.67e-04 | 4.74e-01 | 0.1768 |
| 64284 | RAB17 | P52T-E | Human | Esophagus | ESCC | 4.85e-12 | 1.57e-01 | 0.1555 |
| 64284 | RAB17 | P54T-E | Human | Esophagus | ESCC | 5.64e-15 | 2.60e-01 | 0.0975 |
| 64284 | RAB17 | P57T-E | Human | Esophagus | ESCC | 1.78e-10 | 2.96e-01 | 0.0926 |
| 64284 | RAB17 | P61T-E | Human | Esophagus | ESCC | 2.53e-07 | 2.77e-01 | 0.099 |
| 64284 | RAB17 | P65T-E | Human | Esophagus | ESCC | 2.13e-05 | 1.49e-01 | 0.0978 |
| 64284 | RAB17 | P74T-E | Human | Esophagus | ESCC | 1.62e-20 | 5.84e-01 | 0.1479 |
| Page: 1 2 |
| Tissue | Expression Dynamics | Abbreviation |
| Esophagus | 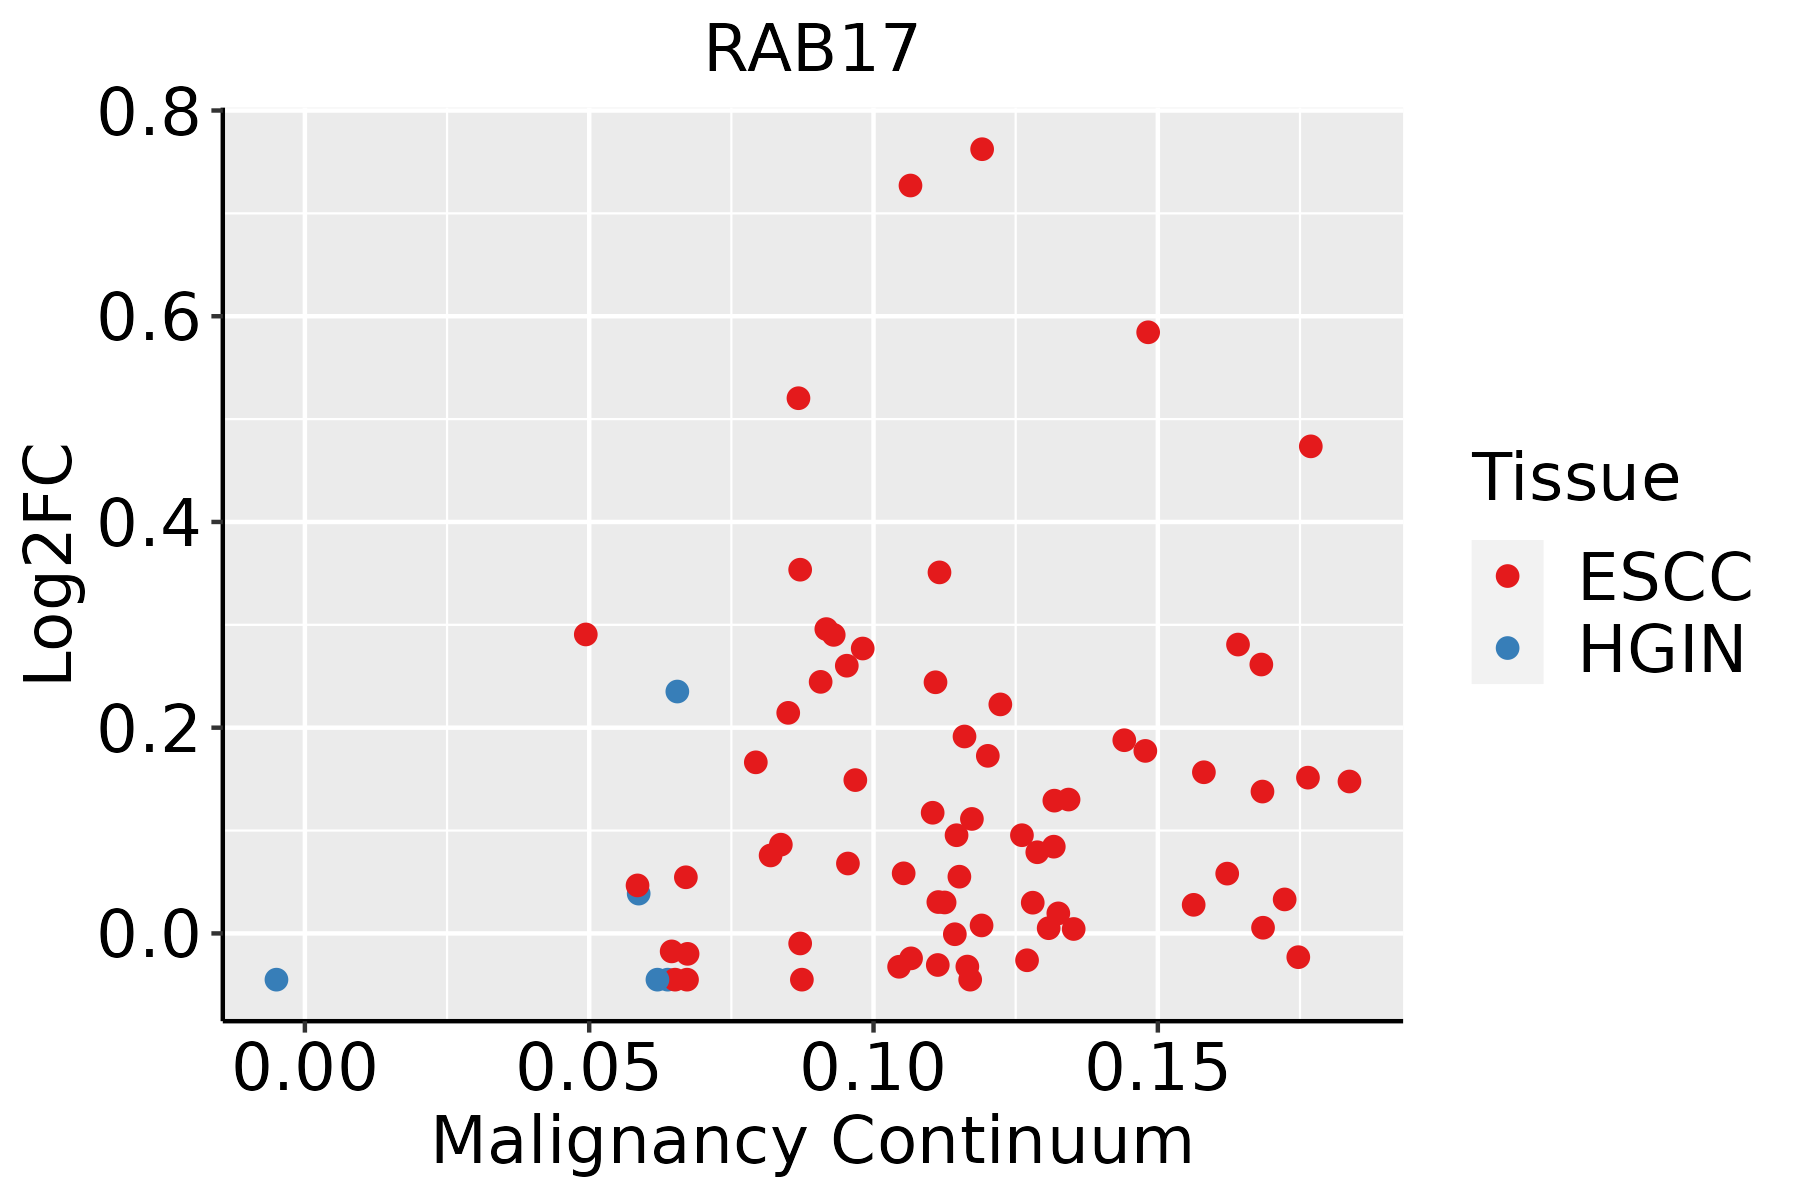 | ESCC: Esophageal squamous cell carcinoma |
| HGIN: High-grade intraepithelial neoplasias | ||
| LGIN: Low-grade intraepithelial neoplasias |
| ∗log2FC in expression of this searched gene in stem-like cells from each diseased tissue sample relative to stem-like cells in normal samples in each tissue plotted against the malignancy continuum. Samples are colored based on if they are from different disease stage. |
Top |
Malignant transformation related pathway analysis |
| Find out the enriched GO biological processes and KEGG pathways involved in transition from healthy to precancer to cancer |
| Tissue | Disease Stage | Enriched GO biological Processes |
| Colorectum | AD |  |
| Colorectum | SER |  |
| Colorectum | MSS |  |
| Colorectum | MSI-H |  |
| Colorectum | FAP |  |
| ∗Top 15 enriched GO BP terms are showed in the bar plot of each disease state in each tissue. Each row represents a significant GO biological process which is colored according to the -log10(p.adjust). |
| Page: 1 2 3 4 5 6 7 8 9 |
| GO ID | Tissue | Disease Stage | Description | Gene Ratio | Bg Ratio | pvalue | p.adjust | Count |
| GO:005165617 | Esophagus | ESCC | establishment of organelle localization | 273/8552 | 390/18723 | 9.13e-23 | 1.81e-20 | 273 |
| GO:001619715 | Esophagus | ESCC | endosomal transport | 168/8552 | 230/18723 | 2.28e-17 | 1.93e-15 | 168 |
| GO:005165016 | Esophagus | ESCC | establishment of vesicle localization | 114/8552 | 161/18723 | 8.20e-11 | 2.53e-09 | 114 |
| GO:009887615 | Esophagus | ESCC | vesicle-mediated transport to the plasma membrane | 99/8552 | 136/18723 | 1.13e-10 | 3.39e-09 | 99 |
| GO:005164815 | Esophagus | ESCC | vesicle localization | 119/8552 | 177/18723 | 5.16e-09 | 1.08e-07 | 119 |
| GO:003010018 | Esophagus | ESCC | regulation of endocytosis | 135/8552 | 211/18723 | 5.75e-08 | 1.02e-06 | 135 |
| GO:00330593 | Esophagus | ESCC | cellular pigmentation | 40/8552 | 53/18723 | 9.67e-06 | 9.21e-05 | 40 |
| GO:00324565 | Esophagus | ESCC | endocytic recycling | 51/8552 | 73/18723 | 2.47e-05 | 2.10e-04 | 51 |
| GO:001097516 | Esophagus | ESCC | regulation of neuron projection development | 240/8552 | 445/18723 | 2.48e-04 | 1.53e-03 | 240 |
| GO:006049118 | Esophagus | ESCC | regulation of cell projection assembly | 110/8552 | 188/18723 | 2.60e-04 | 1.58e-03 | 110 |
| GO:003432918 | Esophagus | ESCC | cell junction assembly | 227/8552 | 420/18723 | 3.06e-04 | 1.83e-03 | 227 |
| GO:012003218 | Esophagus | ESCC | regulation of plasma membrane bounded cell projection assembly | 108/8552 | 186/18723 | 4.37e-04 | 2.46e-03 | 108 |
| GO:00450568 | Esophagus | ESCC | transcytosis | 17/8552 | 21/18723 | 1.03e-03 | 5.19e-03 | 17 |
| GO:00434731 | Esophagus | ESCC | pigmentation | 59/8552 | 98/18723 | 2.64e-03 | 1.12e-02 | 59 |
| GO:001635816 | Esophagus | ESCC | dendrite development | 130/8552 | 243/18723 | 8.33e-03 | 2.95e-02 | 130 |
| GO:190188810 | Esophagus | ESCC | regulation of cell junction assembly | 109/8552 | 204/18723 | 1.53e-02 | 4.96e-02 | 109 |
| Page: 1 |
| Pathway ID | Tissue | Disease Stage | Description | Gene Ratio | Bg Ratio | pvalue | p.adjust | qvalue | Count |
| Page: 1 |
Top |
Cell-cell communication analysis |
| Identification of potential cell-cell interactions between two cell types and their ligand-receptor pairs for different disease states |
| Ligand | Receptor | LRpair | Pathway | Tissue | Disease Stage |
| Page: 1 |
Top |
Single-cell gene regulatory network inference analysis |
| Find out the significant the regulons (TFs) and the target genes of each regulon across cell types for different disease states |
| TF | Cell Type | Tissue | Disease Stage | Target Gene | RSS | Regulon Activity |
| ∗The dot plots of a searched regulon are shown for all cell subpopulations in each disease state of each tissue based on the regulon specific score inferred using pySCENIC and by calculating the average expression. |
| Page: 1 |
Top |
Somatic mutation of malignant transformation related genes |
| Annotation of somatic variants for genes involved in malignant transformation |
| Hugo Symbol | Variant Class | Variant Classification | dbSNP RS | HGVSc | HGVSp | HGVSp Short | SWISSPROT | BIOTYPE | SIFT | PolyPhen | Tumor Sample Barcode | Tissue | Histology | Sex | Age | Stage | Therapy Types | Drugs | Outcome |
| RAB17 | SNV | Missense_Mutation | novel | c.595C>A | p.Leu199Met | p.L199M | Q9H0T7 | protein_coding | deleterious(0.01) | possibly_damaging(0.869) | TCGA-A2-A0YT-01 | Breast | breast invasive carcinoma | Female | <65 | III/IV | Hormone Therapy | arimidex | SD |
| RAB17 | SNV | Missense_Mutation | rs775097225 | c.631G>A | p.Ala211Thr | p.A211T | Q9H0T7 | protein_coding | deleterious(0.02) | benign(0.003) | TCGA-AA-3949-01 | Colorectum | colon adenocarcinoma | Female | >=65 | III/IV | Unknown | Unknown | SD |
| RAB17 | SNV | Missense_Mutation | rs761536358 | c.112N>T | p.Arg38Trp | p.R38W | Q9H0T7 | protein_coding | deleterious(0) | probably_damaging(0.984) | TCGA-AA-3968-01 | Colorectum | colon adenocarcinoma | Female | <65 | I/II | Unknown | Unknown | SD |
| RAB17 | SNV | Missense_Mutation | c.619N>A | p.Ala207Thr | p.A207T | Q9H0T7 | protein_coding | tolerated(0.33) | benign(0) | TCGA-AD-6963-01 | Colorectum | colon adenocarcinoma | Male | <65 | I/II | Unknown | Unknown | SD | |
| RAB17 | SNV | Missense_Mutation | c.496A>G | p.Asn166Asp | p.N166D | Q9H0T7 | protein_coding | tolerated(0.5) | benign(0.202) | TCGA-AD-A5EJ-01 | Colorectum | colon adenocarcinoma | Female | >=65 | I/II | Unknown | Unknown | SD | |
| RAB17 | SNV | Missense_Mutation | c.191C>T | p.Ala64Val | p.A64V | Q9H0T7 | protein_coding | tolerated(0.21) | benign(0.005) | TCGA-CM-6171-01 | Colorectum | colon adenocarcinoma | Female | >=65 | I/II | Unknown | Unknown | SD | |
| RAB17 | SNV | Missense_Mutation | rs374317302 | c.149N>T | p.Thr50Met | p.T50M | Q9H0T7 | protein_coding | deleterious(0) | probably_damaging(1) | TCGA-G4-6628-01 | Colorectum | colon adenocarcinoma | Male | >=65 | I/II | Unknown | Unknown | SD |
| RAB17 | SNV | Missense_Mutation | novel | c.559N>A | p.Glu187Lys | p.E187K | Q9H0T7 | protein_coding | tolerated(1) | benign(0.017) | TCGA-A5-A0G1-01 | Endometrium | uterine corpus endometrioid carcinoma | Female | >=65 | I/II | Unknown | Unknown | SD |
| RAB17 | SNV | Missense_Mutation | rs761536358 | c.112N>T | p.Arg38Trp | p.R38W | Q9H0T7 | protein_coding | deleterious(0) | probably_damaging(0.984) | TCGA-AP-A056-01 | Endometrium | uterine corpus endometrioid carcinoma | Female | <65 | I/II | Unknown | Unknown | SD |
| RAB17 | SNV | Missense_Mutation | rs755087792 | c.610N>A | p.Ala204Thr | p.A204T | Q9H0T7 | protein_coding | tolerated(0.52) | benign(0) | TCGA-AP-A1DK-01 | Endometrium | uterine corpus endometrioid carcinoma | Female | <65 | I/II | Unknown | Unknown | SD |
| Page: 1 2 3 |
Top |
Related drugs of malignant transformation related genes |
| Identification of chemicals and drugs interact with genes involved in malignant transfromation |
| (DGIdb 4.0) |
| Entrez ID | Symbol | Category | Interaction Types | Drug Claim Name | Drug Name | PMIDs |
| Page: 1 |

Copyright 2023-Present -The University of Texas Health Science Center at Houston |