
|
|||||
|
 | |
| |
| |
| |
| |
| |
|
Gene: RAB15 |
Gene summary for RAB15 |
| Gene information | Species | Human | Gene symbol | RAB15 | Gene ID | 376267 |
| Gene name | RAB15, member RAS oncogene family | |
| Gene Alias | RAB15 | |
| Cytomap | 14q23.3 | |
| Gene Type | protein-coding | GO ID | GO:0006810 | UniProtAcc | G5EMR8 |
Top |
Malignant transformation analysis |
| Identification of the aberrant gene expression in precancerous and cancerous lesions by comparing the gene expression of stem-like cells in diseased tissues with normal stem cells |
| Entrez ID | Symbol | Replicates | Species | Organ | Tissue | Adj P-value | Log2FC | Malignancy |
| 376267 | RAB15 | HTA11_3410_2000001011 | Human | Colorectum | AD | 3.43e-05 | 2.22e-01 | 0.0155 |
| 376267 | RAB15 | HTA11_1938_2000001011 | Human | Colorectum | AD | 1.91e-03 | 3.00e-01 | -0.0811 |
| 376267 | RAB15 | HTA11_78_2000001011 | Human | Colorectum | AD | 7.28e-11 | 4.30e-01 | -0.1088 |
| 376267 | RAB15 | HTA11_347_2000001011 | Human | Colorectum | AD | 2.08e-05 | 2.34e-01 | -0.1954 |
| 376267 | RAB15 | HTA11_3361_2000001011 | Human | Colorectum | AD | 1.03e-08 | 4.67e-01 | -0.1207 |
| 376267 | RAB15 | HTA11_696_2000001011 | Human | Colorectum | AD | 1.29e-20 | 6.94e-01 | -0.1464 |
| 376267 | RAB15 | HTA11_866_2000001011 | Human | Colorectum | AD | 1.15e-05 | 4.07e-01 | -0.1001 |
| 376267 | RAB15 | HTA11_1391_2000001011 | Human | Colorectum | AD | 1.29e-16 | 5.59e-01 | -0.059 |
| 376267 | RAB15 | HTA11_546_2000001011 | Human | Colorectum | AD | 4.73e-04 | 4.57e-01 | -0.0842 |
| 376267 | RAB15 | HTA11_866_3004761011 | Human | Colorectum | AD | 4.48e-18 | 5.41e-01 | 0.096 |
| 376267 | RAB15 | HTA11_4255_2000001011 | Human | Colorectum | SER | 4.82e-03 | 3.79e-01 | 0.0446 |
| 376267 | RAB15 | HTA11_10711_2000001011 | Human | Colorectum | AD | 3.44e-04 | 2.67e-01 | 0.0338 |
| 376267 | RAB15 | HTA11_7696_3000711011 | Human | Colorectum | AD | 1.23e-03 | 2.86e-01 | 0.0674 |
| 376267 | RAB15 | HTA11_6818_2000001021 | Human | Colorectum | AD | 9.05e-05 | 2.93e-01 | 0.0588 |
| 376267 | RAB15 | HTA11_99999970781_79442 | Human | Colorectum | MSS | 1.46e-15 | 5.31e-01 | 0.294 |
| 376267 | RAB15 | HTA11_99999965062_69753 | Human | Colorectum | MSI-H | 1.54e-07 | 1.34e+00 | 0.3487 |
| 376267 | RAB15 | HTA11_99999965104_69814 | Human | Colorectum | MSS | 1.20e-11 | 5.11e-01 | 0.281 |
| 376267 | RAB15 | HTA11_99999971662_82457 | Human | Colorectum | MSS | 5.13e-17 | 5.80e-01 | 0.3859 |
| 376267 | RAB15 | HTA11_99999973899_84307 | Human | Colorectum | MSS | 4.15e-22 | 8.88e-01 | 0.2585 |
| 376267 | RAB15 | HTA11_99999974143_84620 | Human | Colorectum | MSS | 9.89e-14 | 4.96e-01 | 0.3005 |
| Page: 1 2 |
| Tissue | Expression Dynamics | Abbreviation |
| Colorectum (GSE201348) | 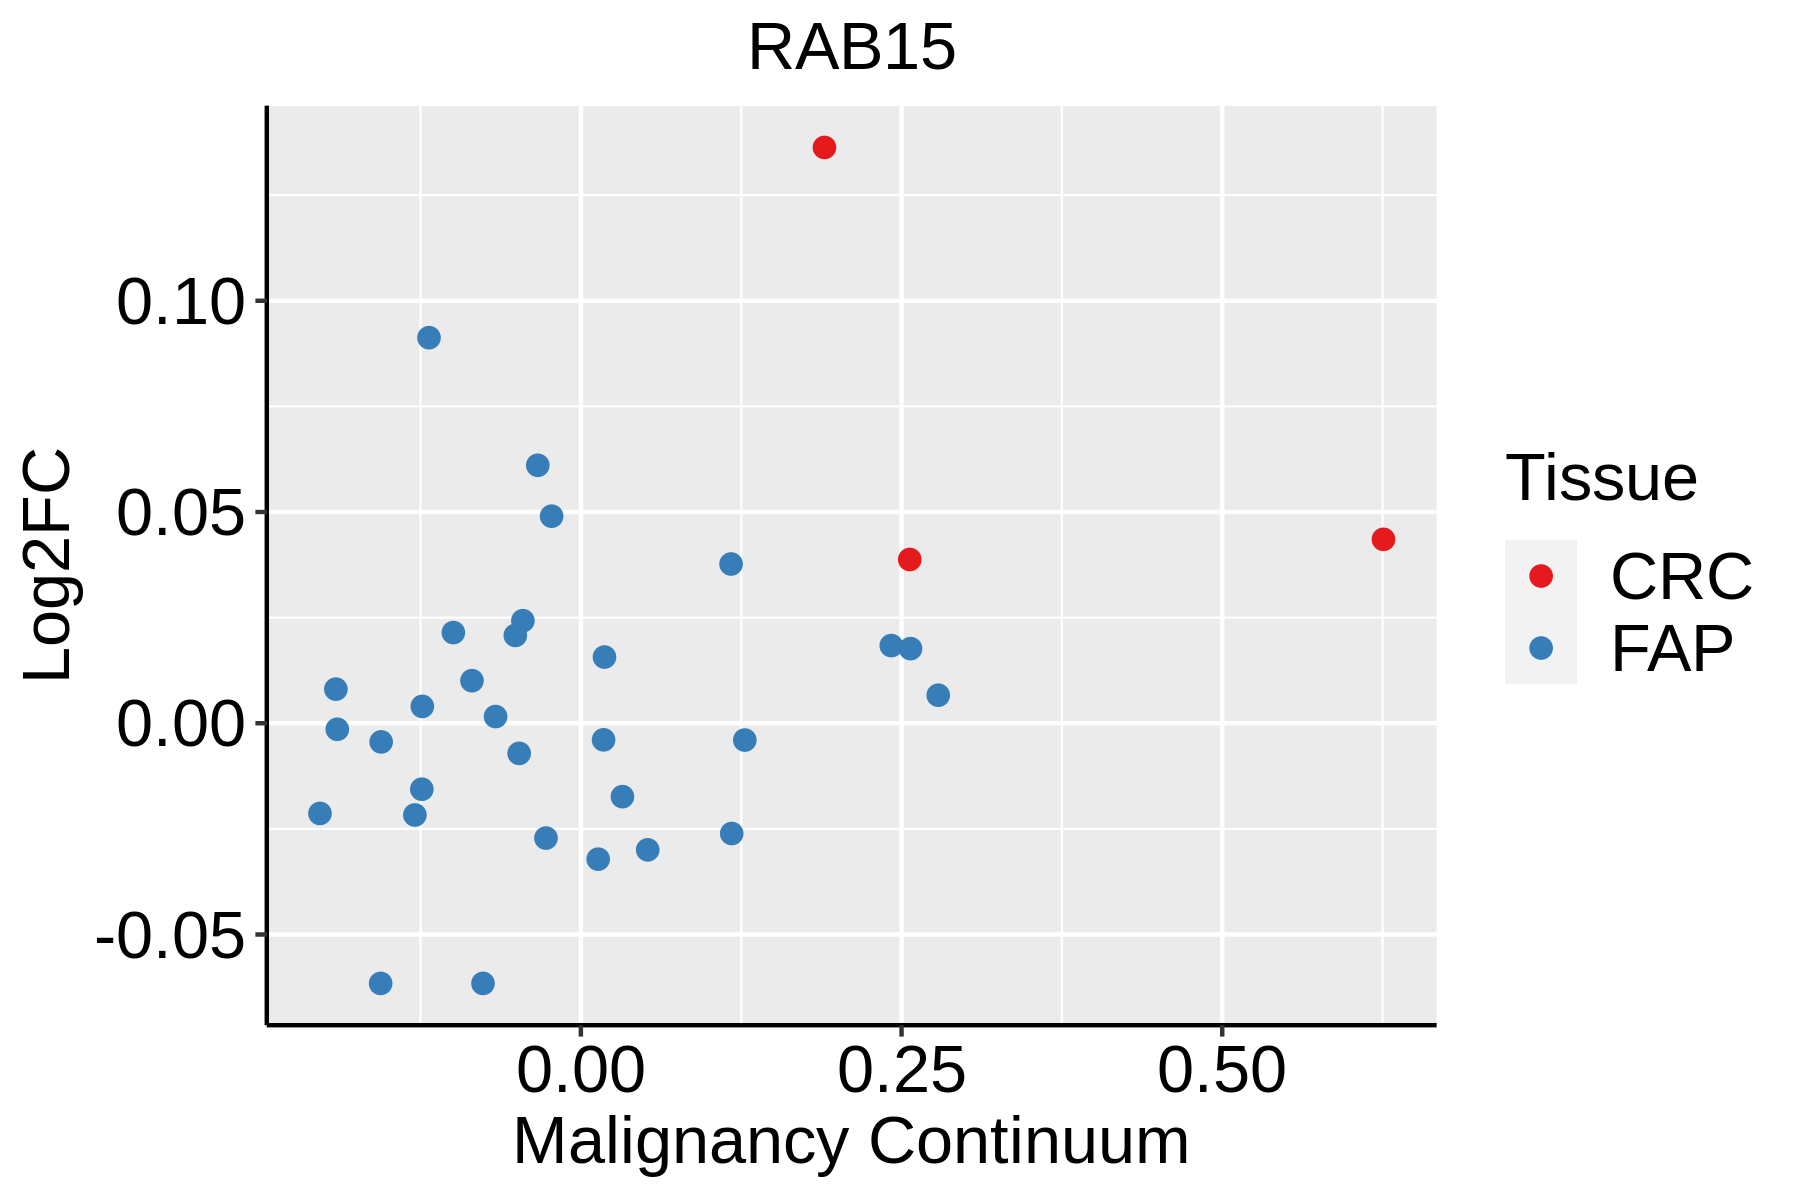 | FAP: Familial adenomatous polyposis |
| CRC: Colorectal cancer | ||
| Colorectum (HTA11) |  | AD: Adenomas |
| SER: Sessile serrated lesions | ||
| MSI-H: Microsatellite-high colorectal cancer | ||
| MSS: Microsatellite stable colorectal cancer | ||
| Liver |  | HCC: Hepatocellular carcinoma |
| NAFLD: Non-alcoholic fatty liver disease |
| ∗log2FC in expression of this searched gene in stem-like cells from each diseased tissue sample relative to stem-like cells in normal samples in each tissue plotted against the malignancy continuum. Samples are colored based on if they are from different disease stage. |
Top |
Malignant transformation related pathway analysis |
| Find out the enriched GO biological processes and KEGG pathways involved in transition from healthy to precancer to cancer |
| Tissue | Disease Stage | Enriched GO biological Processes |
| Colorectum | AD |  |
| Colorectum | SER |  |
| Colorectum | MSS |  |
| Colorectum | MSI-H |  |
| Colorectum | FAP |  |
| ∗Top 15 enriched GO BP terms are showed in the bar plot of each disease state in each tissue. Each row represents a significant GO biological process which is colored according to the -log10(p.adjust). |
| Page: 1 2 3 4 5 6 7 8 9 |
| GO ID | Tissue | Disease Stage | Description | Gene Ratio | Bg Ratio | pvalue | p.adjust | Count |
| GO:0072659 | Colorectum | AD | protein localization to plasma membrane | 122/3918 | 284/18723 | 2.86e-17 | 1.49e-14 | 122 |
| GO:1990778 | Colorectum | AD | protein localization to cell periphery | 129/3918 | 333/18723 | 5.51e-14 | 1.15e-11 | 129 |
| GO:0032868 | Colorectum | AD | response to insulin | 91/3918 | 264/18723 | 2.02e-07 | 8.48e-06 | 91 |
| GO:1901653 | Colorectum | AD | cellular response to peptide | 114/3918 | 359/18723 | 8.32e-07 | 2.88e-05 | 114 |
| GO:0032869 | Colorectum | AD | cellular response to insulin stimulus | 72/3918 | 203/18723 | 1.10e-06 | 3.68e-05 | 72 |
| GO:0071375 | Colorectum | AD | cellular response to peptide hormone stimulus | 95/3918 | 290/18723 | 1.50e-06 | 4.66e-05 | 95 |
| GO:0043434 | Colorectum | AD | response to peptide hormone | 126/3918 | 414/18723 | 2.70e-06 | 7.86e-05 | 126 |
| GO:0007265 | Colorectum | AD | Ras protein signal transduction | 104/3918 | 337/18723 | 1.01e-05 | 2.35e-04 | 104 |
| GO:0009306 | Colorectum | AD | protein secretion | 105/3918 | 359/18723 | 1.05e-04 | 1.57e-03 | 105 |
| GO:0035592 | Colorectum | AD | establishment of protein localization to extracellular region | 105/3918 | 360/18723 | 1.18e-04 | 1.73e-03 | 105 |
| GO:0045921 | Colorectum | AD | positive regulation of exocytosis | 33/3918 | 86/18723 | 1.58e-04 | 2.20e-03 | 33 |
| GO:0071692 | Colorectum | AD | protein localization to extracellular region | 106/3918 | 368/18723 | 1.86e-04 | 2.49e-03 | 106 |
| GO:0051047 | Colorectum | AD | positive regulation of secretion | 90/3918 | 310/18723 | 4.11e-04 | 4.66e-03 | 90 |
| GO:1903532 | Colorectum | AD | positive regulation of secretion by cell | 82/3918 | 282/18723 | 6.85e-04 | 7.00e-03 | 82 |
| GO:0022406 | Colorectum | AD | membrane docking | 31/3918 | 86/18723 | 8.67e-04 | 8.45e-03 | 31 |
| GO:0140056 | Colorectum | AD | organelle localization by membrane tethering | 28/3918 | 77/18723 | 1.29e-03 | 1.14e-02 | 28 |
| GO:0006887 | Colorectum | AD | exocytosis | 96/3918 | 352/18723 | 2.48e-03 | 1.90e-02 | 96 |
| GO:0017157 | Colorectum | AD | regulation of exocytosis | 59/3918 | 202/18723 | 3.20e-03 | 2.36e-02 | 59 |
| GO:00726591 | Colorectum | SER | protein localization to plasma membrane | 92/2897 | 284/18723 | 6.36e-13 | 1.86e-10 | 92 |
| GO:19907781 | Colorectum | SER | protein localization to cell periphery | 98/2897 | 333/18723 | 6.09e-11 | 9.57e-09 | 98 |
| Page: 1 2 3 4 |
| Pathway ID | Tissue | Disease Stage | Description | Gene Ratio | Bg Ratio | pvalue | p.adjust | qvalue | Count |
| Page: 1 |
Top |
Cell-cell communication analysis |
| Identification of potential cell-cell interactions between two cell types and their ligand-receptor pairs for different disease states |
| Ligand | Receptor | LRpair | Pathway | Tissue | Disease Stage |
| Page: 1 |
Top |
Single-cell gene regulatory network inference analysis |
| Find out the significant the regulons (TFs) and the target genes of each regulon across cell types for different disease states |
| TF | Cell Type | Tissue | Disease Stage | Target Gene | RSS | Regulon Activity |
| ∗The dot plots of a searched regulon are shown for all cell subpopulations in each disease state of each tissue based on the regulon specific score inferred using pySCENIC and by calculating the average expression. |
| Page: 1 |
Top |
Somatic mutation of malignant transformation related genes |
| Annotation of somatic variants for genes involved in malignant transformation |
| Hugo Symbol | Variant Class | Variant Classification | dbSNP RS | HGVSc | HGVSp | HGVSp Short | SWISSPROT | BIOTYPE | SIFT | PolyPhen | Tumor Sample Barcode | Tissue | Histology | Sex | Age | Stage | Therapy Types | Drugs | Outcome |
| RAB15 | SNV | Missense_Mutation | novel | c.308T>G | p.Val103Gly | p.V103G | P59190 | protein_coding | deleterious(0.01) | benign(0.255) | TCGA-A8-A09M-01 | Breast | breast invasive carcinoma | Female | >=65 | III/IV | Chemotherapy | paclitaxel | CR |
| RAB15 | insertion | Frame_Shift_Ins | novel | c.306_307insCCCATAGGAAGGAGCTGGAA | p.Val103ProfsTer70 | p.V103Pfs*70 | P59190 | protein_coding | TCGA-A8-A09M-01 | Breast | breast invasive carcinoma | Female | >=65 | III/IV | Chemotherapy | paclitaxel | CR | ||
| RAB15 | SNV | Missense_Mutation | c.386N>A | p.Arg129Gln | p.R129Q | P59190 | protein_coding | deleterious(0) | probably_damaging(1) | TCGA-AA-3984-01 | Colorectum | colon adenocarcinoma | Female | <65 | I/II | Unknown | Unknown | SD | |
| RAB15 | SNV | Missense_Mutation | novel | c.407N>A | p.Gly136Glu | p.G136E | P59190 | protein_coding | deleterious(0) | probably_damaging(0.999) | TCGA-AD-6964-01 | Colorectum | colon adenocarcinoma | Male | <65 | III/IV | Chemotherapy | folfox | PD |
| RAB15 | SNV | Missense_Mutation | rs757929489 | c.620C>T | p.Ser207Leu | p.S207L | P59190 | protein_coding | tolerated(0.18) | benign(0.01) | TCGA-A5-A0G2-01 | Endometrium | uterine corpus endometrioid carcinoma | Female | <65 | III/IV | Unknown | Unknown | SD |
| RAB15 | SNV | Missense_Mutation | rs367753617 | c.280N>T | p.Arg94Cys | p.R94C | P59190 | protein_coding | deleterious(0) | probably_damaging(0.937) | TCGA-AJ-A3IA-01 | Endometrium | uterine corpus endometrioid carcinoma | Female | >=65 | I/II | Unknown | Unknown | SD |
| RAB15 | SNV | Missense_Mutation | novel | c.23T>C | p.Leu8Pro | p.L8P | P59190 | protein_coding | deleterious(0) | probably_damaging(0.987) | TCGA-AP-A1DK-01 | Endometrium | uterine corpus endometrioid carcinoma | Female | <65 | I/II | Unknown | Unknown | SD |
| RAB15 | SNV | Missense_Mutation | rs530144601 | c.542N>A | p.Arg181Gln | p.R181Q | P59190 | protein_coding | tolerated(0.28) | benign(0.177) | TCGA-AX-A1C5-01 | Endometrium | uterine corpus endometrioid carcinoma | Female | <65 | III/IV | Unspecific | Carboplatin | SD |
| RAB15 | SNV | Missense_Mutation | rs746474278 | c.611C>T | p.Ala204Val | p.A204V | P59190 | protein_coding | tolerated(0.31) | benign(0) | TCGA-AX-A1CE-01 | Endometrium | uterine corpus endometrioid carcinoma | Female | <65 | I/II | Unspecific | Paclitaxel | SD |
| RAB15 | SNV | Missense_Mutation | c.490N>A | p.Arg164Ser | p.R164S | P59190 | protein_coding | tolerated(0.7) | benign(0.243) | TCGA-B5-A5OC-01 | Endometrium | uterine corpus endometrioid carcinoma | Female | >=65 | III/IV | Chemotherapy | cisplatin | SD |
| Page: 1 2 |
Top |
Related drugs of malignant transformation related genes |
| Identification of chemicals and drugs interact with genes involved in malignant transfromation |
| (DGIdb 4.0) |
| Entrez ID | Symbol | Category | Interaction Types | Drug Claim Name | Drug Name | PMIDs |
| Page: 1 |

Copyright 2023-Present -The University of Texas Health Science Center at Houston |