
|
|||||
|
 | |
| |
| |
| |
| |
| |
|
Gene: RAB14 |
Gene summary for RAB14 |
| Gene information | Species | Human | Gene symbol | RAB14 | Gene ID | 51552 |
| Gene name | RAB14, member RAS oncogene family | |
| Gene Alias | FBP | |
| Cytomap | 9q33.2 | |
| Gene Type | protein-coding | GO ID | GO:0001845 | UniProtAcc | A0A024R845 |
Top |
Malignant transformation analysis |
| Identification of the aberrant gene expression in precancerous and cancerous lesions by comparing the gene expression of stem-like cells in diseased tissues with normal stem cells |
| Entrez ID | Symbol | Replicates | Species | Organ | Tissue | Adj P-value | Log2FC | Malignancy |
| 51552 | RAB14 | LZE2T | Human | Esophagus | ESCC | 1.64e-02 | 5.90e-01 | 0.082 |
| 51552 | RAB14 | LZE4T | Human | Esophagus | ESCC | 2.44e-13 | 7.87e-01 | 0.0811 |
| 51552 | RAB14 | LZE7T | Human | Esophagus | ESCC | 5.72e-03 | 5.17e-01 | 0.0667 |
| 51552 | RAB14 | LZE8T | Human | Esophagus | ESCC | 2.78e-10 | 3.54e-01 | 0.067 |
| 51552 | RAB14 | LZE20T | Human | Esophagus | ESCC | 1.51e-07 | 6.80e-01 | 0.0662 |
| 51552 | RAB14 | LZE22D1 | Human | Esophagus | HGIN | 5.15e-05 | -3.16e-02 | 0.0595 |
| 51552 | RAB14 | LZE24T | Human | Esophagus | ESCC | 8.41e-15 | 6.72e-01 | 0.0596 |
| 51552 | RAB14 | LZE6T | Human | Esophagus | ESCC | 1.07e-04 | 4.40e-01 | 0.0845 |
| 51552 | RAB14 | P1T-E | Human | Esophagus | ESCC | 2.32e-08 | 7.30e-01 | 0.0875 |
| 51552 | RAB14 | P2T-E | Human | Esophagus | ESCC | 8.95e-64 | 1.30e+00 | 0.1177 |
| 51552 | RAB14 | P4T-E | Human | Esophagus | ESCC | 5.54e-39 | 1.01e+00 | 0.1323 |
| 51552 | RAB14 | P5T-E | Human | Esophagus | ESCC | 3.93e-17 | 3.86e-01 | 0.1327 |
| 51552 | RAB14 | P8T-E | Human | Esophagus | ESCC | 5.67e-26 | 6.98e-01 | 0.0889 |
| 51552 | RAB14 | P9T-E | Human | Esophagus | ESCC | 2.12e-13 | 5.60e-01 | 0.1131 |
| 51552 | RAB14 | P10T-E | Human | Esophagus | ESCC | 1.18e-45 | 1.00e+00 | 0.116 |
| 51552 | RAB14 | P11T-E | Human | Esophagus | ESCC | 1.59e-20 | 1.19e+00 | 0.1426 |
| 51552 | RAB14 | P12T-E | Human | Esophagus | ESCC | 3.59e-31 | 9.14e-01 | 0.1122 |
| 51552 | RAB14 | P15T-E | Human | Esophagus | ESCC | 1.55e-32 | 9.64e-01 | 0.1149 |
| 51552 | RAB14 | P16T-E | Human | Esophagus | ESCC | 3.50e-32 | 8.14e-01 | 0.1153 |
| 51552 | RAB14 | P17T-E | Human | Esophagus | ESCC | 3.52e-05 | 7.58e-01 | 0.1278 |
| Page: 1 2 3 4 5 6 7 |
| Tissue | Expression Dynamics | Abbreviation |
| Esophagus | 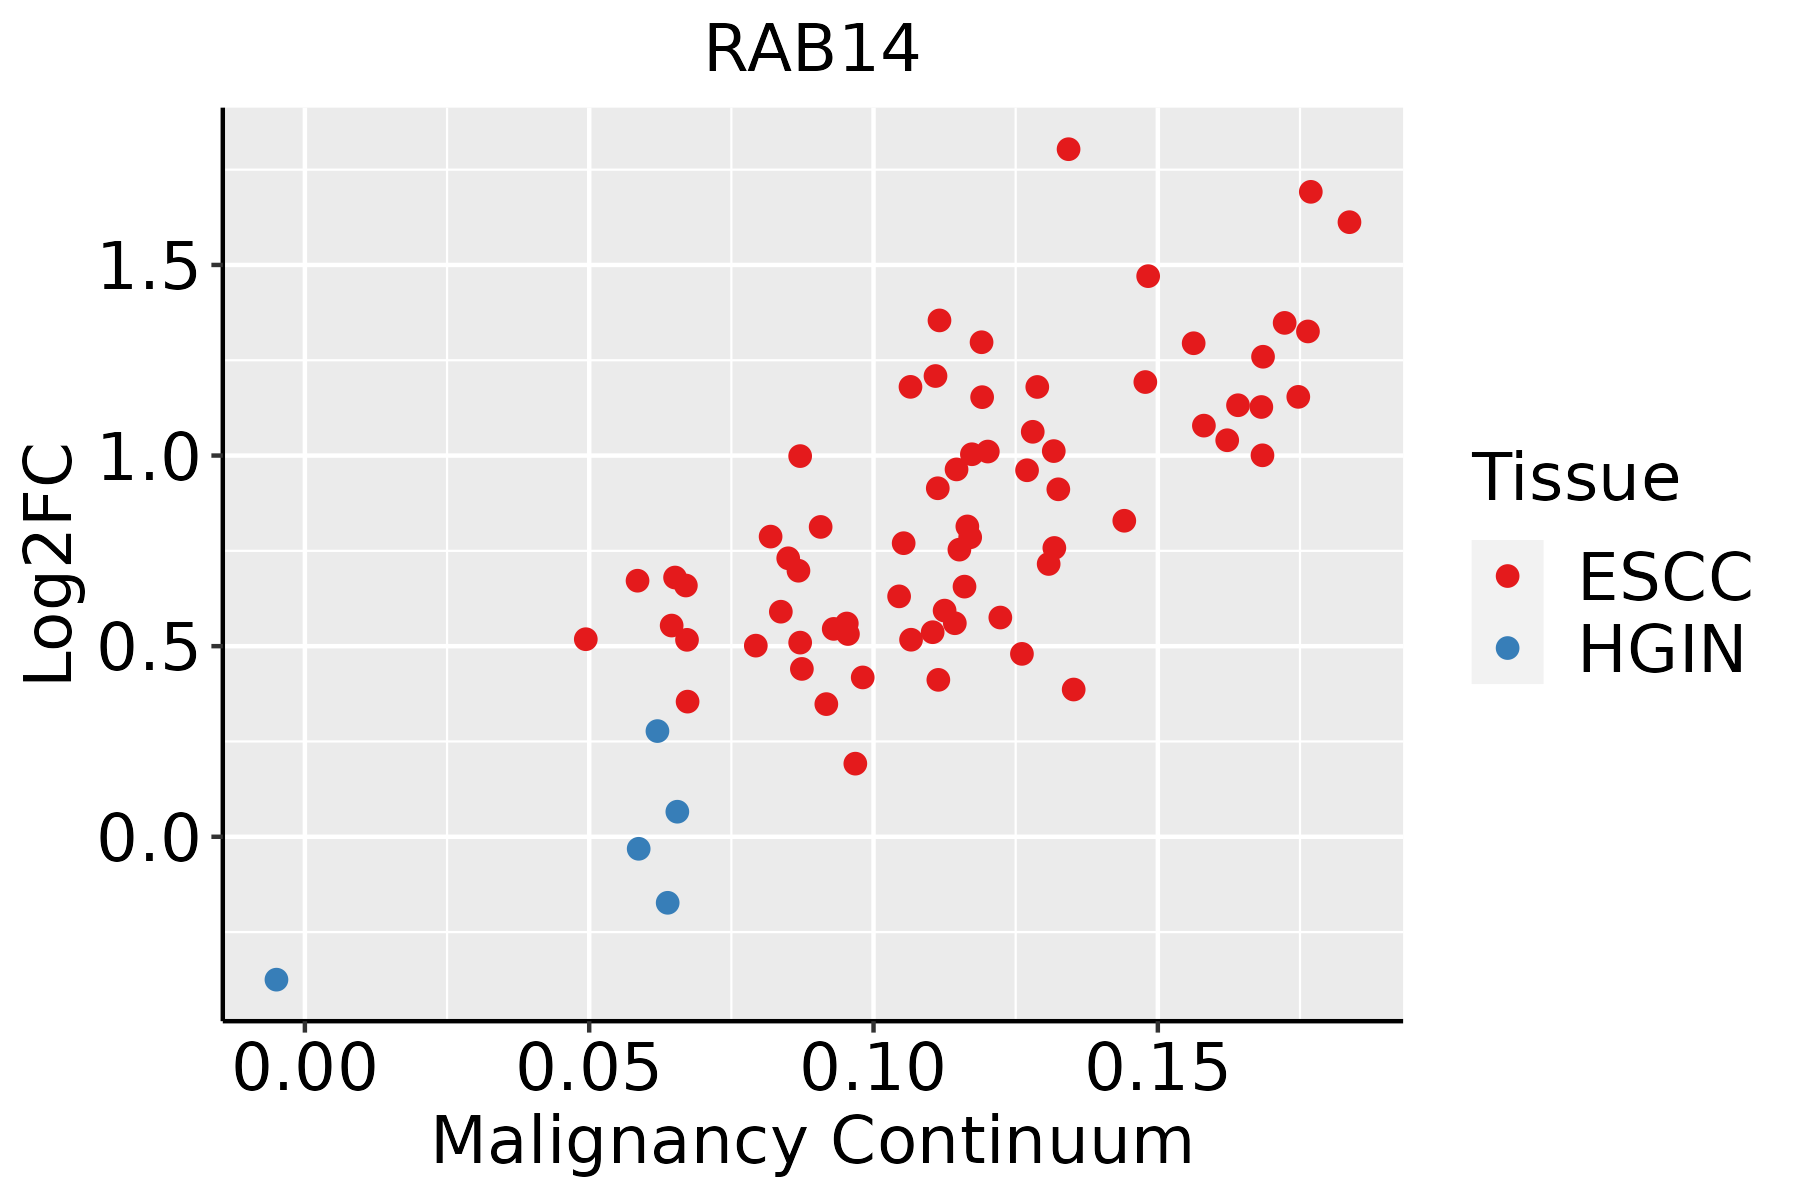 | ESCC: Esophageal squamous cell carcinoma |
| HGIN: High-grade intraepithelial neoplasias | ||
| LGIN: Low-grade intraepithelial neoplasias | ||
| Liver | 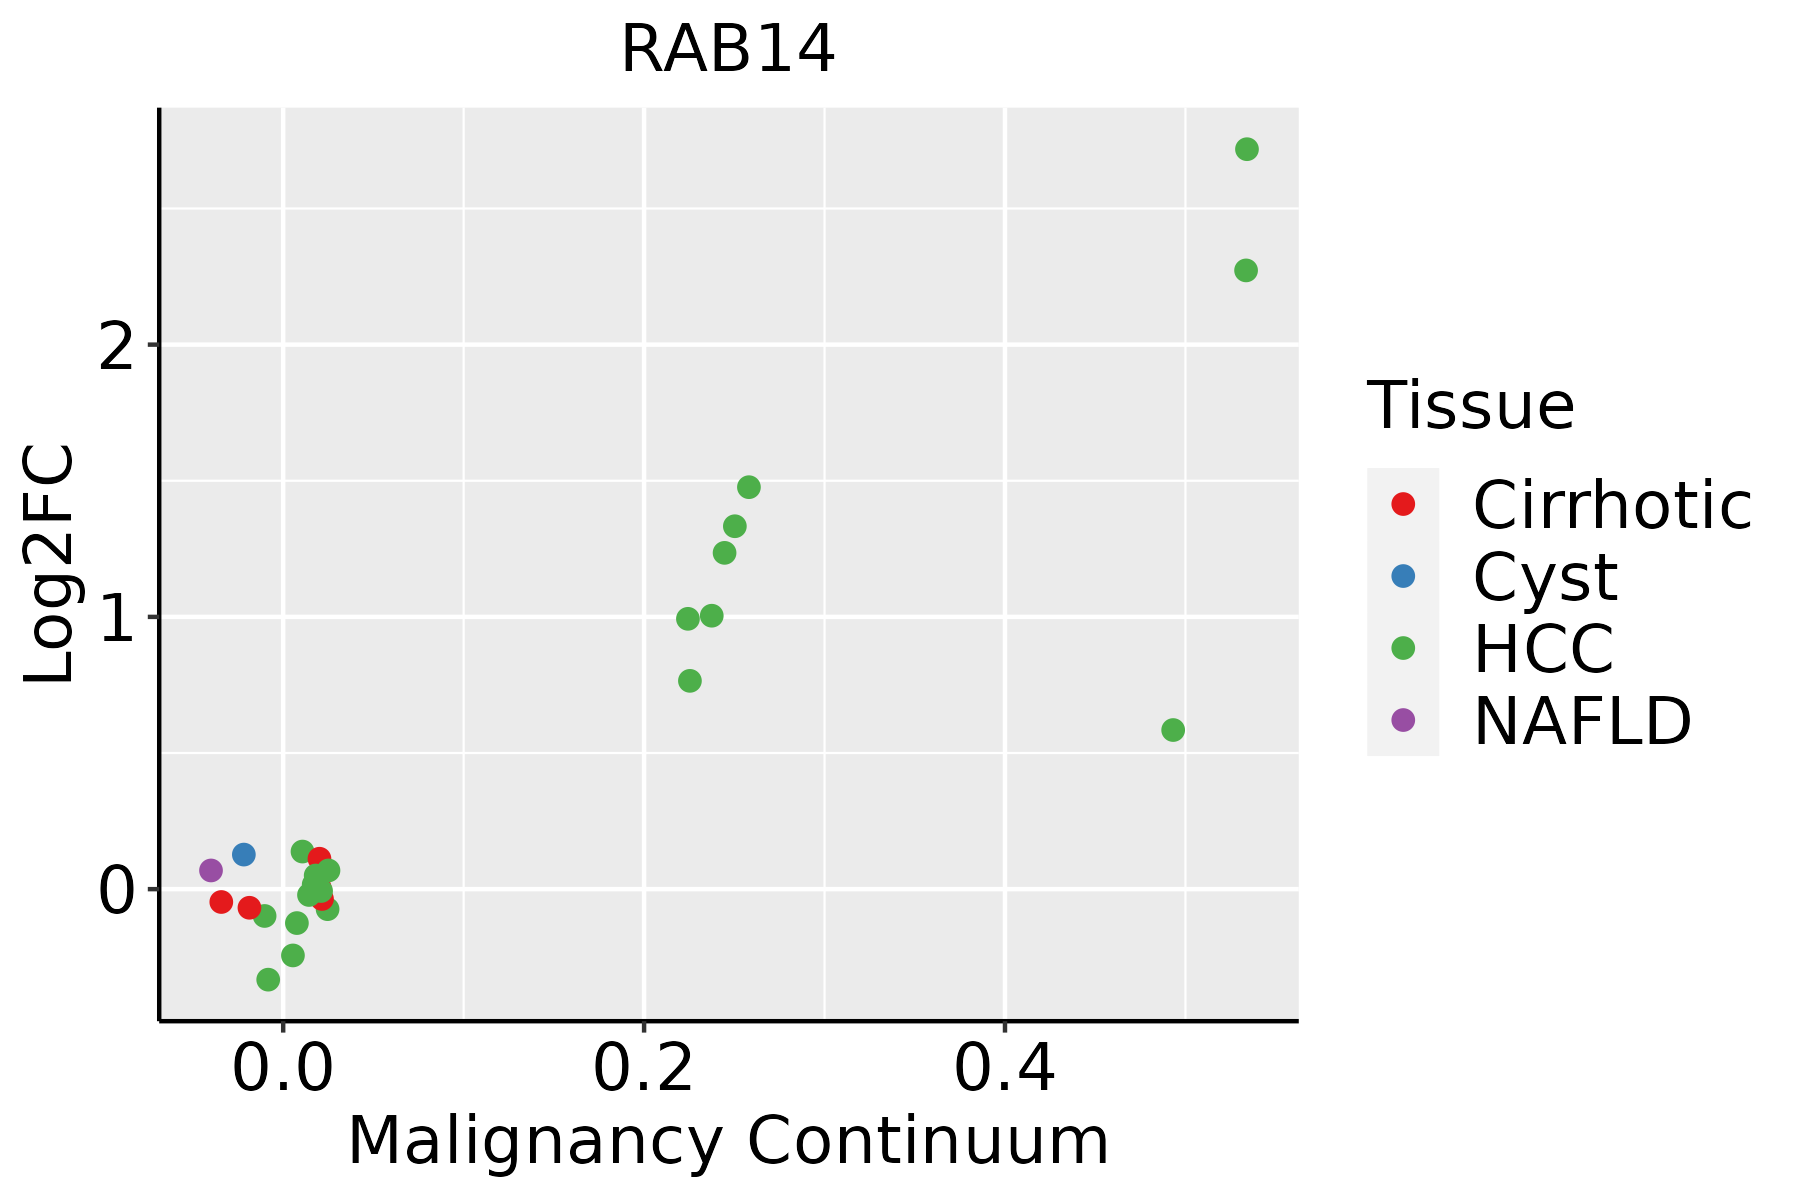 | HCC: Hepatocellular carcinoma |
| NAFLD: Non-alcoholic fatty liver disease | ||
| Oral Cavity | 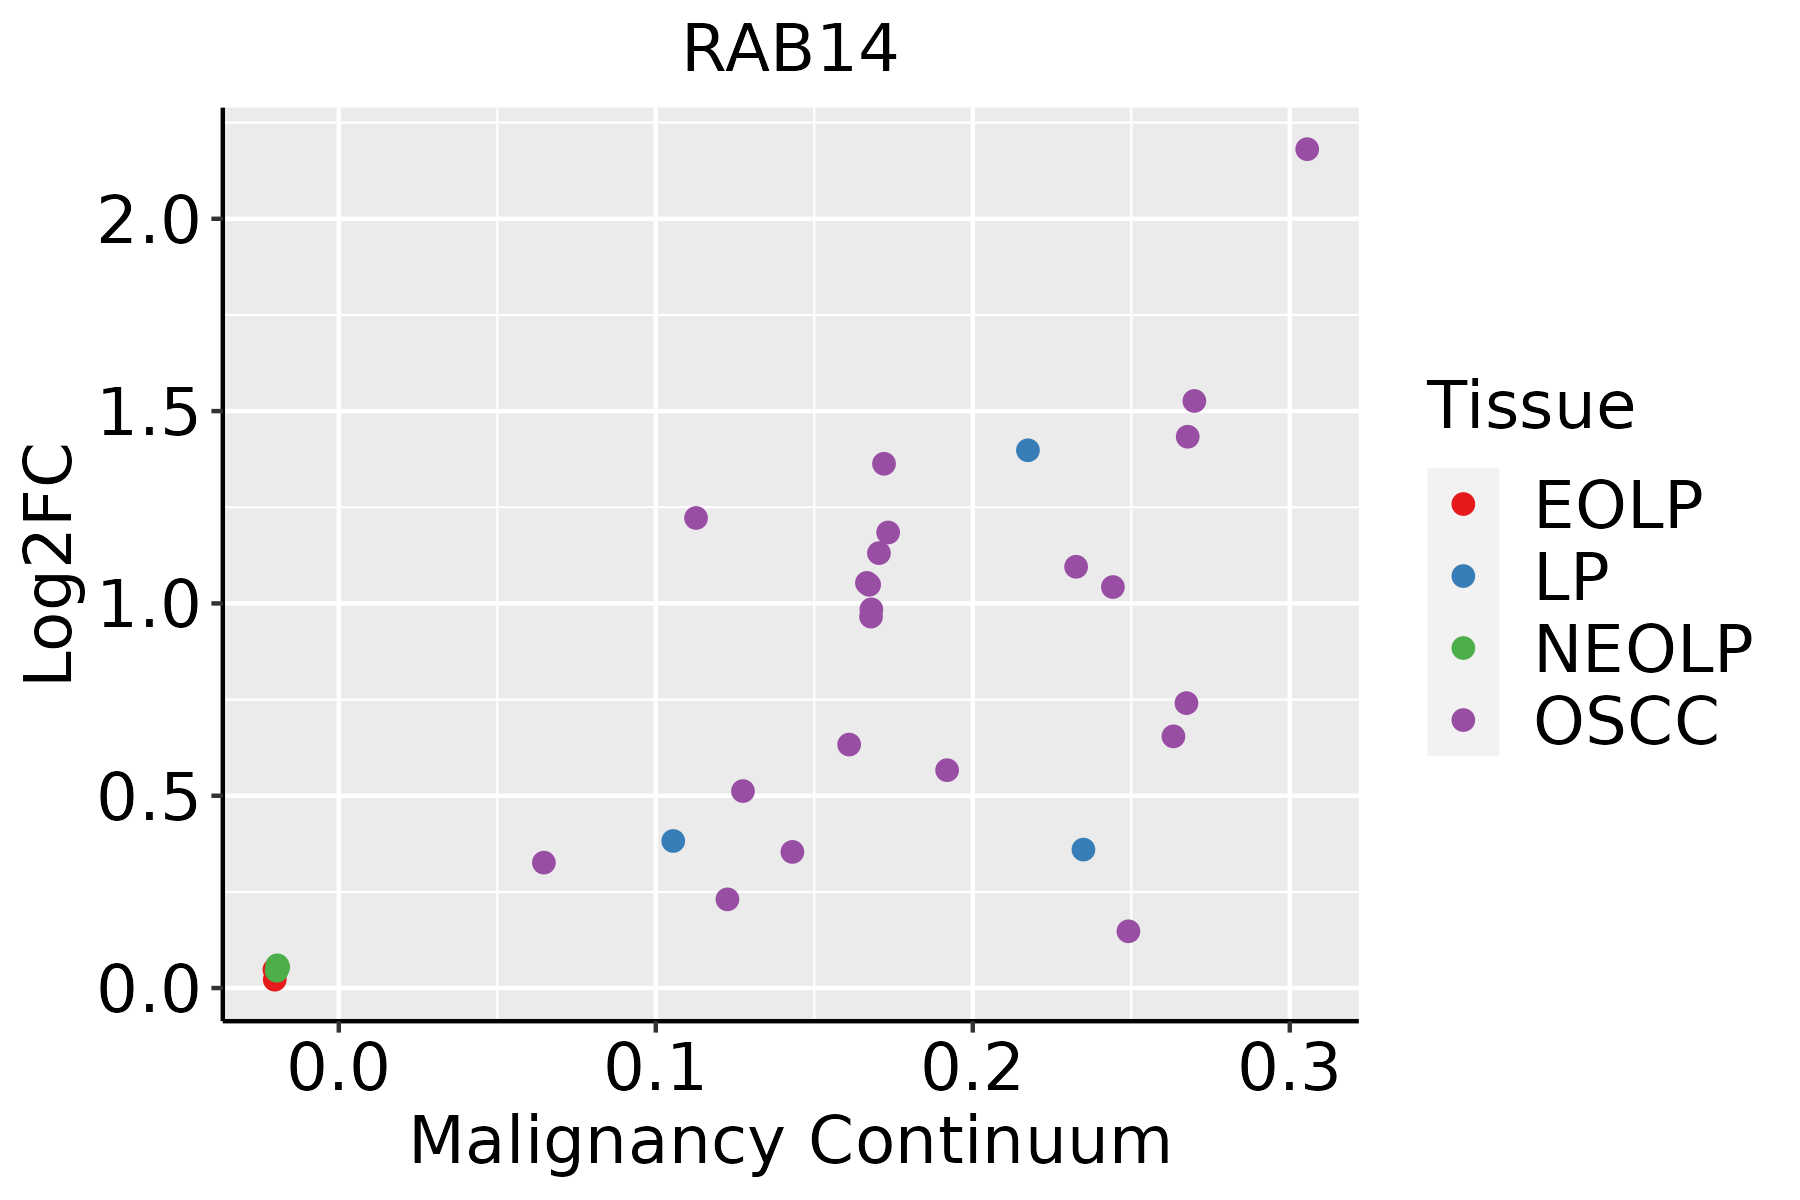 | EOLP: Erosive Oral lichen planus |
| LP: leukoplakia | ||
| NEOLP: Non-erosive oral lichen planus | ||
| OSCC: Oral squamous cell carcinoma | ||
| Prostate | 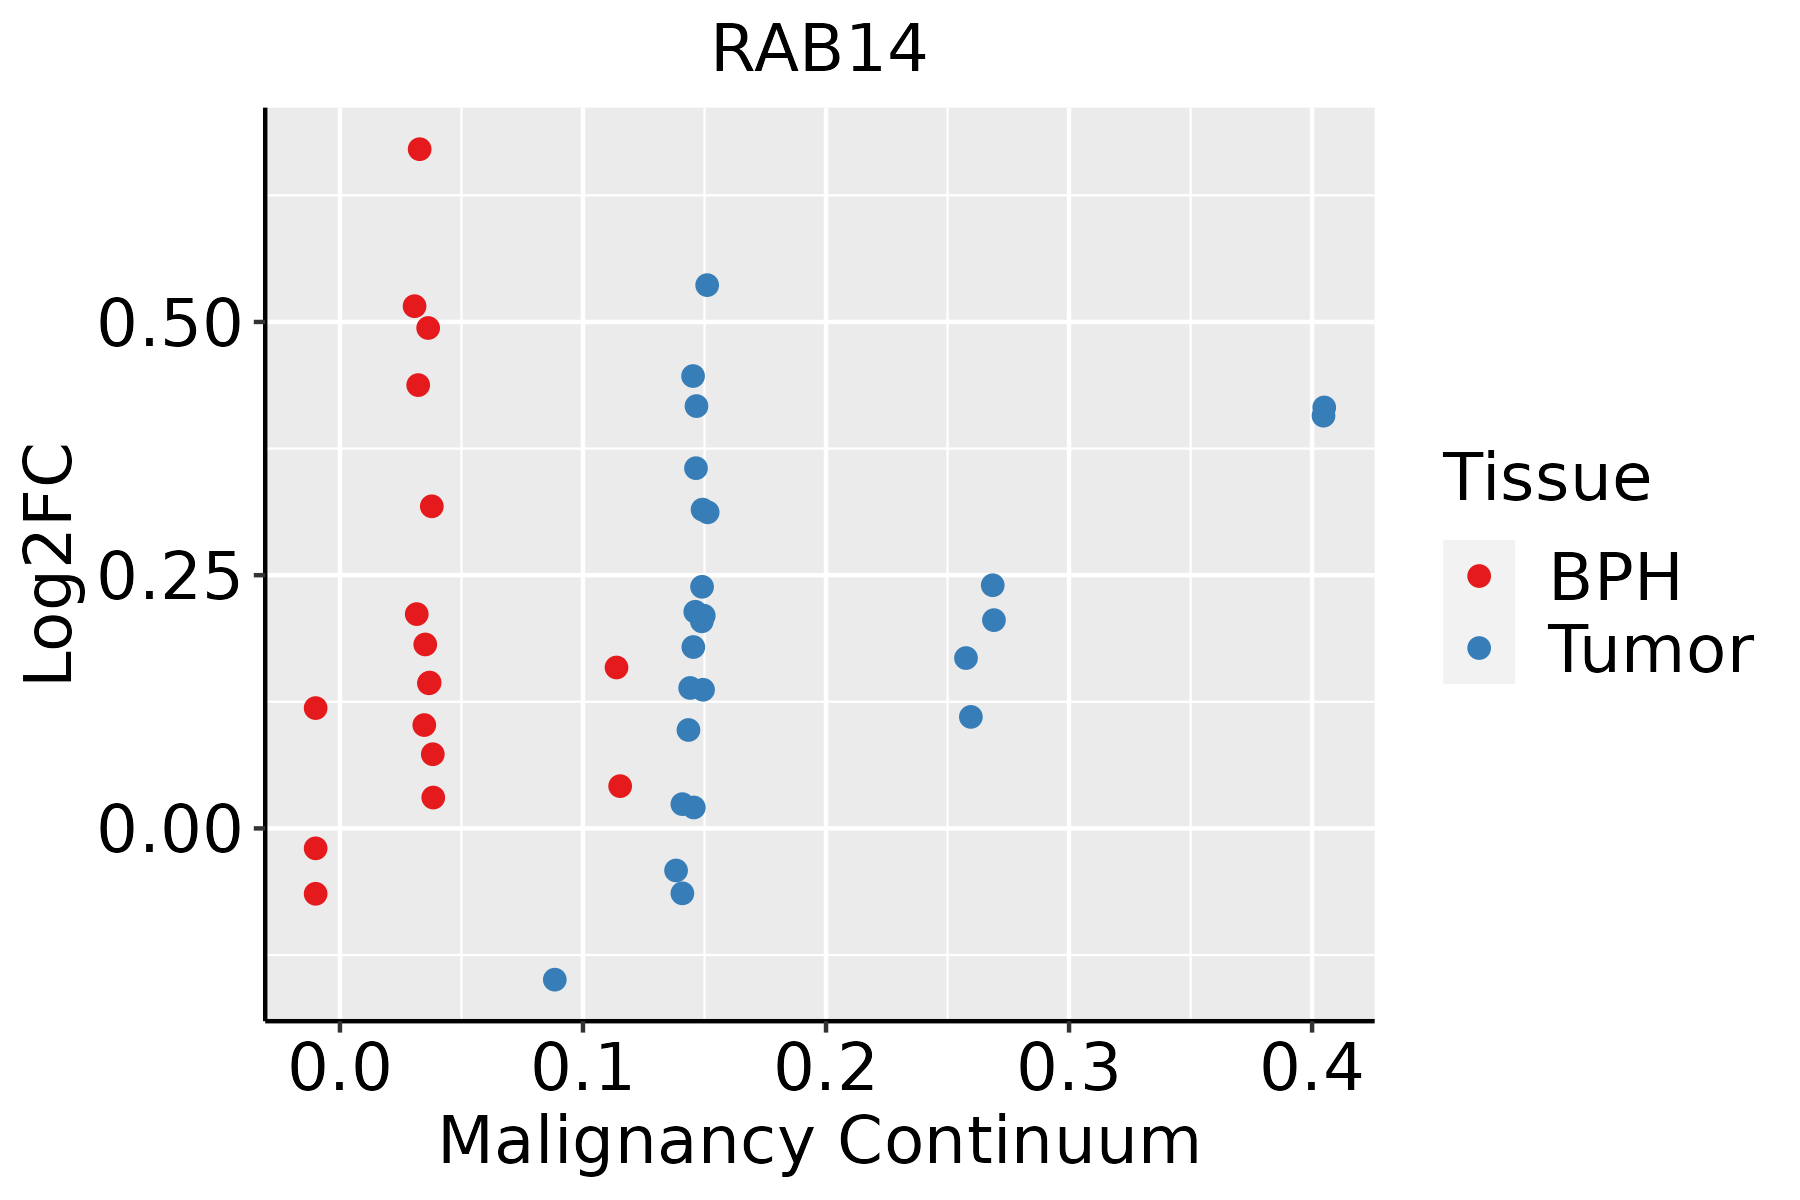 | BPH: Benign Prostatic Hyperplasia |
| Skin | 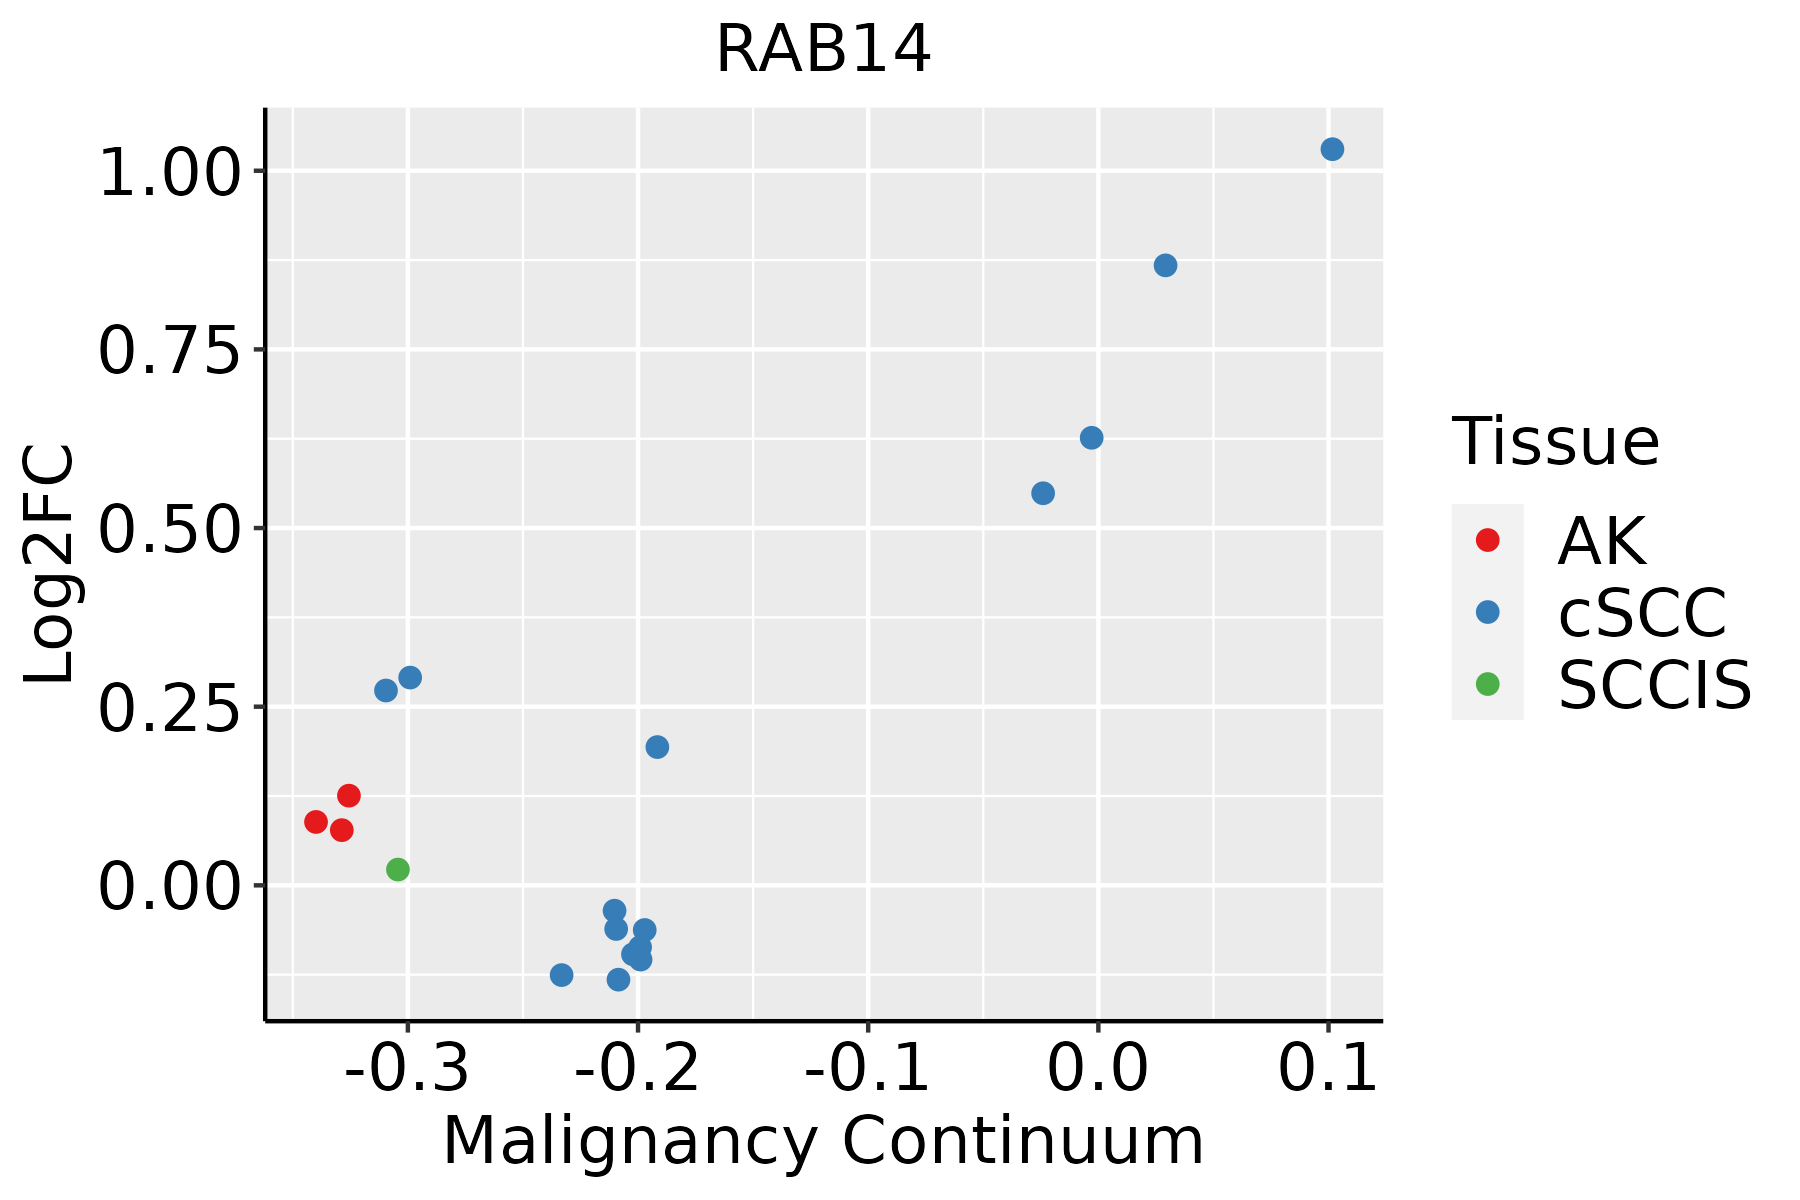 | AK: Actinic keratosis |
| cSCC: Cutaneous squamous cell carcinoma | ||
| SCCIS:squamous cell carcinoma in situ | ||
| Thyroid | 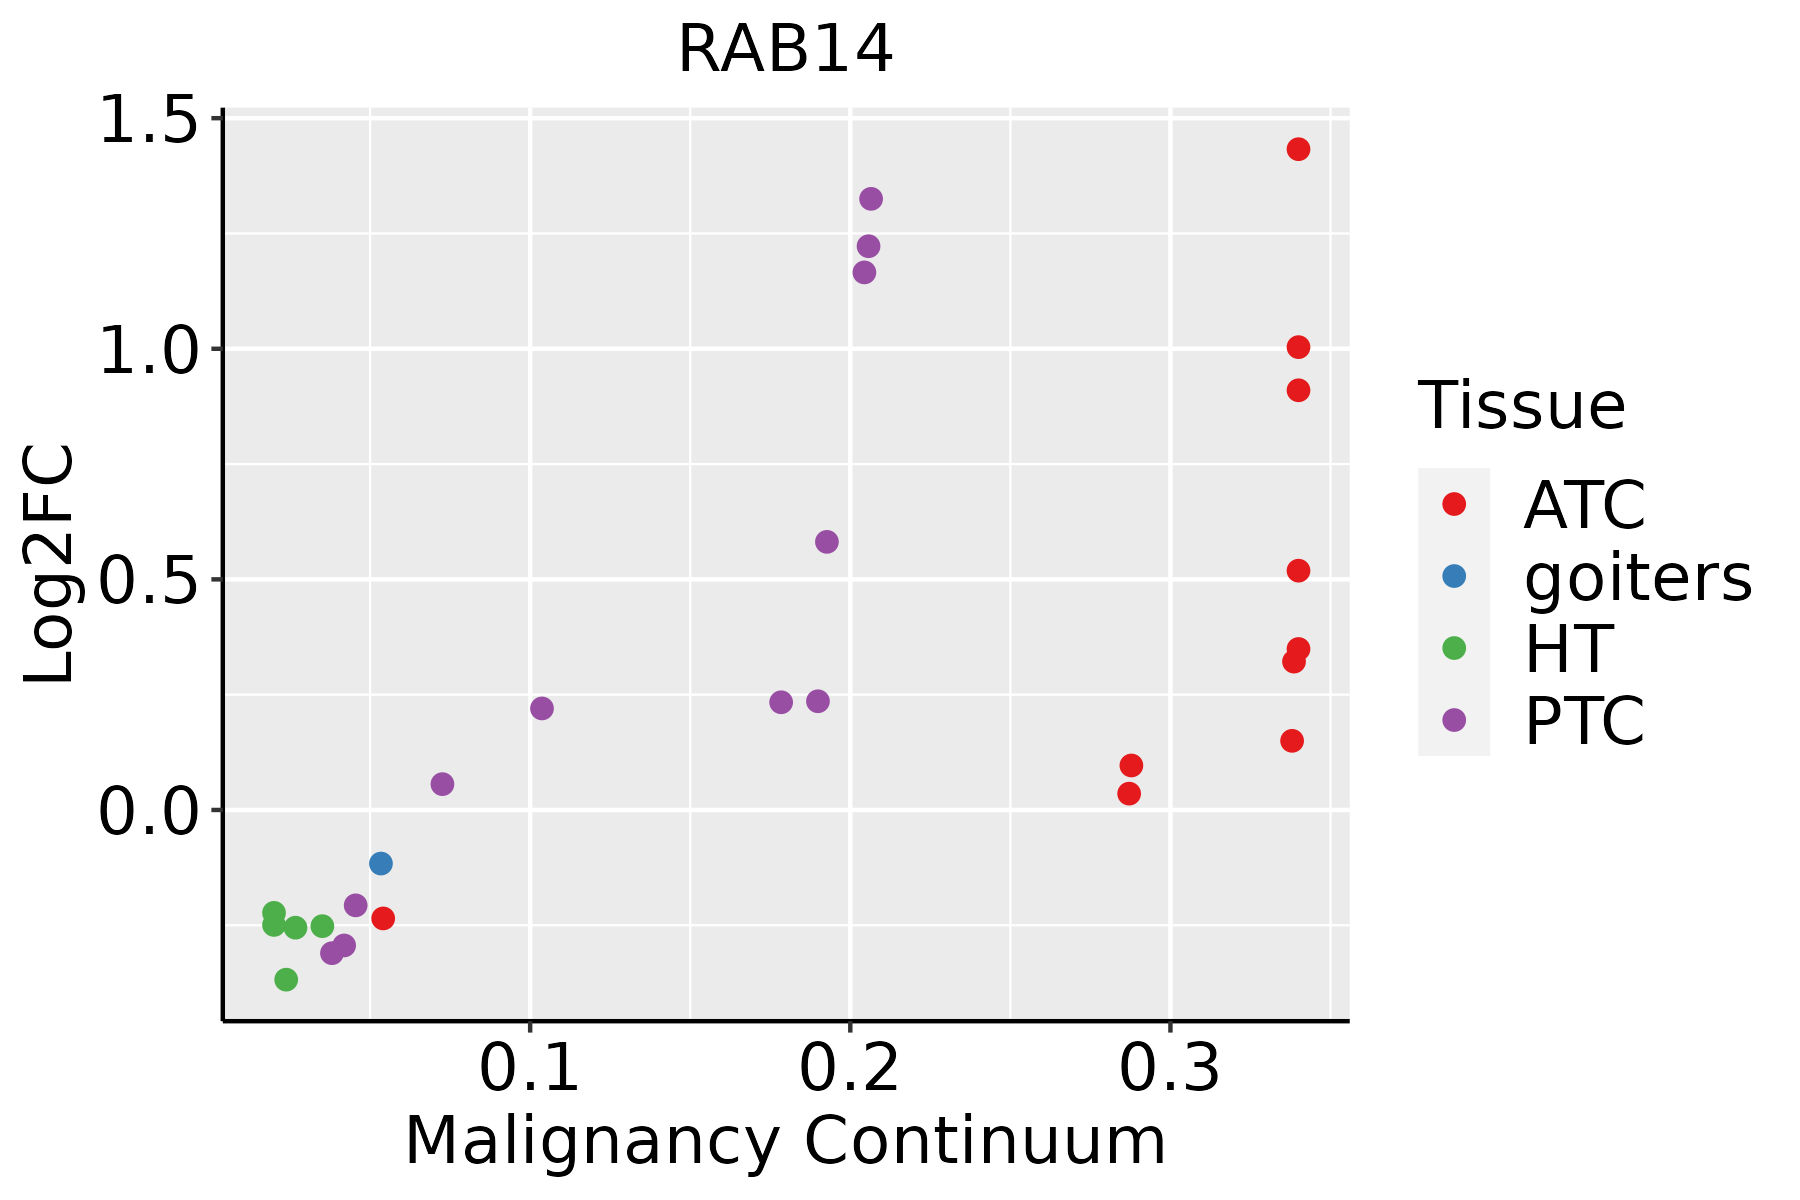 | ATC: Anaplastic thyroid cancer |
| HT: Hashimoto's thyroiditis | ||
| PTC: Papillary thyroid cancer |
| ∗log2FC in expression of this searched gene in stem-like cells from each diseased tissue sample relative to stem-like cells in normal samples in each tissue plotted against the malignancy continuum. Samples are colored based on if they are from different disease stage. |
Top |
Malignant transformation related pathway analysis |
| Find out the enriched GO biological processes and KEGG pathways involved in transition from healthy to precancer to cancer |
| Tissue | Disease Stage | Enriched GO biological Processes |
| Colorectum | AD |  |
| Colorectum | SER |  |
| Colorectum | MSS |  |
| Colorectum | MSI-H |  |
| Colorectum | FAP |  |
| ∗Top 15 enriched GO BP terms are showed in the bar plot of each disease state in each tissue. Each row represents a significant GO biological process which is colored according to the -log10(p.adjust). |
| Page: 1 2 3 4 5 6 7 8 9 |
| GO ID | Tissue | Disease Stage | Description | Gene Ratio | Bg Ratio | pvalue | p.adjust | Count |
| GO:004819317 | Esophagus | HGIN | Golgi vesicle transport | 83/2587 | 296/18723 | 8.59e-11 | 8.89e-09 | 83 |
| GO:001619710 | Esophagus | HGIN | endosomal transport | 57/2587 | 230/18723 | 5.74e-06 | 1.81e-04 | 57 |
| GO:009887610 | Esophagus | HGIN | vesicle-mediated transport to the plasma membrane | 36/2587 | 136/18723 | 6.76e-05 | 1.55e-03 | 36 |
| GO:00070336 | Esophagus | HGIN | vacuole organization | 44/2587 | 180/18723 | 8.97e-05 | 1.96e-03 | 44 |
| GO:00160509 | Esophagus | HGIN | vesicle organization | 65/2587 | 300/18723 | 1.24e-04 | 2.54e-03 | 65 |
| GO:000689210 | Esophagus | HGIN | post-Golgi vesicle-mediated transport | 26/2587 | 104/18723 | 1.63e-03 | 1.81e-02 | 26 |
| GO:004819318 | Esophagus | ESCC | Golgi vesicle transport | 231/8552 | 296/18723 | 1.82e-30 | 9.63e-28 | 231 |
| GO:001605014 | Esophagus | ESCC | vesicle organization | 211/8552 | 300/18723 | 2.85e-18 | 2.87e-16 | 211 |
| GO:001619715 | Esophagus | ESCC | endosomal transport | 168/8552 | 230/18723 | 2.28e-17 | 1.93e-15 | 168 |
| GO:001648210 | Esophagus | ESCC | cytosolic transport | 124/8552 | 168/18723 | 9.69e-14 | 4.69e-12 | 124 |
| GO:000689215 | Esophagus | ESCC | post-Golgi vesicle-mediated transport | 82/8552 | 104/18723 | 4.00e-12 | 1.55e-10 | 82 |
| GO:000703314 | Esophagus | ESCC | vacuole organization | 127/8552 | 180/18723 | 1.04e-11 | 3.85e-10 | 127 |
| GO:009887615 | Esophagus | ESCC | vesicle-mediated transport to the plasma membrane | 99/8552 | 136/18723 | 1.13e-10 | 3.39e-09 | 99 |
| GO:00070403 | Esophagus | ESCC | lysosome organization | 53/8552 | 74/18723 | 5.34e-06 | 5.57e-05 | 53 |
| GO:00801713 | Esophagus | ESCC | lytic vacuole organization | 53/8552 | 74/18723 | 5.34e-06 | 5.57e-05 | 53 |
| GO:00324565 | Esophagus | ESCC | endocytic recycling | 51/8552 | 73/18723 | 2.47e-05 | 2.10e-04 | 51 |
| GO:0090382 | Esophagus | ESCC | phagosome maturation | 19/8552 | 25/18723 | 2.03e-03 | 9.08e-03 | 19 |
| GO:00068953 | Esophagus | ESCC | Golgi to endosome transport | 13/8552 | 17/18723 | 1.00e-02 | 3.42e-02 | 13 |
| GO:004819311 | Liver | Cirrhotic | Golgi vesicle transport | 153/4634 | 296/18723 | 1.02e-23 | 6.43e-21 | 153 |
| GO:001605011 | Liver | Cirrhotic | vesicle organization | 133/4634 | 300/18723 | 7.35e-14 | 6.41e-12 | 133 |
| Page: 1 2 3 4 5 6 |
| Pathway ID | Tissue | Disease Stage | Description | Gene Ratio | Bg Ratio | pvalue | p.adjust | qvalue | Count |
| hsa0415210 | Esophagus | ESCC | AMPK signaling pathway | 80/4205 | 121/8465 | 1.73e-04 | 6.67e-04 | 3.42e-04 | 80 |
| hsa0415213 | Esophagus | ESCC | AMPK signaling pathway | 80/4205 | 121/8465 | 1.73e-04 | 6.67e-04 | 3.42e-04 | 80 |
| hsa0415221 | Liver | Cirrhotic | AMPK signaling pathway | 49/2530 | 121/8465 | 7.90e-03 | 2.74e-02 | 1.69e-02 | 49 |
| hsa0415231 | Liver | Cirrhotic | AMPK signaling pathway | 49/2530 | 121/8465 | 7.90e-03 | 2.74e-02 | 1.69e-02 | 49 |
| hsa0415241 | Liver | HCC | AMPK signaling pathway | 77/4020 | 121/8465 | 2.32e-04 | 1.11e-03 | 6.18e-04 | 77 |
| hsa0415251 | Liver | HCC | AMPK signaling pathway | 77/4020 | 121/8465 | 2.32e-04 | 1.11e-03 | 6.18e-04 | 77 |
| hsa041529 | Oral cavity | OSCC | AMPK signaling pathway | 71/3704 | 121/8465 | 6.29e-04 | 1.86e-03 | 9.49e-04 | 71 |
| hsa0415212 | Oral cavity | OSCC | AMPK signaling pathway | 71/3704 | 121/8465 | 6.29e-04 | 1.86e-03 | 9.49e-04 | 71 |
| Page: 1 |
Top |
Cell-cell communication analysis |
| Identification of potential cell-cell interactions between two cell types and their ligand-receptor pairs for different disease states |
| Ligand | Receptor | LRpair | Pathway | Tissue | Disease Stage |
| Page: 1 |
Top |
Single-cell gene regulatory network inference analysis |
| Find out the significant the regulons (TFs) and the target genes of each regulon across cell types for different disease states |
| TF | Cell Type | Tissue | Disease Stage | Target Gene | RSS | Regulon Activity |
| RAB14 | END | Colorectum | ADJ | MACROD1,COPS7B,ZNF354C, etc. | 2.94e-01 |  |
| RAB14 | END | Colorectum | CRC | MACROD1,COPS7B,ZNF354C, etc. | 3.44e-01 |  |
| RAB14 | END | Colorectum | Healthy | MACROD1,COPS7B,ZNF354C, etc. | 2.49e-01 |  |
| RAB14 | ISLET | Pancreas | Healthy | TEN1,SUMF1,PKP3, etc. | 1.36e-02 |  |
| RAB14 | DUCT2 | Pancreas | Healthy | TEN1,SUMF1,PKP3, etc. | 5.26e-03 | |
| ∗The dot plots of a searched regulon are shown for all cell subpopulations in each disease state of each tissue based on the regulon specific score inferred using pySCENIC and by calculating the average expression. |
| Page: 1 |
Top |
Somatic mutation of malignant transformation related genes |
| Annotation of somatic variants for genes involved in malignant transformation |
| Hugo Symbol | Variant Class | Variant Classification | dbSNP RS | HGVSc | HGVSp | HGVSp Short | SWISSPROT | BIOTYPE | SIFT | PolyPhen | Tumor Sample Barcode | Tissue | Histology | Sex | Age | Stage | Therapy Types | Drugs | Outcome |
| RAB14 | SNV | Missense_Mutation | c.160N>A | p.Glu54Lys | p.E54K | P61106 | protein_coding | tolerated(0.29) | possibly_damaging(0.643) | TCGA-AN-A046-01 | Breast | breast invasive carcinoma | Female | >=65 | I/II | Unknown | Unknown | SD | |
| RAB14 | SNV | Missense_Mutation | c.499G>C | p.Glu167Gln | p.E167Q | P61106 | protein_coding | tolerated(0.53) | possibly_damaging(0.51) | TCGA-D8-A27F-01 | Breast | breast invasive carcinoma | Female | <65 | I/II | Chemotherapy | adriamycin+cyclophosphamide | SD | |
| RAB14 | SNV | Missense_Mutation | c.160N>A | p.Glu54Lys | p.E54K | P61106 | protein_coding | tolerated(0.29) | possibly_damaging(0.643) | TCGA-CA-6718-01 | Colorectum | colon adenocarcinoma | Male | <65 | I/II | Unknown | Unknown | PD | |
| RAB14 | SNV | Missense_Mutation | c.510N>C | p.Lys170Asn | p.K170N | P61106 | protein_coding | deleterious(0.04) | benign(0.04) | TCGA-AG-A036-01 | Colorectum | rectum adenocarcinoma | Male | >=65 | III/IV | Chemotherapy | 5-fluorouracil | CR | |
| RAB14 | SNV | Missense_Mutation | novel | c.410N>G | p.Glu137Gly | p.E137G | P61106 | protein_coding | tolerated(0.07) | possibly_damaging(0.849) | TCGA-A5-A0G2-01 | Endometrium | uterine corpus endometrioid carcinoma | Female | <65 | III/IV | Unknown | Unknown | SD |
| RAB14 | SNV | Missense_Mutation | c.130N>C | p.Ile44Leu | p.I44L | P61106 | protein_coding | deleterious(0.02) | benign(0.082) | TCGA-AP-A0LM-01 | Endometrium | uterine corpus endometrioid carcinoma | Female | <65 | III/IV | Chemotherapy | cisplatin | SD | |
| RAB14 | SNV | Missense_Mutation | novel | c.38A>C | p.Lys13Thr | p.K13T | P61106 | protein_coding | deleterious(0) | probably_damaging(1) | TCGA-AX-A05Z-01 | Endometrium | uterine corpus endometrioid carcinoma | Female | <65 | III/IV | Chemotherapy | adriamycin | SD |
| RAB14 | SNV | Missense_Mutation | novel | c.503N>T | p.Ala168Val | p.A168V | P61106 | protein_coding | tolerated(0.07) | benign(0.121) | TCGA-AX-A1CE-01 | Endometrium | uterine corpus endometrioid carcinoma | Female | <65 | I/II | Unspecific | Paclitaxel | SD |
| RAB14 | SNV | Missense_Mutation | novel | c.23N>G | p.Tyr8Cys | p.Y8C | P61106 | protein_coding | deleterious(0) | probably_damaging(0.954) | TCGA-AX-A1CE-01 | Endometrium | uterine corpus endometrioid carcinoma | Female | <65 | I/II | Unspecific | Paclitaxel | SD |
| RAB14 | SNV | Missense_Mutation | novel | c.329N>T | p.Arg110Met | p.R110M | P61106 | protein_coding | deleterious(0) | probably_damaging(0.933) | TCGA-AX-A2HC-01 | Endometrium | uterine corpus endometrioid carcinoma | Female | <65 | III/IV | Chemotherapy | paclitaxel | PD |
| Page: 1 2 3 |
Top |
Related drugs of malignant transformation related genes |
| Identification of chemicals and drugs interact with genes involved in malignant transfromation |
| (DGIdb 4.0) |
| Entrez ID | Symbol | Category | Interaction Types | Drug Claim Name | Drug Name | PMIDs |
| Page: 1 |

Copyright 2023-Present -The University of Texas Health Science Center at Houston |