
|
|||||
|
 | |
| |
| |
| |
| |
| |
|
Gene: RAB13 |
Gene summary for RAB13 |
| Gene information | Species | Human | Gene symbol | RAB13 | Gene ID | 5872 |
| Gene name | RAB13, member RAS oncogene family | |
| Gene Alias | GIG4 | |
| Cytomap | 1q21.3 | |
| Gene Type | protein-coding | GO ID | GO:0000003 | UniProtAcc | A0A087WWB9 |
Top |
Malignant transformation analysis |
| Identification of the aberrant gene expression in precancerous and cancerous lesions by comparing the gene expression of stem-like cells in diseased tissues with normal stem cells |
| Entrez ID | Symbol | Replicates | Species | Organ | Tissue | Adj P-value | Log2FC | Malignancy |
| 5872 | RAB13 | HTA11_2487_2000001011 | Human | Colorectum | SER | 3.85e-05 | 2.83e-01 | -0.1808 |
| 5872 | RAB13 | HTA11_2951_2000001011 | Human | Colorectum | AD | 1.46e-02 | 2.67e-01 | 0.0216 |
| 5872 | RAB13 | HTA11_1938_2000001011 | Human | Colorectum | AD | 3.68e-03 | 2.24e-01 | -0.0811 |
| 5872 | RAB13 | HTA11_78_2000001011 | Human | Colorectum | AD | 9.31e-03 | 2.00e-01 | -0.1088 |
| 5872 | RAB13 | HTA11_347_2000001011 | Human | Colorectum | AD | 2.52e-17 | 4.08e-01 | -0.1954 |
| 5872 | RAB13 | HTA11_411_2000001011 | Human | Colorectum | SER | 6.09e-03 | 4.64e-01 | -0.2602 |
| 5872 | RAB13 | HTA11_2112_2000001011 | Human | Colorectum | SER | 5.46e-04 | 4.39e-01 | -0.2196 |
| 5872 | RAB13 | HTA11_3361_2000001011 | Human | Colorectum | AD | 1.32e-03 | 2.57e-01 | -0.1207 |
| 5872 | RAB13 | HTA11_83_2000001011 | Human | Colorectum | SER | 1.52e-04 | 2.68e-01 | -0.1526 |
| 5872 | RAB13 | HTA11_696_2000001011 | Human | Colorectum | AD | 2.45e-18 | 3.87e-01 | -0.1464 |
| 5872 | RAB13 | HTA11_866_2000001011 | Human | Colorectum | AD | 9.28e-07 | 2.37e-01 | -0.1001 |
| 5872 | RAB13 | HTA11_1391_2000001011 | Human | Colorectum | AD | 2.93e-08 | 4.06e-01 | -0.059 |
| 5872 | RAB13 | HTA11_546_2000001011 | Human | Colorectum | AD | 1.46e-04 | 3.47e-01 | -0.0842 |
| 5872 | RAB13 | HTA11_866_3004761011 | Human | Colorectum | AD | 9.71e-13 | 3.83e-01 | 0.096 |
| 5872 | RAB13 | HTA11_8622_2000001021 | Human | Colorectum | SER | 5.33e-05 | 3.61e-01 | 0.0528 |
| 5872 | RAB13 | HTA11_10623_2000001011 | Human | Colorectum | AD | 1.08e-08 | 3.62e-01 | -0.0177 |
| 5872 | RAB13 | HTA11_6801_2000001011 | Human | Colorectum | SER | 1.46e-03 | 4.55e-01 | 0.0171 |
| 5872 | RAB13 | HTA11_10711_2000001011 | Human | Colorectum | AD | 1.42e-07 | 3.95e-01 | 0.0338 |
| 5872 | RAB13 | HTA11_7696_3000711011 | Human | Colorectum | AD | 5.03e-08 | 3.48e-01 | 0.0674 |
| 5872 | RAB13 | HTA11_6818_2000001011 | Human | Colorectum | AD | 4.14e-06 | 3.84e-01 | 0.0112 |
| Page: 1 2 3 4 5 6 7 8 9 10 |
| Tissue | Expression Dynamics | Abbreviation |
| Colorectum (GSE201348) |  | FAP: Familial adenomatous polyposis |
| CRC: Colorectal cancer | ||
| Colorectum (HTA11) |  | AD: Adenomas |
| SER: Sessile serrated lesions | ||
| MSI-H: Microsatellite-high colorectal cancer | ||
| MSS: Microsatellite stable colorectal cancer | ||
| Endometrium | 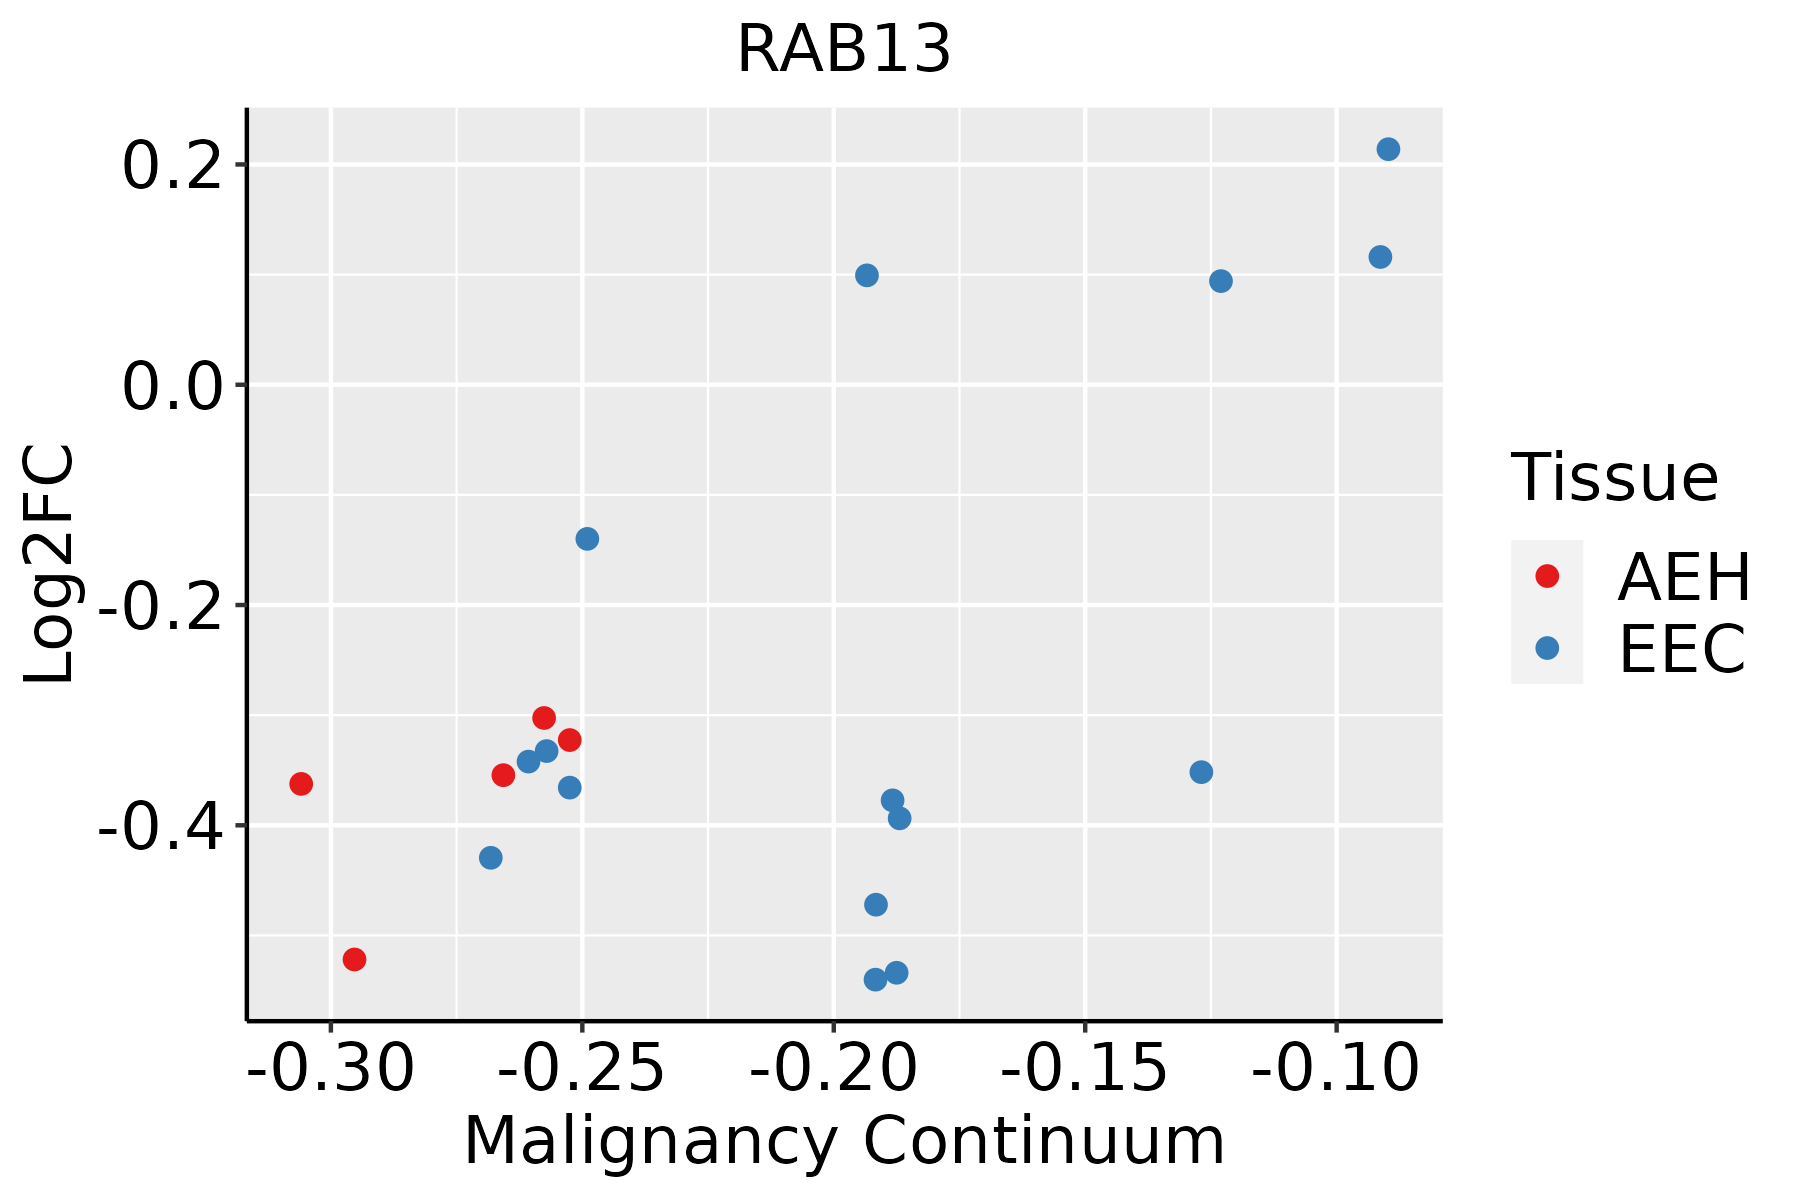 | AEH: Atypical endometrial hyperplasia |
| EEC: Endometrioid Cancer | ||
| Esophagus |  | ESCC: Esophageal squamous cell carcinoma |
| HGIN: High-grade intraepithelial neoplasias | ||
| LGIN: Low-grade intraepithelial neoplasias | ||
| Liver |  | HCC: Hepatocellular carcinoma |
| NAFLD: Non-alcoholic fatty liver disease | ||
| Oral Cavity |  | EOLP: Erosive Oral lichen planus |
| LP: leukoplakia | ||
| NEOLP: Non-erosive oral lichen planus | ||
| OSCC: Oral squamous cell carcinoma | ||
| Prostate | 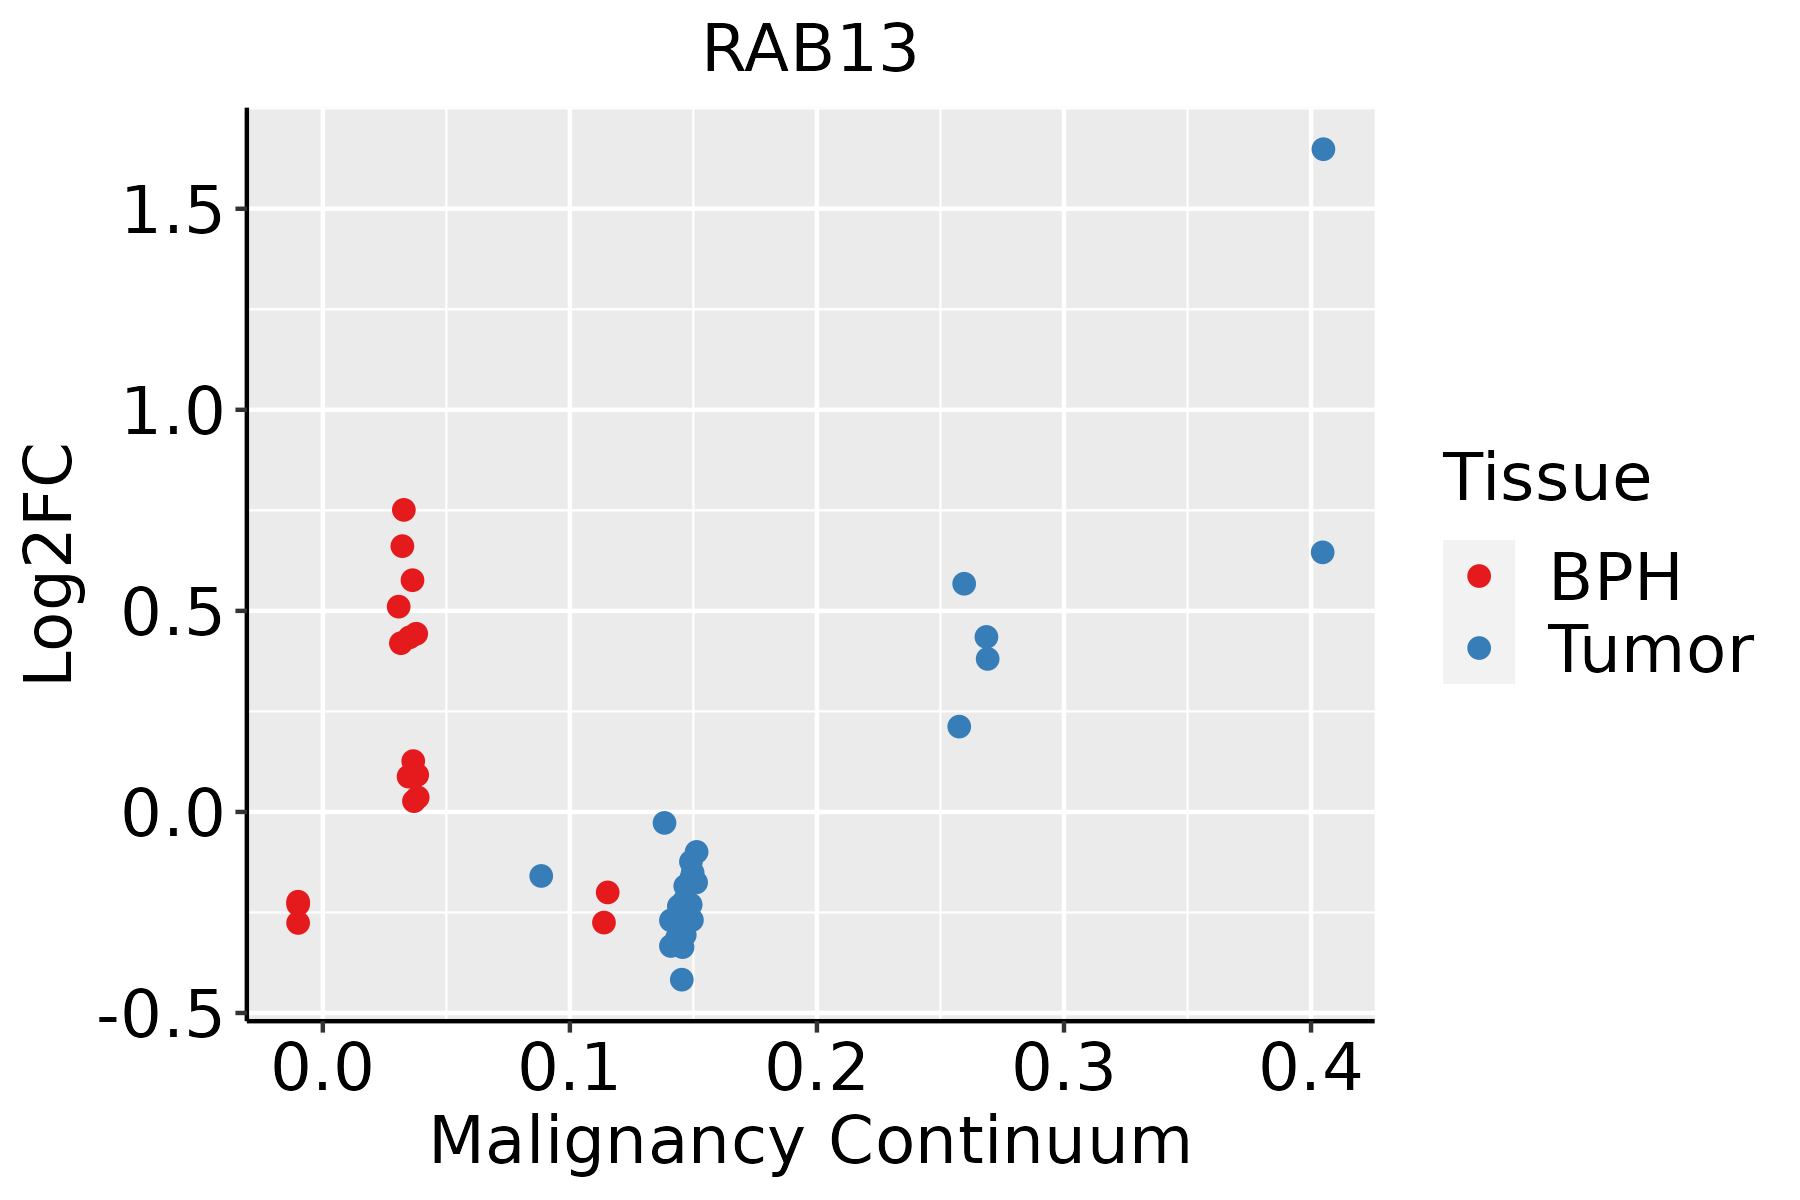 | BPH: Benign Prostatic Hyperplasia |
| Skin | 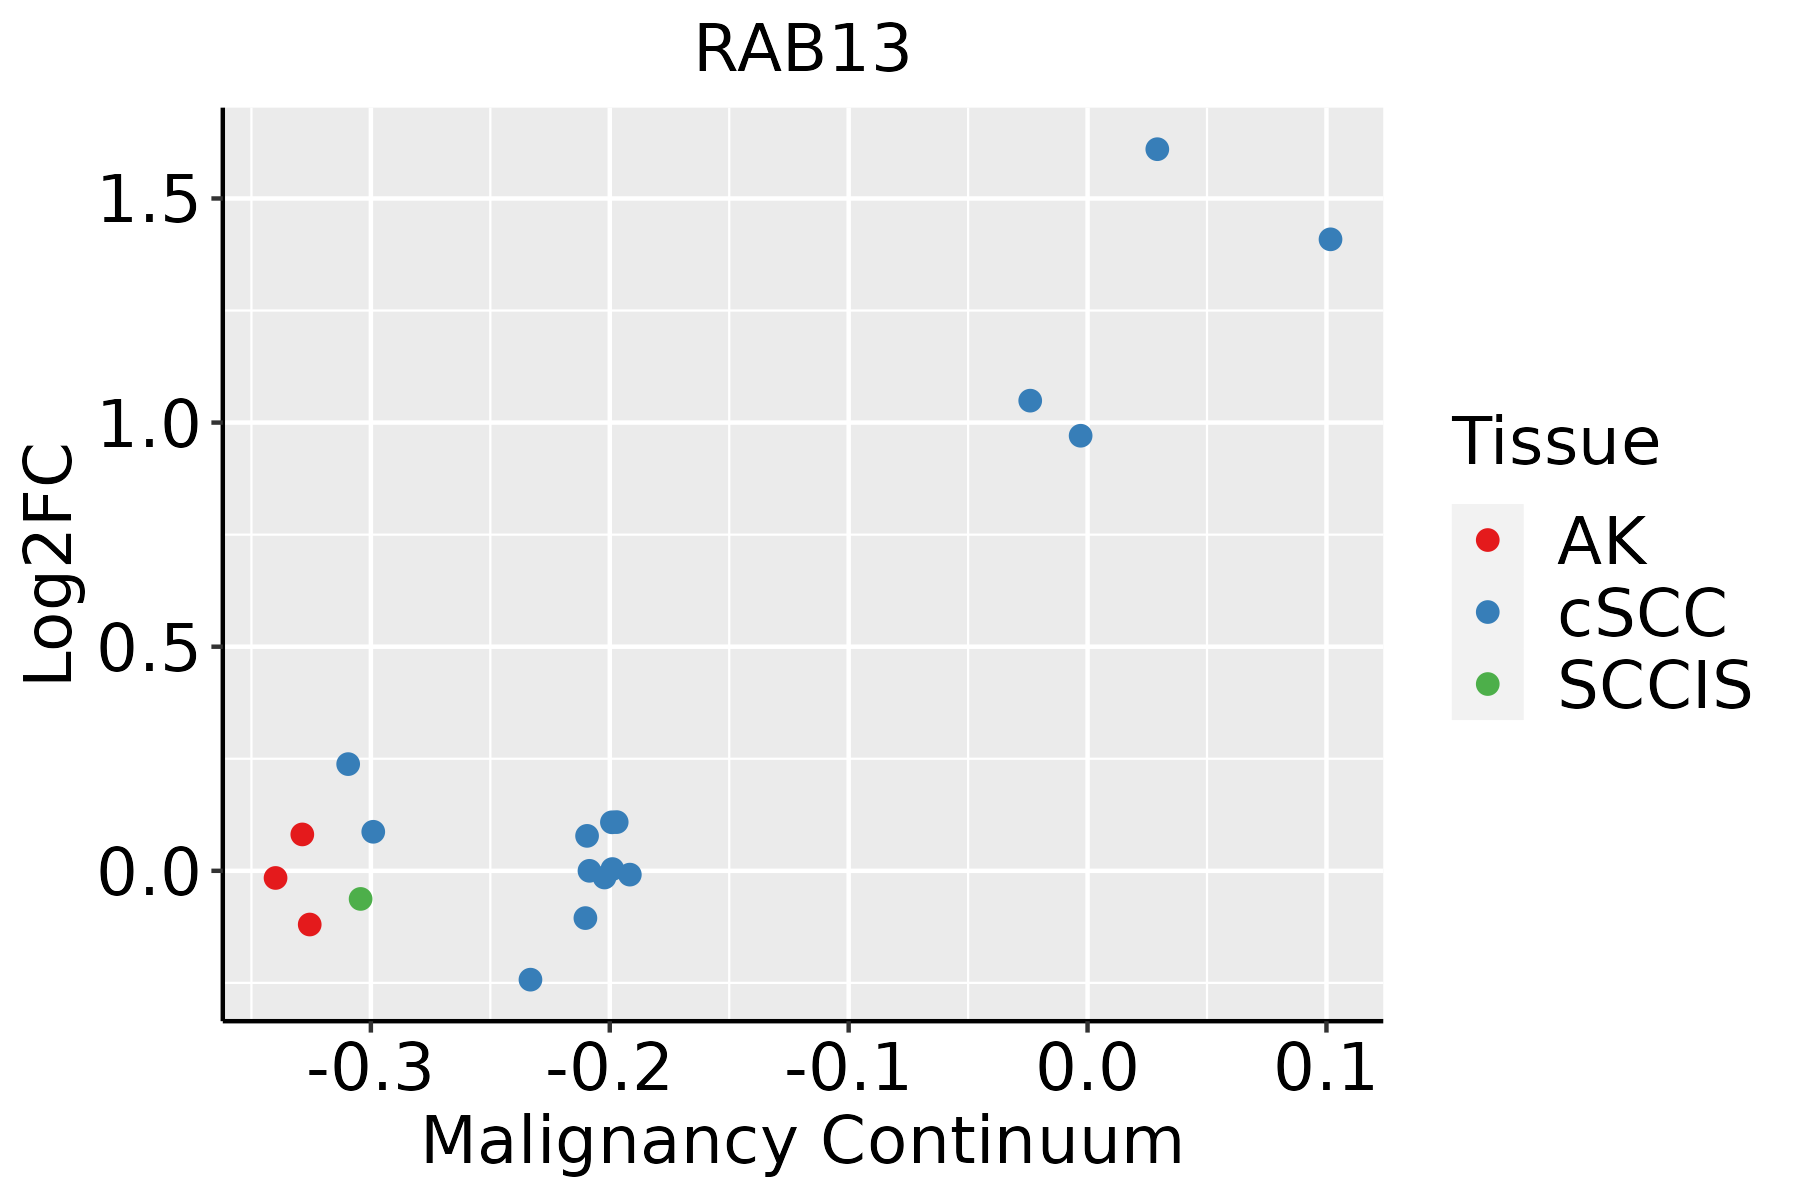 | AK: Actinic keratosis |
| cSCC: Cutaneous squamous cell carcinoma | ||
| SCCIS:squamous cell carcinoma in situ | ||
| Thyroid |  | ATC: Anaplastic thyroid cancer |
| HT: Hashimoto's thyroiditis | ||
| PTC: Papillary thyroid cancer |
| ∗log2FC in expression of this searched gene in stem-like cells from each diseased tissue sample relative to stem-like cells in normal samples in each tissue plotted against the malignancy continuum. Samples are colored based on if they are from different disease stage. |
Top |
Malignant transformation related pathway analysis |
| Find out the enriched GO biological processes and KEGG pathways involved in transition from healthy to precancer to cancer |
| Tissue | Disease Stage | Enriched GO biological Processes |
| Colorectum | AD |  |
| Colorectum | SER |  |
| Colorectum | MSS |  |
| Colorectum | MSI-H |  |
| Colorectum | FAP |  |
| ∗Top 15 enriched GO BP terms are showed in the bar plot of each disease state in each tissue. Each row represents a significant GO biological process which is colored according to the -log10(p.adjust). |
| Page: 1 2 3 4 5 6 7 8 9 |
| GO ID | Tissue | Disease Stage | Description | Gene Ratio | Bg Ratio | pvalue | p.adjust | Count |
| GO:0072659 | Colorectum | AD | protein localization to plasma membrane | 122/3918 | 284/18723 | 2.86e-17 | 1.49e-14 | 122 |
| GO:1990778 | Colorectum | AD | protein localization to cell periphery | 129/3918 | 333/18723 | 5.51e-14 | 1.15e-11 | 129 |
| GO:0002064 | Colorectum | AD | epithelial cell development | 89/3918 | 220/18723 | 2.98e-11 | 3.52e-09 | 89 |
| GO:0048193 | Colorectum | AD | Golgi vesicle transport | 109/3918 | 296/18723 | 1.80e-10 | 1.68e-08 | 109 |
| GO:0016197 | Colorectum | AD | endosomal transport | 90/3918 | 230/18723 | 1.88e-10 | 1.73e-08 | 90 |
| GO:0045216 | Colorectum | AD | cell-cell junction organization | 80/3918 | 200/18723 | 5.57e-10 | 4.58e-08 | 80 |
| GO:0034329 | Colorectum | AD | cell junction assembly | 136/3918 | 420/18723 | 2.02e-08 | 1.15e-06 | 136 |
| GO:0098876 | Colorectum | AD | vesicle-mediated transport to the plasma membrane | 57/3918 | 136/18723 | 2.30e-08 | 1.27e-06 | 57 |
| GO:0016050 | Colorectum | AD | vesicle organization | 101/3918 | 300/18723 | 1.65e-07 | 7.17e-06 | 101 |
| GO:0032868 | Colorectum | AD | response to insulin | 91/3918 | 264/18723 | 2.02e-07 | 8.48e-06 | 91 |
| GO:0007043 | Colorectum | AD | cell-cell junction assembly | 57/3918 | 146/18723 | 4.18e-07 | 1.61e-05 | 57 |
| GO:1901653 | Colorectum | AD | cellular response to peptide | 114/3918 | 359/18723 | 8.32e-07 | 2.88e-05 | 114 |
| GO:0032869 | Colorectum | AD | cellular response to insulin stimulus | 72/3918 | 203/18723 | 1.10e-06 | 3.68e-05 | 72 |
| GO:0071375 | Colorectum | AD | cellular response to peptide hormone stimulus | 95/3918 | 290/18723 | 1.50e-06 | 4.66e-05 | 95 |
| GO:0043434 | Colorectum | AD | response to peptide hormone | 126/3918 | 414/18723 | 2.70e-06 | 7.86e-05 | 126 |
| GO:0043297 | Colorectum | AD | apical junction assembly | 34/3918 | 78/18723 | 5.31e-06 | 1.37e-04 | 34 |
| GO:0001667 | Colorectum | AD | ameboidal-type cell migration | 137/3918 | 475/18723 | 2.17e-05 | 4.33e-04 | 137 |
| GO:0120193 | Colorectum | AD | tight junction organization | 33/3918 | 80/18723 | 2.93e-05 | 5.42e-04 | 33 |
| GO:0120192 | Colorectum | AD | tight junction assembly | 31/3918 | 74/18723 | 3.53e-05 | 6.43e-04 | 31 |
| GO:0009306 | Colorectum | AD | protein secretion | 105/3918 | 359/18723 | 1.05e-04 | 1.57e-03 | 105 |
| Page: 1 2 3 4 5 6 7 8 9 10 11 12 13 14 15 16 17 18 19 20 21 22 23 24 25 26 27 28 29 |
| Pathway ID | Tissue | Disease Stage | Description | Gene Ratio | Bg Ratio | pvalue | p.adjust | qvalue | Count |
| hsa04530 | Colorectum | AD | Tight junction | 76/2092 | 169/8465 | 5.49e-09 | 9.69e-08 | 6.18e-08 | 76 |
| hsa045301 | Colorectum | AD | Tight junction | 76/2092 | 169/8465 | 5.49e-09 | 9.69e-08 | 6.18e-08 | 76 |
| hsa045302 | Colorectum | SER | Tight junction | 59/1580 | 169/8465 | 3.24e-07 | 5.98e-06 | 4.34e-06 | 59 |
| hsa045303 | Colorectum | SER | Tight junction | 59/1580 | 169/8465 | 3.24e-07 | 5.98e-06 | 4.34e-06 | 59 |
| hsa045304 | Colorectum | MSS | Tight junction | 66/1875 | 169/8465 | 4.10e-07 | 6.25e-06 | 3.83e-06 | 66 |
| hsa045305 | Colorectum | MSS | Tight junction | 66/1875 | 169/8465 | 4.10e-07 | 6.25e-06 | 3.83e-06 | 66 |
| hsa0453026 | Endometrium | AEH | Tight junction | 54/1197 | 169/8465 | 1.99e-09 | 3.80e-08 | 2.78e-08 | 54 |
| hsa04530112 | Endometrium | AEH | Tight junction | 54/1197 | 169/8465 | 1.99e-09 | 3.80e-08 | 2.78e-08 | 54 |
| hsa0453027 | Endometrium | EEC | Tight junction | 54/1237 | 169/8465 | 6.56e-09 | 1.27e-07 | 9.46e-08 | 54 |
| hsa0453036 | Endometrium | EEC | Tight junction | 54/1237 | 169/8465 | 6.56e-09 | 1.27e-07 | 9.46e-08 | 54 |
| hsa04530211 | Esophagus | ESCC | Tight junction | 105/4205 | 169/8465 | 6.73e-04 | 2.23e-03 | 1.14e-03 | 105 |
| hsa04530310 | Esophagus | ESCC | Tight junction | 105/4205 | 169/8465 | 6.73e-04 | 2.23e-03 | 1.14e-03 | 105 |
| hsa0453022 | Liver | Cirrhotic | Tight junction | 82/2530 | 169/8465 | 2.14e-07 | 2.85e-06 | 1.76e-06 | 82 |
| hsa0453032 | Liver | Cirrhotic | Tight junction | 82/2530 | 169/8465 | 2.14e-07 | 2.85e-06 | 1.76e-06 | 82 |
| hsa0453042 | Liver | HCC | Tight junction | 110/4020 | 169/8465 | 2.45e-06 | 2.28e-05 | 1.27e-05 | 110 |
| hsa0453052 | Liver | HCC | Tight junction | 110/4020 | 169/8465 | 2.45e-06 | 2.28e-05 | 1.27e-05 | 110 |
| hsa0453030 | Oral cavity | OSCC | Tight junction | 102/3704 | 169/8465 | 8.68e-06 | 3.93e-05 | 2.00e-05 | 102 |
| hsa04530114 | Oral cavity | OSCC | Tight junction | 102/3704 | 169/8465 | 8.68e-06 | 3.93e-05 | 2.00e-05 | 102 |
| hsa0453045 | Oral cavity | NEOLP | Tight junction | 39/1112 | 169/8465 | 2.50e-04 | 1.62e-03 | 1.02e-03 | 39 |
| hsa0453055 | Oral cavity | NEOLP | Tight junction | 39/1112 | 169/8465 | 2.50e-04 | 1.62e-03 | 1.02e-03 | 39 |
| Page: 1 2 |
Top |
Cell-cell communication analysis |
| Identification of potential cell-cell interactions between two cell types and their ligand-receptor pairs for different disease states |
| Ligand | Receptor | LRpair | Pathway | Tissue | Disease Stage |
| Page: 1 |
Top |
Single-cell gene regulatory network inference analysis |
| Find out the significant the regulons (TFs) and the target genes of each regulon across cell types for different disease states |
| TF | Cell Type | Tissue | Disease Stage | Target Gene | RSS | Regulon Activity |
| ∗The dot plots of a searched regulon are shown for all cell subpopulations in each disease state of each tissue based on the regulon specific score inferred using pySCENIC and by calculating the average expression. |
| Page: 1 |
Top |
Somatic mutation of malignant transformation related genes |
| Annotation of somatic variants for genes involved in malignant transformation |
| Hugo Symbol | Variant Class | Variant Classification | dbSNP RS | HGVSc | HGVSp | HGVSp Short | SWISSPROT | BIOTYPE | SIFT | PolyPhen | Tumor Sample Barcode | Tissue | Histology | Sex | Age | Stage | Therapy Types | Drugs | Outcome |
| RAB13 | SNV | Missense_Mutation | rs763159582 | c.332C>T | p.Ser111Leu | p.S111L | P51153 | protein_coding | deleterious(0.01) | benign(0.012) | TCGA-AC-A23H-01 | Breast | breast invasive carcinoma | Female | >=65 | I/II | Unknown | Unknown | PD |
| RAB13 | SNV | Missense_Mutation | novel | c.400N>C | p.Glu134Gln | p.E134Q | P51153 | protein_coding | tolerated(0.09) | probably_damaging(0.987) | TCGA-AC-A3TN-01 | Breast | breast invasive carcinoma | Female | >=65 | I/II | Hormone Therapy | arimidex | SD |
| RAB13 | SNV | Missense_Mutation | rs202131118 | c.499N>T | p.Arg167Trp | p.R167W | P51153 | protein_coding | deleterious(0) | benign(0.003) | TCGA-AR-A1AK-01 | Breast | breast invasive carcinoma | Female | >=65 | I/II | Hormone Therapy | anastrozole | SD |
| RAB13 | SNV | Missense_Mutation | novel | c.229N>C | p.Tyr77His | p.Y77H | P51153 | protein_coding | deleterious(0) | probably_damaging(0.999) | TCGA-D8-A1XK-01 | Breast | breast invasive carcinoma | Female | <65 | I/II | Chemotherapy | doxorubicine+cyclophosphamide | SD |
| RAB13 | SNV | Missense_Mutation | c.165N>C | p.Lys55Asn | p.K55N | P51153 | protein_coding | deleterious(0) | probably_damaging(0.996) | TCGA-C5-A1BQ-01 | Cervix | cervical & endocervical cancer | Female | >=65 | III/IV | Chemotherapy | cisplatin | CR | |
| RAB13 | insertion | Frame_Shift_Ins | novel | c.55_56insG | p.Val19GlyfsTer26 | p.V19Gfs*26 | P51153 | protein_coding | TCGA-D5-6530-01 | Colorectum | colon adenocarcinoma | Male | <65 | I/II | Unknown | Unknown | SD | ||
| RAB13 | SNV | Missense_Mutation | c.448A>C | p.Thr150Pro | p.T150P | P51153 | protein_coding | deleterious(0) | probably_damaging(0.973) | TCGA-AP-A056-01 | Endometrium | uterine corpus endometrioid carcinoma | Female | <65 | I/II | Unknown | Unknown | SD | |
| RAB13 | SNV | Missense_Mutation | novel | c.241N>A | p.Ala81Thr | p.A81T | P51153 | protein_coding | deleterious(0) | probably_damaging(0.997) | TCGA-AX-A06F-01 | Endometrium | uterine corpus endometrioid carcinoma | Female | <65 | III/IV | Chemotherapy | carboplatin | SD |
| RAB13 | SNV | Missense_Mutation | rs145912655 | c.437G>A | p.Arg146Gln | p.R146Q | P51153 | protein_coding | tolerated(0.19) | benign(0.44) | TCGA-AX-A3FT-01 | Endometrium | uterine corpus endometrioid carcinoma | Female | <65 | I/II | Unknown | Unknown | SD |
| RAB13 | SNV | Missense_Mutation | c.445N>A | p.Glu149Lys | p.E149K | P51153 | protein_coding | deleterious(0) | probably_damaging(0.997) | TCGA-B5-A1MR-01 | Endometrium | uterine corpus endometrioid carcinoma | Female | >=65 | III/IV | Unknown | Unknown | SD |
| Page: 1 2 |
Top |
Related drugs of malignant transformation related genes |
| Identification of chemicals and drugs interact with genes involved in malignant transfromation |
| (DGIdb 4.0) |
| Entrez ID | Symbol | Category | Interaction Types | Drug Claim Name | Drug Name | PMIDs |
| Page: 1 |

Copyright 2023-Present -The University of Texas Health Science Center at Houston |