
|
|||||
|
 | |
| |
| |
| |
| |
| |
|
Gene: RAB11FIP4 |
Gene summary for RAB11FIP4 |
| Gene information | Species | Human | Gene symbol | RAB11FIP4 | Gene ID | 84440 |
| Gene name | RAB11 family interacting protein 4 | |
| Gene Alias | FIP4-Rab11 | |
| Cytomap | 17q11.2 | |
| Gene Type | protein-coding | GO ID | GO:0000910 | UniProtAcc | Q86YS3 |
Top |
Malignant transformation analysis |
| Identification of the aberrant gene expression in precancerous and cancerous lesions by comparing the gene expression of stem-like cells in diseased tissues with normal stem cells |
| Entrez ID | Symbol | Replicates | Species | Organ | Tissue | Adj P-value | Log2FC | Malignancy |
| 84440 | RAB11FIP4 | HCC1_Meng | Human | Liver | HCC | 2.31e-13 | -3.70e-02 | 0.0246 |
| 84440 | RAB11FIP4 | HCC2_Meng | Human | Liver | HCC | 5.91e-16 | 5.05e-02 | 0.0107 |
| 84440 | RAB11FIP4 | HCC1 | Human | Liver | HCC | 5.85e-10 | 2.38e+00 | 0.5336 |
| 84440 | RAB11FIP4 | HCC2 | Human | Liver | HCC | 1.89e-23 | 3.32e+00 | 0.5341 |
| 84440 | RAB11FIP4 | HCC5 | Human | Liver | HCC | 1.89e-03 | 9.99e-01 | 0.4932 |
| 84440 | RAB11FIP4 | S027 | Human | Liver | HCC | 1.35e-02 | 3.96e-01 | 0.2446 |
| 84440 | RAB11FIP4 | S028 | Human | Liver | HCC | 1.10e-11 | 4.79e-01 | 0.2503 |
| 84440 | RAB11FIP4 | S029 | Human | Liver | HCC | 4.44e-11 | 4.80e-01 | 0.2581 |
| 84440 | RAB11FIP4 | C21 | Human | Oral cavity | OSCC | 6.29e-11 | 2.67e-01 | 0.2678 |
| 84440 | RAB11FIP4 | C30 | Human | Oral cavity | OSCC | 2.45e-18 | 6.48e-01 | 0.3055 |
| 84440 | RAB11FIP4 | C38 | Human | Oral cavity | OSCC | 3.39e-08 | 5.87e-01 | 0.172 |
| 84440 | RAB11FIP4 | C46 | Human | Oral cavity | OSCC | 4.62e-03 | 1.00e-01 | 0.1673 |
| 84440 | RAB11FIP4 | C08 | Human | Oral cavity | OSCC | 1.60e-05 | 1.88e-01 | 0.1919 |
| 84440 | RAB11FIP4 | LN22 | Human | Oral cavity | OSCC | 3.59e-07 | 5.30e-01 | 0.1733 |
| 84440 | RAB11FIP4 | SYSMH3 | Human | Oral cavity | OSCC | 4.22e-08 | 2.45e-01 | 0.2442 |
| Page: 1 |
| Tissue | Expression Dynamics | Abbreviation |
| Liver | 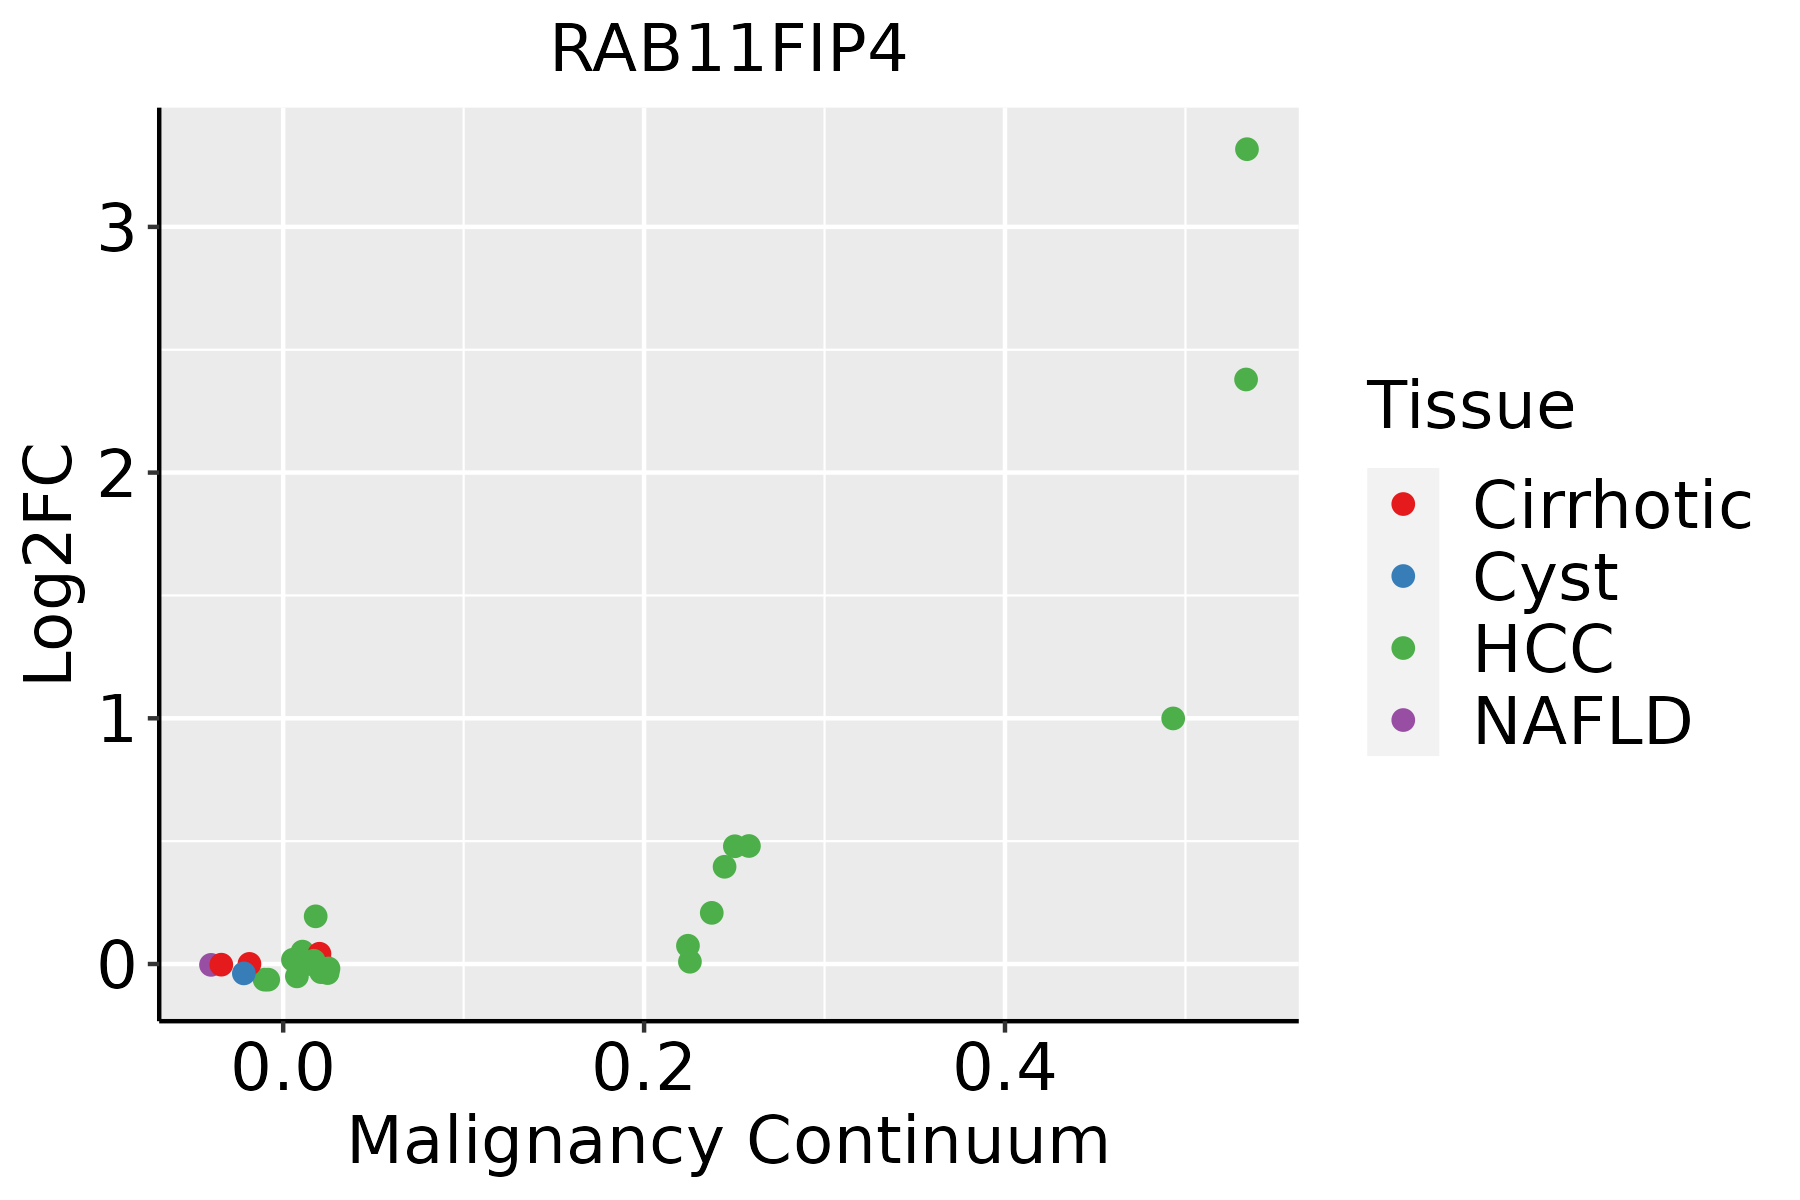 | HCC: Hepatocellular carcinoma |
| NAFLD: Non-alcoholic fatty liver disease | ||
| Oral Cavity |  | EOLP: Erosive Oral lichen planus |
| LP: leukoplakia | ||
| NEOLP: Non-erosive oral lichen planus | ||
| OSCC: Oral squamous cell carcinoma |
| ∗log2FC in expression of this searched gene in stem-like cells from each diseased tissue sample relative to stem-like cells in normal samples in each tissue plotted against the malignancy continuum. Samples are colored based on if they are from different disease stage. |
Top |
Malignant transformation related pathway analysis |
| Find out the enriched GO biological processes and KEGG pathways involved in transition from healthy to precancer to cancer |
| Tissue | Disease Stage | Enriched GO biological Processes |
| Colorectum | AD |  |
| Colorectum | SER |  |
| Colorectum | MSS |  |
| Colorectum | MSI-H |  |
| Colorectum | FAP |  |
| ∗Top 15 enriched GO BP terms are showed in the bar plot of each disease state in each tissue. Each row represents a significant GO biological process which is colored according to the -log10(p.adjust). |
| Page: 1 2 3 4 5 6 7 8 9 |
| GO ID | Tissue | Disease Stage | Description | Gene Ratio | Bg Ratio | pvalue | p.adjust | Count |
| GO:001619721 | Liver | HCC | endosomal transport | 154/7958 | 230/18723 | 4.74e-14 | 2.95e-12 | 154 |
| GO:009887621 | Liver | HCC | vesicle-mediated transport to the plasma membrane | 92/7958 | 136/18723 | 2.57e-09 | 7.07e-08 | 92 |
| GO:000091011 | Liver | HCC | cytokinesis | 100/7958 | 173/18723 | 3.38e-05 | 3.39e-04 | 100 |
| GO:00324562 | Liver | HCC | endocytic recycling | 48/7958 | 73/18723 | 5.07e-05 | 4.83e-04 | 48 |
| GO:00161979 | Oral cavity | OSCC | endosomal transport | 141/7305 | 230/18723 | 5.40e-12 | 2.06e-10 | 141 |
| GO:000091010 | Oral cavity | OSCC | cytokinesis | 97/7305 | 173/18723 | 3.82e-06 | 4.51e-05 | 97 |
| GO:00988769 | Oral cavity | OSCC | vesicle-mediated transport to the plasma membrane | 79/7305 | 136/18723 | 4.93e-06 | 5.58e-05 | 79 |
| GO:00513024 | Oral cavity | OSCC | regulation of cell division | 87/7305 | 177/18723 | 3.75e-03 | 1.55e-02 | 87 |
| GO:00324652 | Oral cavity | OSCC | regulation of cytokinesis | 49/7305 | 92/18723 | 3.81e-03 | 1.57e-02 | 49 |
| Page: 1 |
| Pathway ID | Tissue | Disease Stage | Description | Gene Ratio | Bg Ratio | pvalue | p.adjust | qvalue | Count |
| hsa0414422 | Liver | HCC | Endocytosis | 178/4020 | 251/8465 | 2.03e-14 | 5.22e-13 | 2.91e-13 | 178 |
| hsa0414432 | Liver | HCC | Endocytosis | 178/4020 | 251/8465 | 2.03e-14 | 5.22e-13 | 2.91e-13 | 178 |
| hsa0414427 | Oral cavity | OSCC | Endocytosis | 174/3704 | 251/8465 | 9.42e-17 | 4.51e-15 | 2.29e-15 | 174 |
| hsa04144112 | Oral cavity | OSCC | Endocytosis | 174/3704 | 251/8465 | 9.42e-17 | 4.51e-15 | 2.29e-15 | 174 |
| Page: 1 |
Top |
Cell-cell communication analysis |
| Identification of potential cell-cell interactions between two cell types and their ligand-receptor pairs for different disease states |
| Ligand | Receptor | LRpair | Pathway | Tissue | Disease Stage |
| Page: 1 |
Top |
Single-cell gene regulatory network inference analysis |
| Find out the significant the regulons (TFs) and the target genes of each regulon across cell types for different disease states |
| TF | Cell Type | Tissue | Disease Stage | Target Gene | RSS | Regulon Activity |
| ∗The dot plots of a searched regulon are shown for all cell subpopulations in each disease state of each tissue based on the regulon specific score inferred using pySCENIC and by calculating the average expression. |
| Page: 1 |
Top |
Somatic mutation of malignant transformation related genes |
| Annotation of somatic variants for genes involved in malignant transformation |
| Hugo Symbol | Variant Class | Variant Classification | dbSNP RS | HGVSc | HGVSp | HGVSp Short | SWISSPROT | BIOTYPE | SIFT | PolyPhen | Tumor Sample Barcode | Tissue | Histology | Sex | Age | Stage | Therapy Types | Drugs | Outcome |
| RAB11FIP4 | SNV | Missense_Mutation | c.367N>A | p.Asp123Asn | p.D123N | Q86YS3 | protein_coding | tolerated(0.23) | benign(0.058) | TCGA-AC-A23H-01 | Breast | breast invasive carcinoma | Female | >=65 | I/II | Unknown | Unknown | PD | |
| RAB11FIP4 | SNV | Missense_Mutation | c.1216N>A | p.Glu406Lys | p.E406K | Q86YS3 | protein_coding | deleterious(0) | benign(0.108) | TCGA-AC-A23H-01 | Breast | breast invasive carcinoma | Female | >=65 | I/II | Unknown | Unknown | PD | |
| RAB11FIP4 | SNV | Missense_Mutation | c.283N>C | p.Glu95Gln | p.E95Q | Q86YS3 | protein_coding | tolerated(0.57) | benign(0.001) | TCGA-D8-A1J9-01 | Breast | breast invasive carcinoma | Female | <65 | I/II | Unknown | Unknown | SD | |
| RAB11FIP4 | deletion | Frame_Shift_Del | novel | c.612delN | p.Ser205ProfsTer66 | p.S205Pfs*66 | Q86YS3 | protein_coding | TCGA-D8-A27V-01 | Breast | breast invasive carcinoma | Female | <65 | I/II | Hormone Therapy | tamoxiphen | SD | ||
| RAB11FIP4 | SNV | Missense_Mutation | novel | c.1613N>A | p.Arg538His | p.R538H | Q86YS3 | protein_coding | deleterious(0) | probably_damaging(0.992) | TCGA-2W-A8YY-01 | Cervix | cervical & endocervical cancer | Female | <65 | I/II | Chemotherapy | cisplatin | CR |
| RAB11FIP4 | SNV | Missense_Mutation | c.770N>T | p.Thr257Met | p.T257M | Q86YS3 | protein_coding | tolerated(0.05) | probably_damaging(0.974) | TCGA-EA-A3HS-01 | Cervix | cervical & endocervical cancer | Female | <65 | I/II | Unknown | Unknown | SD | |
| RAB11FIP4 | SNV | Missense_Mutation | c.703N>A | p.Asp235Asn | p.D235N | Q86YS3 | protein_coding | tolerated(0.11) | possibly_damaging(0.902) | TCGA-VS-A952-01 | Cervix | cervical & endocervical cancer | Female | >=65 | I/II | Unknown | Unknown | SD | |
| RAB11FIP4 | SNV | Missense_Mutation | rs199789204 | c.1082A>G | p.Asn361Ser | p.N361S | Q86YS3 | protein_coding | tolerated(0.32) | benign(0) | TCGA-A6-5656-01 | Colorectum | colon adenocarcinoma | Male | >=65 | I/II | Unknown | Unknown | SD |
| RAB11FIP4 | SNV | Missense_Mutation | novel | c.1027N>G | p.Lys343Glu | p.K343E | Q86YS3 | protein_coding | deleterious(0.01) | possibly_damaging(0.591) | TCGA-A6-6142-01 | Colorectum | colon adenocarcinoma | Female | <65 | I/II | Chemotherapy | fluorouracil | PD |
| RAB11FIP4 | SNV | Missense_Mutation | c.670N>A | p.Asp224Asn | p.D224N | Q86YS3 | protein_coding | tolerated(0.06) | probably_damaging(0.94) | TCGA-AA-3492-01 | Colorectum | colon adenocarcinoma | Female | >=65 | I/II | Unknown | Unknown | SD |
| Page: 1 2 3 4 5 6 7 |
Top |
Related drugs of malignant transformation related genes |
| Identification of chemicals and drugs interact with genes involved in malignant transfromation |
| (DGIdb 4.0) |
| Entrez ID | Symbol | Category | Interaction Types | Drug Claim Name | Drug Name | PMIDs |
| Page: 1 |

Copyright 2023-Present -The University of Texas Health Science Center at Houston |