
|
|||||
|
 | |
| |
| |
| |
| |
| |
|
Gene: RAB11FIP1 |
Gene summary for RAB11FIP1 |
| Gene information | Species | Human | Gene symbol | RAB11FIP1 | Gene ID | 80223 |
| Gene name | RAB11 family interacting protein 1 | |
| Gene Alias | NOEL1A | |
| Cytomap | 8p11.23 | |
| Gene Type | protein-coding | GO ID | GO:0003008 | UniProtAcc | Q6WKZ4 |
Top |
Malignant transformation analysis |
| Identification of the aberrant gene expression in precancerous and cancerous lesions by comparing the gene expression of stem-like cells in diseased tissues with normal stem cells |
| Entrez ID | Symbol | Replicates | Species | Organ | Tissue | Adj P-value | Log2FC | Malignancy |
| 80223 | RAB11FIP1 | GSM4909281 | Human | Breast | IDC | 1.73e-03 | -3.09e-01 | 0.21 |
| 80223 | RAB11FIP1 | GSM4909285 | Human | Breast | IDC | 3.90e-13 | -4.48e-01 | 0.21 |
| 80223 | RAB11FIP1 | GSM4909286 | Human | Breast | IDC | 1.32e-08 | -3.97e-01 | 0.1081 |
| 80223 | RAB11FIP1 | GSM4909290 | Human | Breast | IDC | 1.25e-05 | -4.23e-01 | 0.2096 |
| 80223 | RAB11FIP1 | GSM4909296 | Human | Breast | IDC | 2.21e-10 | -3.74e-01 | 0.1524 |
| 80223 | RAB11FIP1 | GSM4909297 | Human | Breast | IDC | 2.86e-38 | 7.16e-01 | 0.1517 |
| 80223 | RAB11FIP1 | GSM4909302 | Human | Breast | IDC | 7.14e-07 | 3.95e-01 | 0.1545 |
| 80223 | RAB11FIP1 | GSM4909307 | Human | Breast | IDC | 2.76e-03 | -3.18e-01 | 0.1569 |
| 80223 | RAB11FIP1 | GSM4909311 | Human | Breast | IDC | 2.37e-27 | -5.00e-01 | 0.1534 |
| 80223 | RAB11FIP1 | GSM4909312 | Human | Breast | IDC | 3.64e-22 | -4.65e-01 | 0.1552 |
| 80223 | RAB11FIP1 | GSM4909317 | Human | Breast | IDC | 2.30e-44 | 9.53e-01 | 0.1355 |
| 80223 | RAB11FIP1 | GSM4909318 | Human | Breast | IDC | 2.91e-18 | 9.34e-01 | 0.2031 |
| 80223 | RAB11FIP1 | GSM4909319 | Human | Breast | IDC | 1.00e-30 | -4.00e-01 | 0.1563 |
| 80223 | RAB11FIP1 | GSM4909320 | Human | Breast | IDC | 1.40e-02 | -3.78e-01 | 0.1575 |
| 80223 | RAB11FIP1 | GSM4909321 | Human | Breast | IDC | 2.20e-11 | -1.95e-01 | 0.1559 |
| 80223 | RAB11FIP1 | ctrl6 | Human | Breast | Precancer | 4.92e-04 | 4.39e-01 | -0.0061 |
| 80223 | RAB11FIP1 | brca1 | Human | Breast | Precancer | 5.26e-05 | -3.02e-01 | -0.0338 |
| 80223 | RAB11FIP1 | brca10 | Human | Breast | Precancer | 2.25e-03 | 3.19e-01 | -0.0029 |
| 80223 | RAB11FIP1 | NCCBC11 | Human | Breast | DCIS | 8.34e-05 | 4.24e-01 | 0.1232 |
| 80223 | RAB11FIP1 | NCCBC14 | Human | Breast | DCIS | 2.52e-06 | 3.21e-02 | 0.2021 |
| Page: 1 2 3 4 5 6 7 8 9 10 11 |
| Tissue | Expression Dynamics | Abbreviation |
| Breast |  | IDC: Invasive ductal carcinoma |
| DCIS: Ductal carcinoma in situ | ||
| Precancer(BRCA1-mut): Precancerous lesion from BRCA1 mutation carriers | ||
| Colorectum (GSE201348) |  | FAP: Familial adenomatous polyposis |
| CRC: Colorectal cancer | ||
| Colorectum (HTA11) |  | AD: Adenomas |
| SER: Sessile serrated lesions | ||
| MSI-H: Microsatellite-high colorectal cancer | ||
| MSS: Microsatellite stable colorectal cancer | ||
| Endometrium |  | AEH: Atypical endometrial hyperplasia |
| EEC: Endometrioid Cancer | ||
| Esophagus | 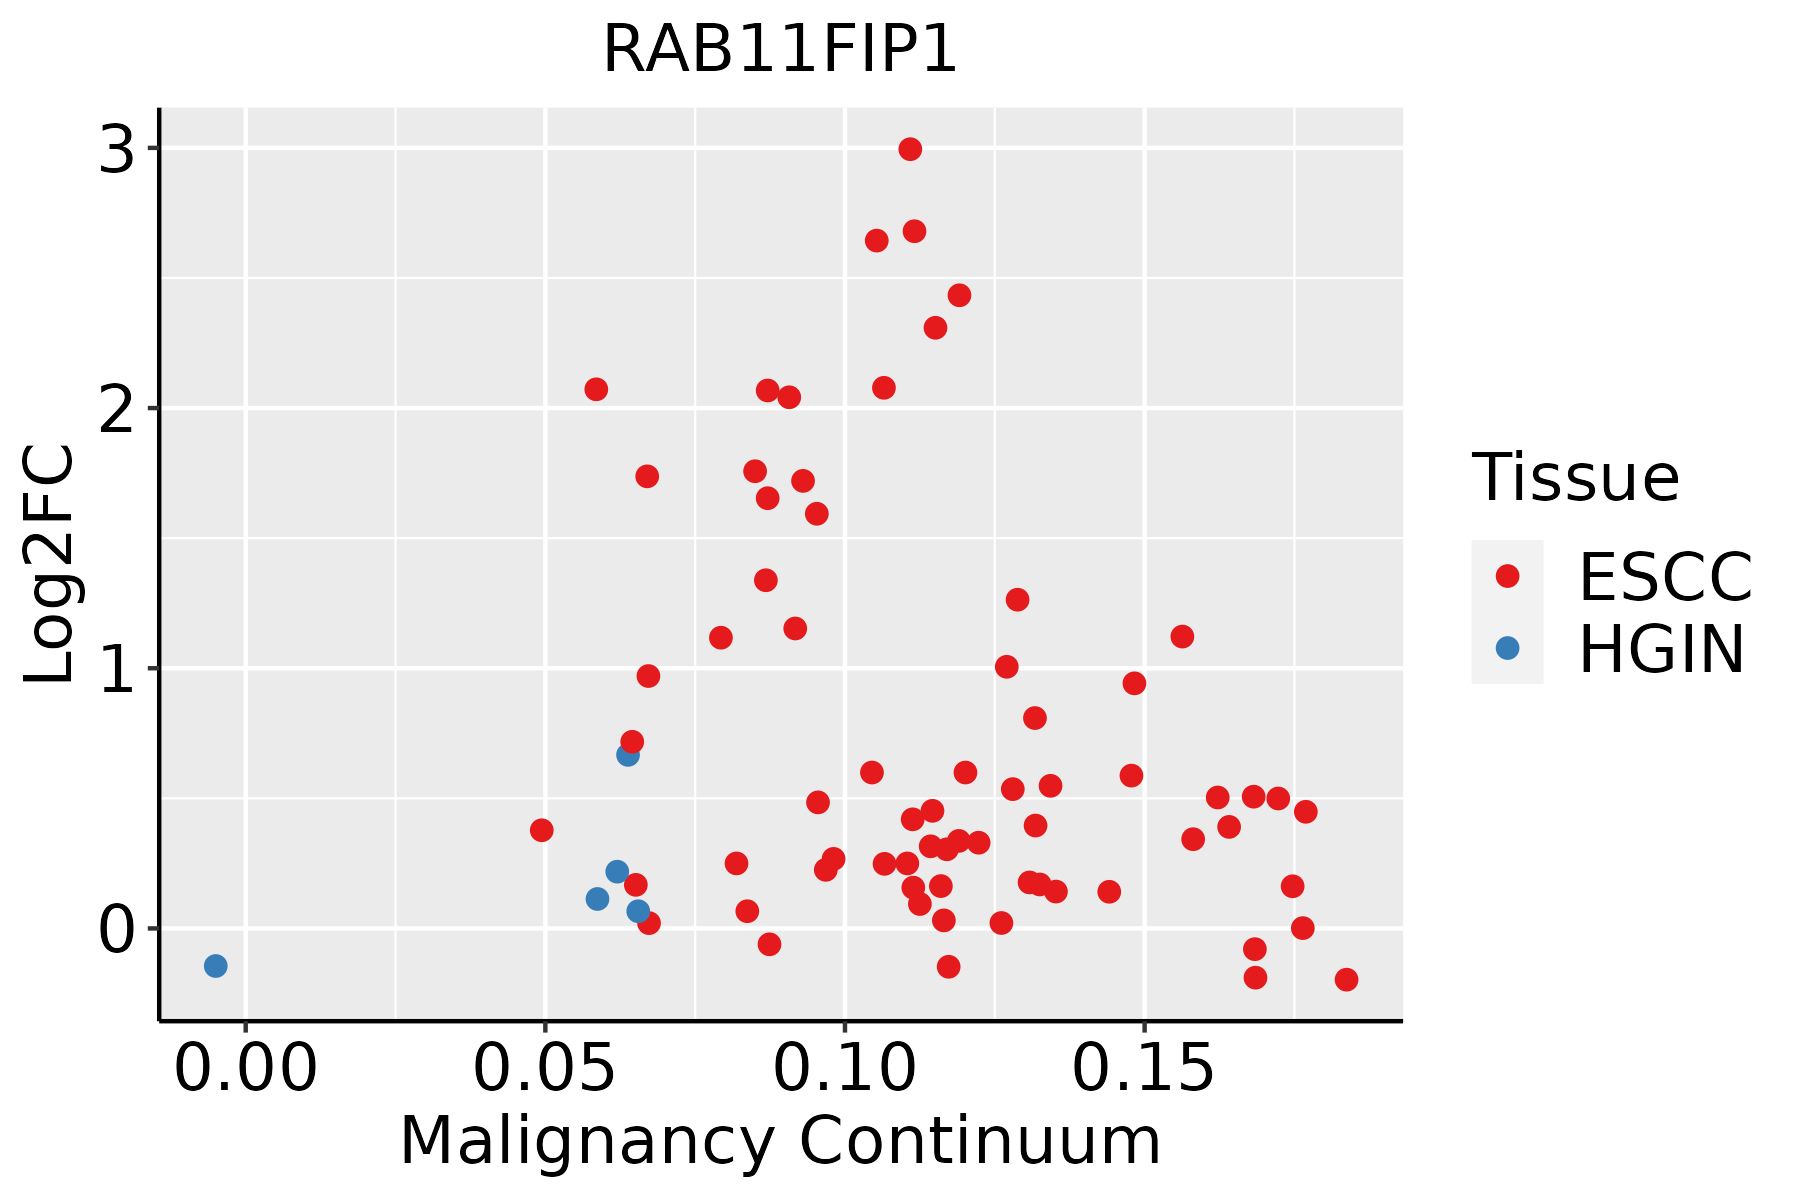 | ESCC: Esophageal squamous cell carcinoma |
| HGIN: High-grade intraepithelial neoplasias | ||
| LGIN: Low-grade intraepithelial neoplasias | ||
| GC | 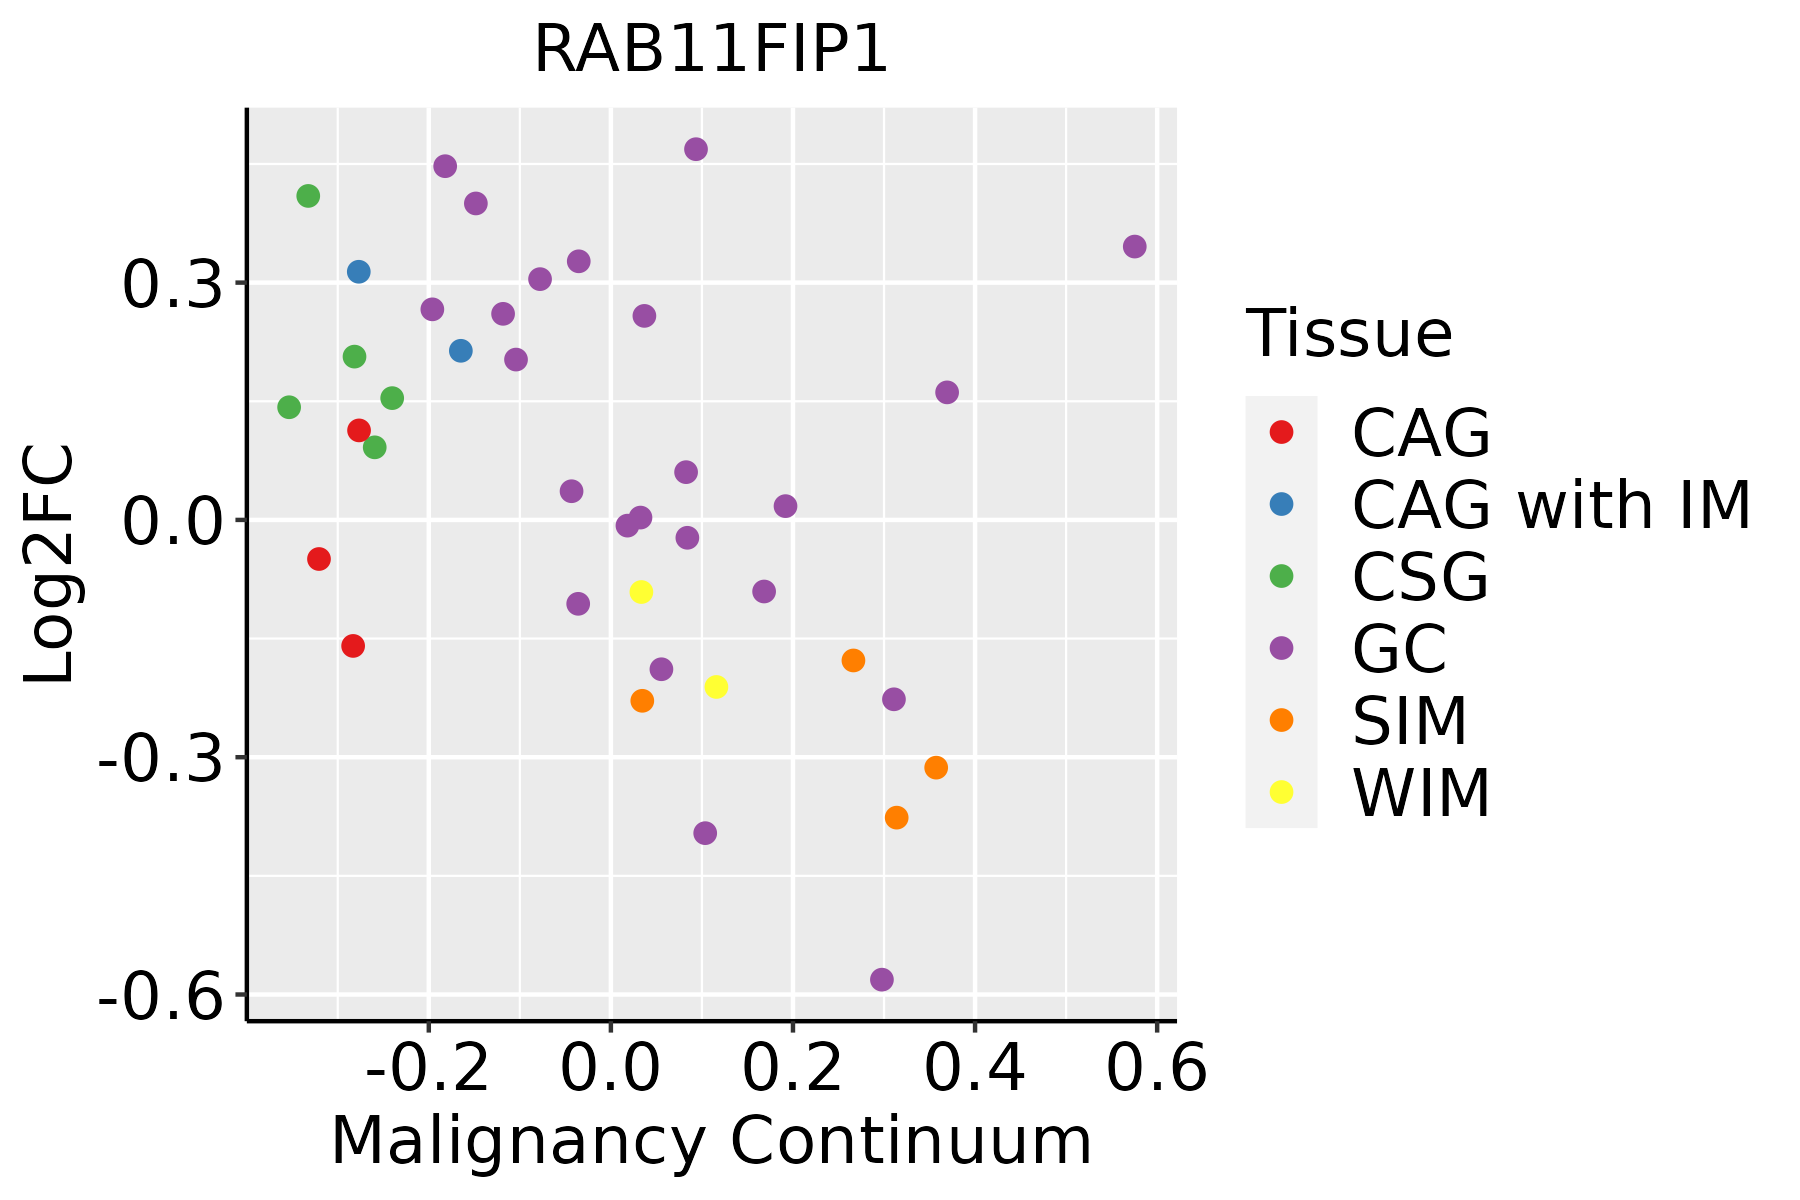 | CAG: Chronic atrophic gastritis |
| CAG with IM: Chronic atrophic gastritis with intestinal metaplasia | ||
| CSG: Chronic superficial gastritis | ||
| GC: Gastric cancer | ||
| SIM: Severe intestinal metaplasia | ||
| WIM: Wild intestinal metaplasia | ||
| Liver | 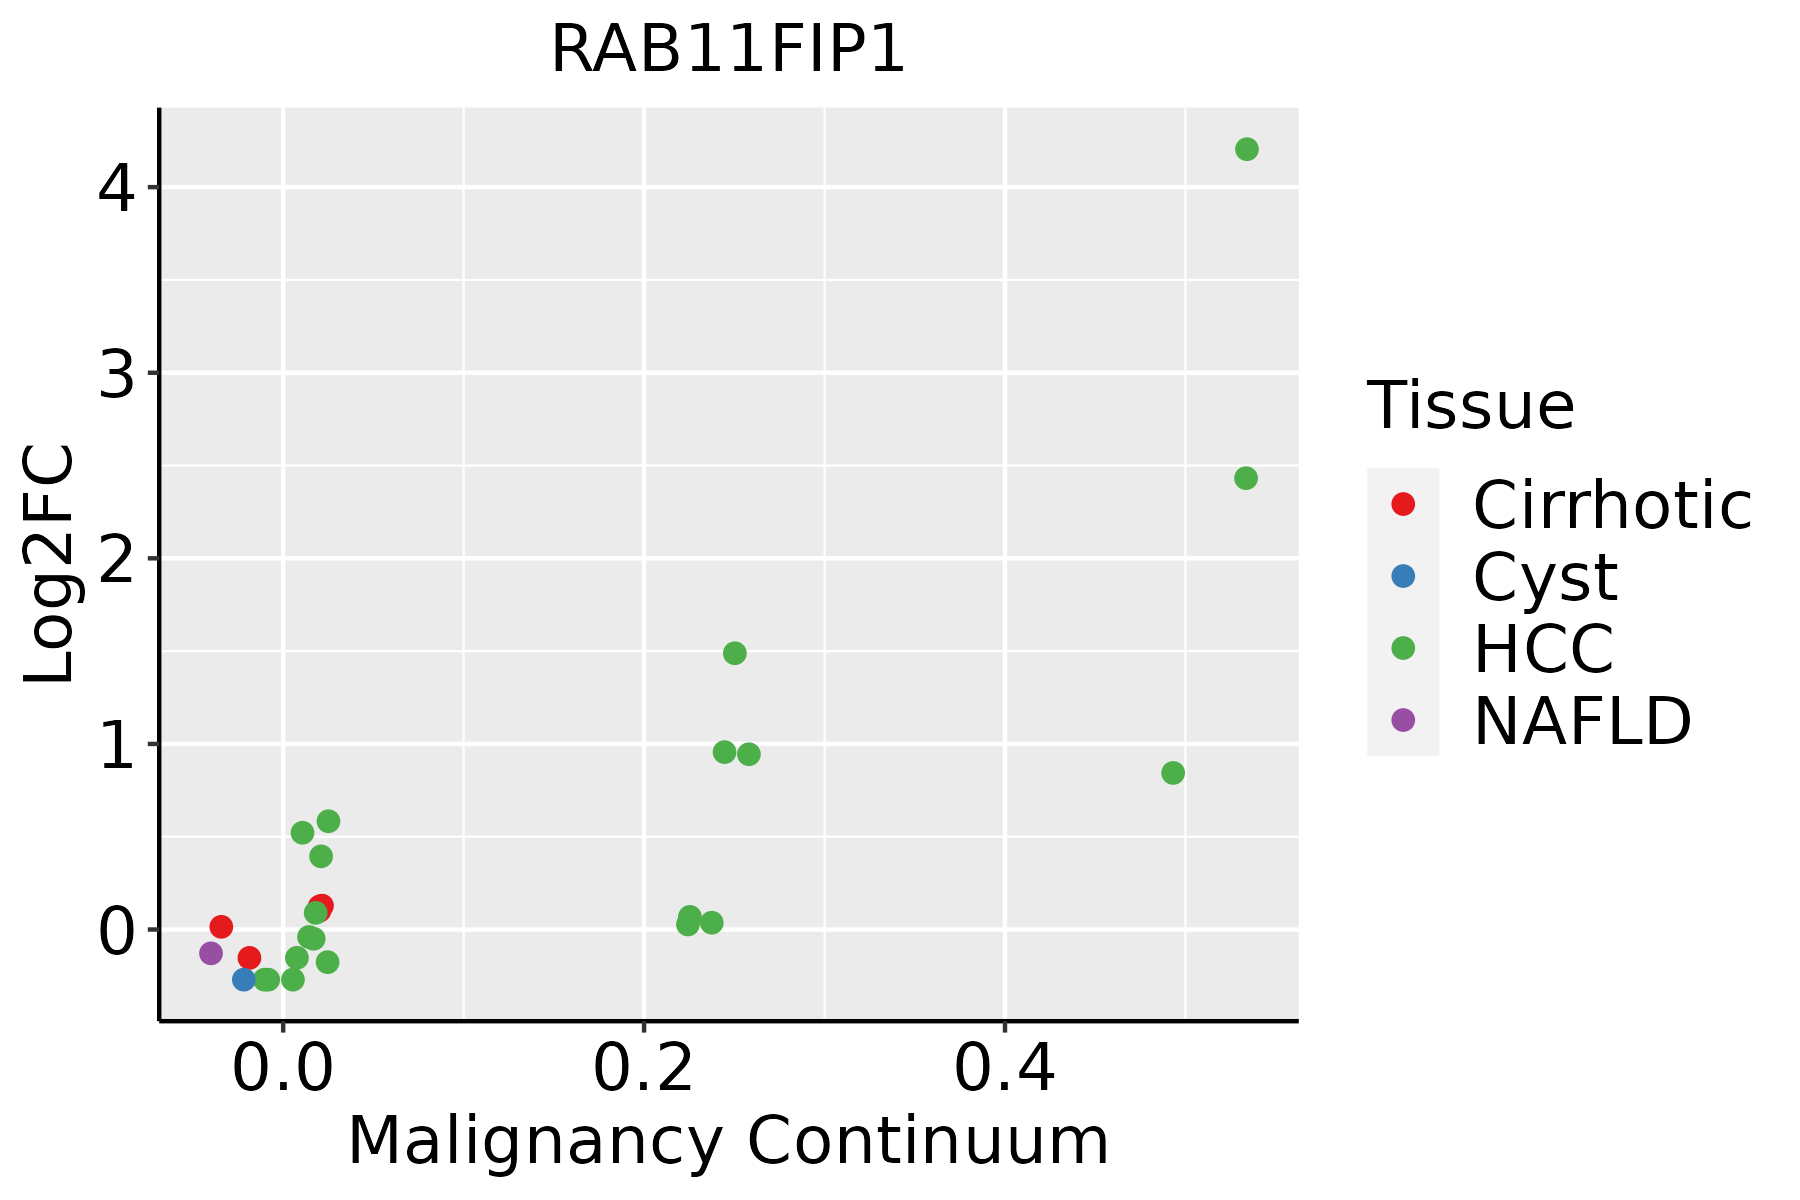 | HCC: Hepatocellular carcinoma |
| NAFLD: Non-alcoholic fatty liver disease | ||
| Lung |  | AAH: Atypical adenomatous hyperplasia |
| AIS: Adenocarcinoma in situ | ||
| IAC: Invasive lung adenocarcinoma | ||
| MIA: Minimally invasive adenocarcinoma | ||
| Oral Cavity | 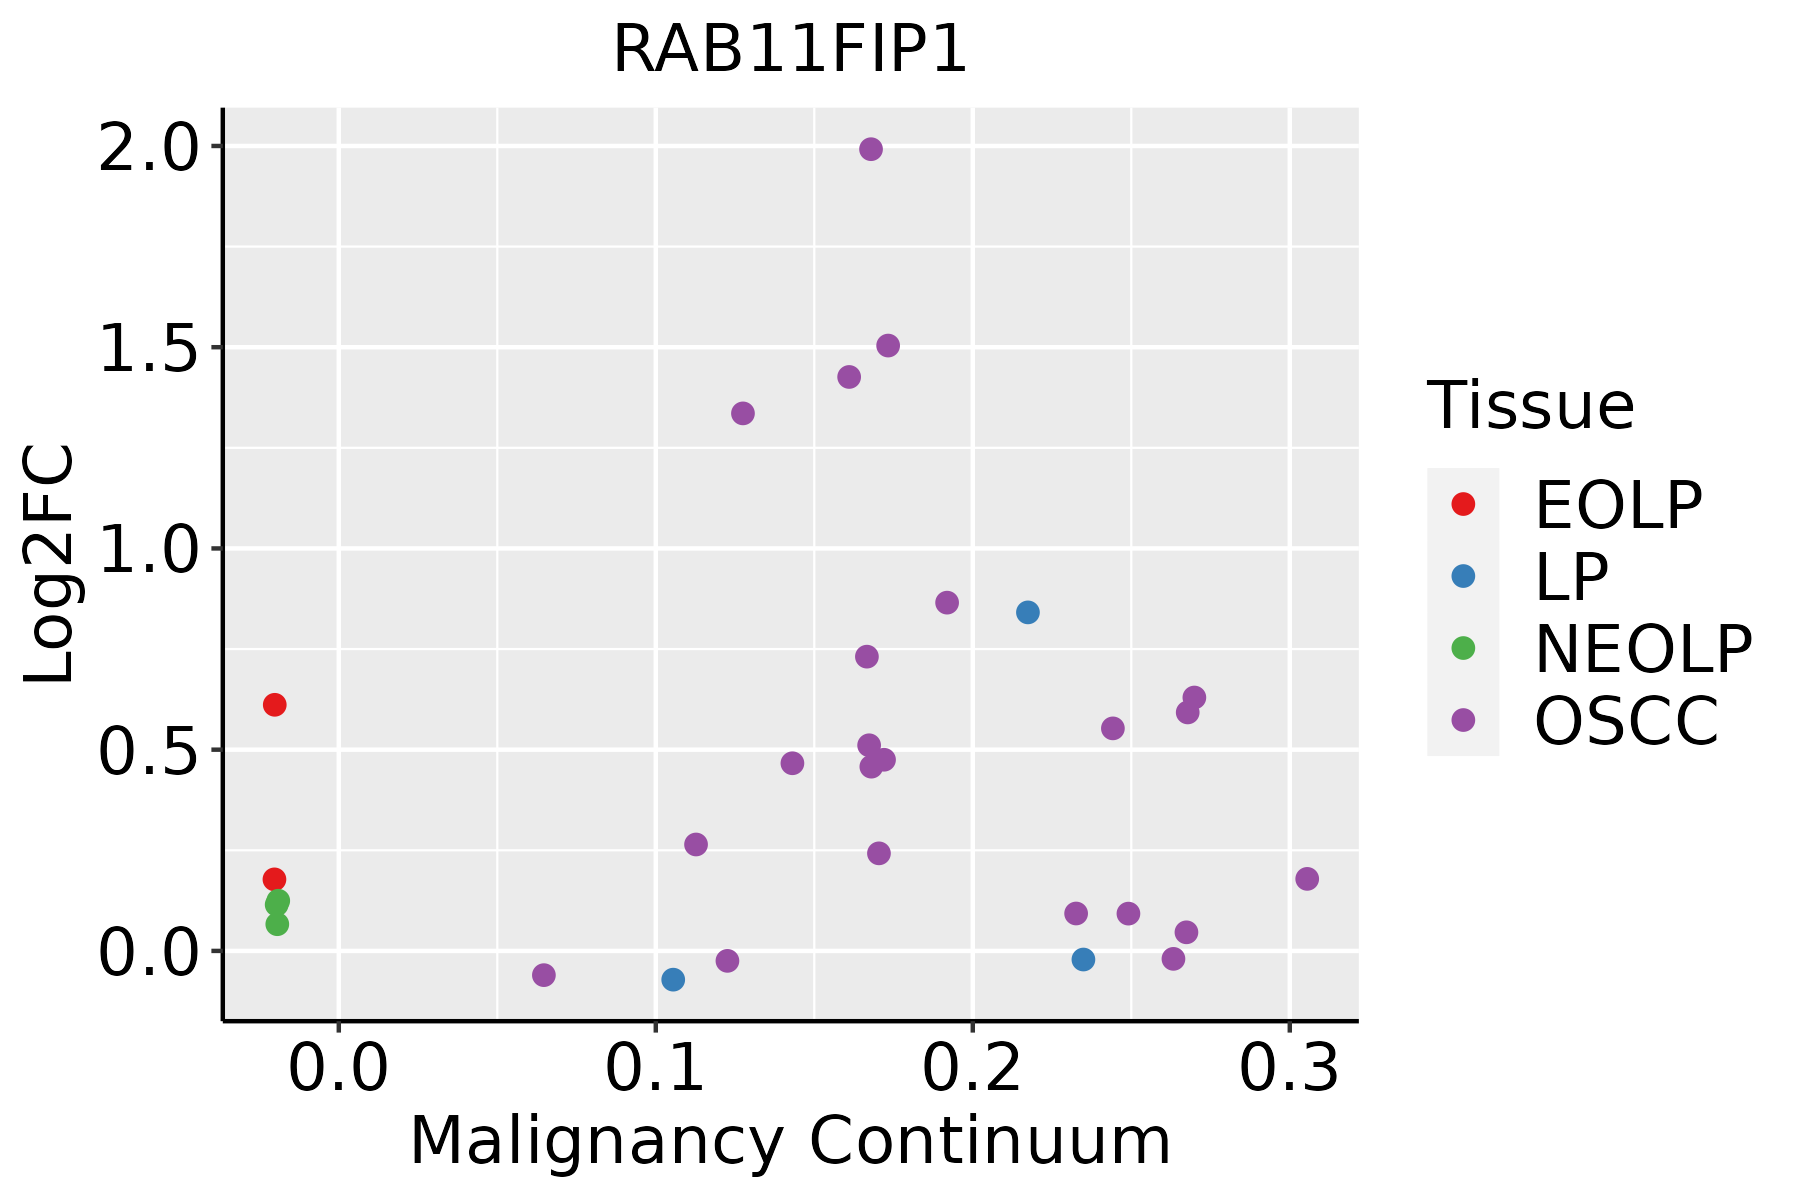 | EOLP: Erosive Oral lichen planus |
| LP: leukoplakia | ||
| NEOLP: Non-erosive oral lichen planus | ||
| OSCC: Oral squamous cell carcinoma | ||
| Prostate |  | BPH: Benign Prostatic Hyperplasia |
| Thyroid | 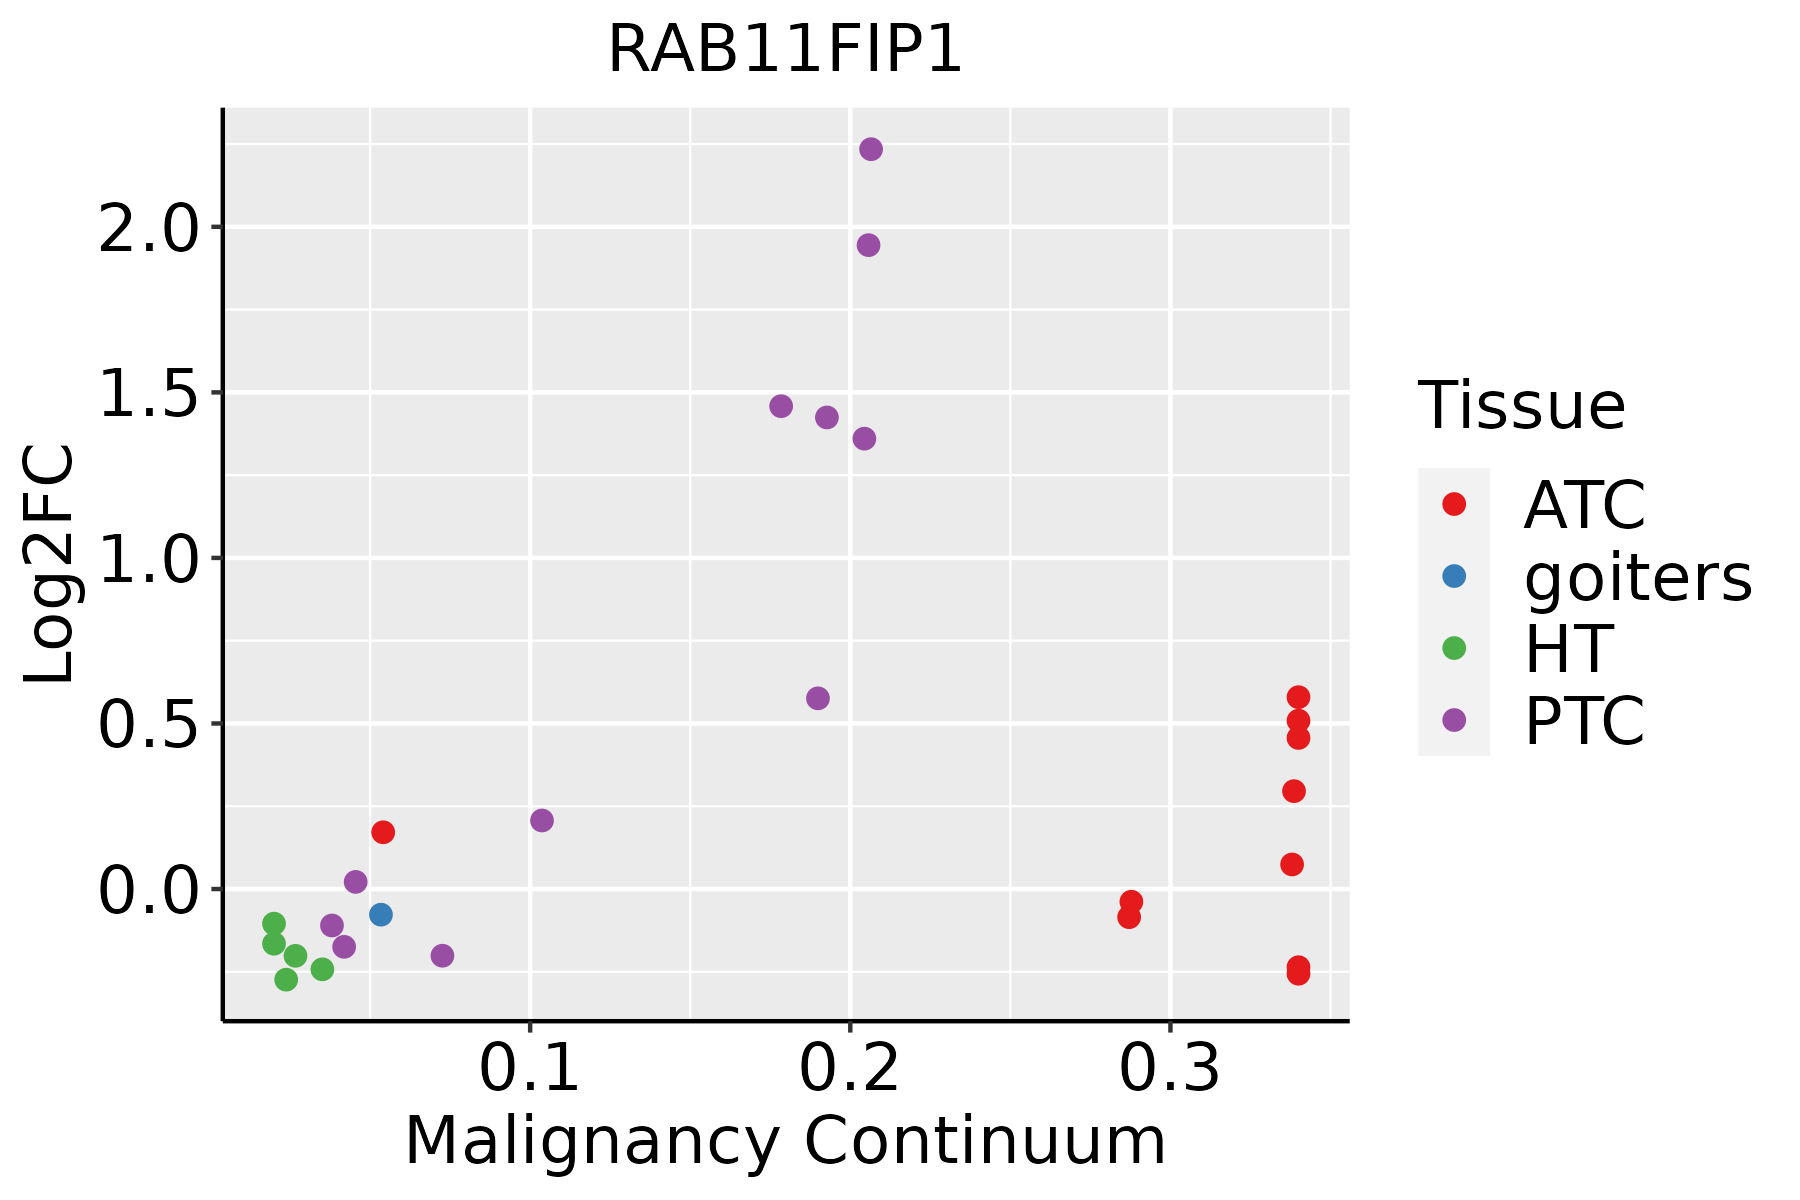 | ATC: Anaplastic thyroid cancer |
| HT: Hashimoto's thyroiditis | ||
| PTC: Papillary thyroid cancer |
| ∗log2FC in expression of this searched gene in stem-like cells from each diseased tissue sample relative to stem-like cells in normal samples in each tissue plotted against the malignancy continuum. Samples are colored based on if they are from different disease stage. |
Top |
Malignant transformation related pathway analysis |
| Find out the enriched GO biological processes and KEGG pathways involved in transition from healthy to precancer to cancer |
| Tissue | Disease Stage | Enriched GO biological Processes |
| Colorectum | AD |  |
| Colorectum | SER |  |
| Colorectum | MSS |  |
| Colorectum | MSI-H |  |
| Colorectum | FAP |  |
| ∗Top 15 enriched GO BP terms are showed in the bar plot of each disease state in each tissue. Each row represents a significant GO biological process which is colored according to the -log10(p.adjust). |
| Page: 1 2 3 4 5 6 7 8 9 |
| GO ID | Tissue | Disease Stage | Description | Gene Ratio | Bg Ratio | pvalue | p.adjust | Count |
| GO:00507086 | Breast | Precancer | regulation of protein secretion | 28/1080 | 268/18723 | 1.76e-03 | 1.74e-02 | 28 |
| GO:00716926 | Breast | Precancer | protein localization to extracellular region | 34/1080 | 368/18723 | 4.65e-03 | 3.58e-02 | 34 |
| GO:00093067 | Breast | Precancer | protein secretion | 33/1080 | 359/18723 | 5.65e-03 | 4.08e-02 | 33 |
| GO:00355927 | Breast | Precancer | establishment of protein localization to extracellular region | 33/1080 | 360/18723 | 5.89e-03 | 4.21e-02 | 33 |
| GO:005070812 | Breast | IDC | regulation of protein secretion | 36/1434 | 268/18723 | 6.93e-04 | 8.50e-03 | 36 |
| GO:007169212 | Breast | IDC | protein localization to extracellular region | 42/1434 | 368/18723 | 6.13e-03 | 4.38e-02 | 42 |
| GO:000930613 | Breast | IDC | protein secretion | 41/1434 | 359/18723 | 6.64e-03 | 4.63e-02 | 41 |
| GO:003559213 | Breast | IDC | establishment of protein localization to extracellular region | 41/1434 | 360/18723 | 6.96e-03 | 4.81e-02 | 41 |
| GO:005070822 | Breast | DCIS | regulation of protein secretion | 35/1390 | 268/18723 | 7.83e-04 | 9.11e-03 | 35 |
| GO:007169222 | Breast | DCIS | protein localization to extracellular region | 41/1390 | 368/18723 | 6.01e-03 | 4.29e-02 | 41 |
| GO:000930622 | Breast | DCIS | protein secretion | 40/1390 | 359/18723 | 6.59e-03 | 4.61e-02 | 40 |
| GO:003559222 | Breast | DCIS | establishment of protein localization to extracellular region | 40/1390 | 360/18723 | 6.90e-03 | 4.77e-02 | 40 |
| GO:0050708 | Colorectum | AD | regulation of protein secretion | 83/3918 | 268/18723 | 6.59e-05 | 1.07e-03 | 83 |
| GO:0009306 | Colorectum | AD | protein secretion | 105/3918 | 359/18723 | 1.05e-04 | 1.57e-03 | 105 |
| GO:0035592 | Colorectum | AD | establishment of protein localization to extracellular region | 105/3918 | 360/18723 | 1.18e-04 | 1.73e-03 | 105 |
| GO:0071692 | Colorectum | AD | protein localization to extracellular region | 106/3918 | 368/18723 | 1.86e-04 | 2.49e-03 | 106 |
| GO:0006887 | Colorectum | AD | exocytosis | 96/3918 | 352/18723 | 2.48e-03 | 1.90e-02 | 96 |
| GO:00507082 | Colorectum | MSS | regulation of protein secretion | 78/3467 | 268/18723 | 1.47e-05 | 3.33e-04 | 78 |
| GO:00093062 | Colorectum | MSS | protein secretion | 98/3467 | 359/18723 | 2.43e-05 | 5.09e-04 | 98 |
| GO:00355922 | Colorectum | MSS | establishment of protein localization to extracellular region | 98/3467 | 360/18723 | 2.75e-05 | 5.58e-04 | 98 |
| Page: 1 2 3 4 5 6 |
| Pathway ID | Tissue | Disease Stage | Description | Gene Ratio | Bg Ratio | pvalue | p.adjust | qvalue | Count |
| hsa0414416 | Breast | DCIS | Endocytosis | 37/846 | 251/8465 | 9.92e-03 | 4.40e-02 | 3.24e-02 | 37 |
| hsa0414417 | Breast | DCIS | Endocytosis | 37/846 | 251/8465 | 9.92e-03 | 4.40e-02 | 3.24e-02 | 37 |
| hsa04144 | Colorectum | AD | Endocytosis | 111/2092 | 251/8465 | 5.95e-12 | 1.42e-10 | 9.08e-11 | 111 |
| hsa041441 | Colorectum | AD | Endocytosis | 111/2092 | 251/8465 | 5.95e-12 | 1.42e-10 | 9.08e-11 | 111 |
| hsa041444 | Colorectum | MSS | Endocytosis | 102/1875 | 251/8465 | 1.85e-11 | 4.43e-10 | 2.71e-10 | 102 |
| hsa041445 | Colorectum | MSS | Endocytosis | 102/1875 | 251/8465 | 1.85e-11 | 4.43e-10 | 2.71e-10 | 102 |
| hsa041446 | Colorectum | FAP | Endocytosis | 78/1404 | 251/8465 | 6.20e-09 | 2.96e-07 | 1.80e-07 | 78 |
| hsa041447 | Colorectum | FAP | Endocytosis | 78/1404 | 251/8465 | 6.20e-09 | 2.96e-07 | 1.80e-07 | 78 |
| hsa041448 | Colorectum | CRC | Endocytosis | 65/1091 | 251/8465 | 1.27e-08 | 1.06e-06 | 7.19e-07 | 65 |
| hsa041449 | Colorectum | CRC | Endocytosis | 65/1091 | 251/8465 | 1.27e-08 | 1.06e-06 | 7.19e-07 | 65 |
| hsa0414420 | Endometrium | AEH | Endocytosis | 56/1197 | 251/8465 | 2.58e-04 | 2.15e-03 | 1.57e-03 | 56 |
| hsa04144110 | Endometrium | AEH | Endocytosis | 56/1197 | 251/8465 | 2.58e-04 | 2.15e-03 | 1.57e-03 | 56 |
| hsa0414424 | Endometrium | EEC | Endocytosis | 57/1237 | 251/8465 | 3.34e-04 | 2.82e-03 | 2.10e-03 | 57 |
| hsa0414434 | Endometrium | EEC | Endocytosis | 57/1237 | 251/8465 | 3.34e-04 | 2.82e-03 | 2.10e-03 | 57 |
| hsa04144210 | Esophagus | ESCC | Endocytosis | 186/4205 | 251/8465 | 9.74e-16 | 4.66e-14 | 2.39e-14 | 186 |
| hsa0414437 | Esophagus | ESCC | Endocytosis | 186/4205 | 251/8465 | 9.74e-16 | 4.66e-14 | 2.39e-14 | 186 |
| hsa0414412 | Liver | Cirrhotic | Endocytosis | 119/2530 | 251/8465 | 2.33e-09 | 4.56e-08 | 2.81e-08 | 119 |
| hsa0414413 | Liver | Cirrhotic | Endocytosis | 119/2530 | 251/8465 | 2.33e-09 | 4.56e-08 | 2.81e-08 | 119 |
| hsa0414422 | Liver | HCC | Endocytosis | 178/4020 | 251/8465 | 2.03e-14 | 5.22e-13 | 2.91e-13 | 178 |
| hsa0414432 | Liver | HCC | Endocytosis | 178/4020 | 251/8465 | 2.03e-14 | 5.22e-13 | 2.91e-13 | 178 |
| Page: 1 2 |
Top |
Cell-cell communication analysis |
| Identification of potential cell-cell interactions between two cell types and their ligand-receptor pairs for different disease states |
| Ligand | Receptor | LRpair | Pathway | Tissue | Disease Stage |
| Page: 1 |
Top |
Single-cell gene regulatory network inference analysis |
| Find out the significant the regulons (TFs) and the target genes of each regulon across cell types for different disease states |
| TF | Cell Type | Tissue | Disease Stage | Target Gene | RSS | Regulon Activity |
| ∗The dot plots of a searched regulon are shown for all cell subpopulations in each disease state of each tissue based on the regulon specific score inferred using pySCENIC and by calculating the average expression. |
| Page: 1 |
Top |
Somatic mutation of malignant transformation related genes |
| Annotation of somatic variants for genes involved in malignant transformation |
| Hugo Symbol | Variant Class | Variant Classification | dbSNP RS | HGVSc | HGVSp | HGVSp Short | SWISSPROT | BIOTYPE | SIFT | PolyPhen | Tumor Sample Barcode | Tissue | Histology | Sex | Age | Stage | Therapy Types | Drugs | Outcome |
| RAB11FIP1 | SNV | Missense_Mutation | rs144979959 | c.2365N>T | p.Arg789Trp | p.R789W | Q6WKZ4 | protein_coding | deleterious(0) | possibly_damaging(0.471) | TCGA-A2-A0CX-01 | Breast | breast invasive carcinoma | Female | <65 | I/II | Chemotherapy | adriamycin | SD |
| RAB11FIP1 | SNV | Missense_Mutation | c.1109N>T | p.Ala370Val | p.A370V | Q6WKZ4 | protein_coding | deleterious(0.01) | benign(0.059) | TCGA-BH-A0HF-01 | Breast | breast invasive carcinoma | Female | >=65 | I/II | Hormone Therapy | arimidex | SD | |
| RAB11FIP1 | SNV | Missense_Mutation | rs558154048 | c.745C>T | p.Arg249Cys | p.R249C | Q6WKZ4 | protein_coding | deleterious(0) | probably_damaging(0.969) | TCGA-C8-A26V-01 | Breast | breast invasive carcinoma | Female | <65 | III/IV | Hormone Therapy | tamoxiphen | CR |
| RAB11FIP1 | SNV | Missense_Mutation | novel | c.977N>G | p.Leu326Arg | p.L326R | Q6WKZ4 | protein_coding | tolerated(0.08) | possibly_damaging(0.847) | TCGA-C8-A26Z-01 | Breast | breast invasive carcinoma | Female | <65 | I/II | Hormone Therapy | tamoxiphen | CR |
| RAB11FIP1 | SNV | Missense_Mutation | c.2041N>C | p.Glu681Gln | p.E681Q | Q6WKZ4 | protein_coding | tolerated(0.25) | possibly_damaging(0.521) | TCGA-D8-A1JA-01 | Breast | breast invasive carcinoma | Female | <65 | III/IV | Chemotherapy | adriamycin | PD | |
| RAB11FIP1 | SNV | Missense_Mutation | c.3656C>G | p.Ala1219Gly | p.A1219G | Q6WKZ4 | protein_coding | deleterious(0.03) | probably_damaging(0.961) | TCGA-D8-A1XW-01 | Breast | breast invasive carcinoma | Female | <65 | I/II | Chemotherapy | adriamycin+cyclophosphamide | SD | |
| RAB11FIP1 | SNV | Missense_Mutation | c.2245N>C | p.Asp749His | p.D749H | Q6WKZ4 | protein_coding | tolerated(0.23) | benign(0.003) | TCGA-E2-A1LH-01 | Breast | breast invasive carcinoma | Female | <65 | I/II | Chemotherapy | adriamycin | SD | |
| RAB11FIP1 | SNV | Missense_Mutation | c.3533C>A | p.Pro1178His | p.P1178H | Q6WKZ4 | protein_coding | deleterious(0) | probably_damaging(0.994) | TCGA-E9-A1ND-01 | Breast | breast invasive carcinoma | Female | >=65 | I/II | Hormone Therapy | aromasin | SD | |
| RAB11FIP1 | SNV | Missense_Mutation | rs375920711 | c.2795N>A | p.Gly932Asp | p.G932D | Q6WKZ4 | protein_coding | deleterious(0) | probably_damaging(0.996) | TCGA-E9-A1R2-01 | Breast | breast invasive carcinoma | Female | <65 | III/IV | Chemotherapy | taxotere | CR |
| RAB11FIP1 | SNV | Missense_Mutation | novel | c.2331N>T | p.Met777Ile | p.M777I | Q6WKZ4 | protein_coding | tolerated(0.18) | benign(0.018) | TCGA-OL-A6VO-01 | Breast | breast invasive carcinoma | Female | <65 | I/II | Chemotherapy | taxotere | CR |
| Page: 1 2 3 4 5 6 7 8 9 10 11 12 |
Top |
Related drugs of malignant transformation related genes |
| Identification of chemicals and drugs interact with genes involved in malignant transfromation |
| (DGIdb 4.0) |
| Entrez ID | Symbol | Category | Interaction Types | Drug Claim Name | Drug Name | PMIDs |
| Page: 1 |

Copyright 2023-Present -The University of Texas Health Science Center at Houston |