
|
|||||
|
 | |
| |
| |
| |
| |
| |
|
Gene: R3HDM4 |
Gene summary for R3HDM4 |
| Gene information | Species | Human | Gene symbol | R3HDM4 | Gene ID | 91300 |
| Gene name | R3H domain containing 4 | |
| Gene Alias | C19orf22 | |
| Cytomap | 19p13.3 | |
| Gene Type | protein-coding | GO ID | GO:0005575 | UniProtAcc | Q96D70 |
Top |
Malignant transformation analysis |
| Identification of the aberrant gene expression in precancerous and cancerous lesions by comparing the gene expression of stem-like cells in diseased tissues with normal stem cells |
| Entrez ID | Symbol | Replicates | Species | Organ | Tissue | Adj P-value | Log2FC | Malignancy |
| 91300 | R3HDM4 | LZE4T | Human | Esophagus | ESCC | 3.55e-07 | 1.29e-01 | 0.0811 |
| 91300 | R3HDM4 | LZE8T | Human | Esophagus | ESCC | 4.09e-05 | 1.86e-01 | 0.067 |
| 91300 | R3HDM4 | LZE20T | Human | Esophagus | ESCC | 3.15e-05 | 2.76e-01 | 0.0662 |
| 91300 | R3HDM4 | LZE22D1 | Human | Esophagus | HGIN | 8.55e-07 | 3.58e-01 | 0.0595 |
| 91300 | R3HDM4 | LZE24T | Human | Esophagus | ESCC | 1.25e-28 | 9.49e-01 | 0.0596 |
| 91300 | R3HDM4 | LZE22D3 | Human | Esophagus | HGIN | 1.18e-02 | 2.80e-01 | 0.0653 |
| 91300 | R3HDM4 | LZE21T | Human | Esophagus | ESCC | 1.83e-04 | 4.43e-01 | 0.0655 |
| 91300 | R3HDM4 | P1T-E | Human | Esophagus | ESCC | 1.92e-12 | 9.65e-01 | 0.0875 |
| 91300 | R3HDM4 | P2T-E | Human | Esophagus | ESCC | 7.37e-17 | 2.67e-01 | 0.1177 |
| 91300 | R3HDM4 | P4T-E | Human | Esophagus | ESCC | 9.84e-33 | 7.62e-01 | 0.1323 |
| 91300 | R3HDM4 | P5T-E | Human | Esophagus | ESCC | 1.04e-23 | 2.61e-01 | 0.1327 |
| 91300 | R3HDM4 | P8T-E | Human | Esophagus | ESCC | 7.89e-18 | 2.98e-01 | 0.0889 |
| 91300 | R3HDM4 | P9T-E | Human | Esophagus | ESCC | 1.15e-28 | 7.26e-01 | 0.1131 |
| 91300 | R3HDM4 | P10T-E | Human | Esophagus | ESCC | 7.97e-30 | 4.35e-01 | 0.116 |
| 91300 | R3HDM4 | P11T-E | Human | Esophagus | ESCC | 4.74e-08 | 5.66e-01 | 0.1426 |
| 91300 | R3HDM4 | P12T-E | Human | Esophagus | ESCC | 1.45e-31 | 5.85e-01 | 0.1122 |
| 91300 | R3HDM4 | P15T-E | Human | Esophagus | ESCC | 6.97e-36 | 9.02e-01 | 0.1149 |
| 91300 | R3HDM4 | P16T-E | Human | Esophagus | ESCC | 7.89e-23 | 5.04e-01 | 0.1153 |
| 91300 | R3HDM4 | P17T-E | Human | Esophagus | ESCC | 1.81e-15 | 7.83e-01 | 0.1278 |
| 91300 | R3HDM4 | P19T-E | Human | Esophagus | ESCC | 1.39e-04 | 7.38e-01 | 0.1662 |
| Page: 1 2 3 4 5 6 |
| Tissue | Expression Dynamics | Abbreviation |
| Esophagus |  | ESCC: Esophageal squamous cell carcinoma |
| HGIN: High-grade intraepithelial neoplasias | ||
| LGIN: Low-grade intraepithelial neoplasias | ||
| Liver | 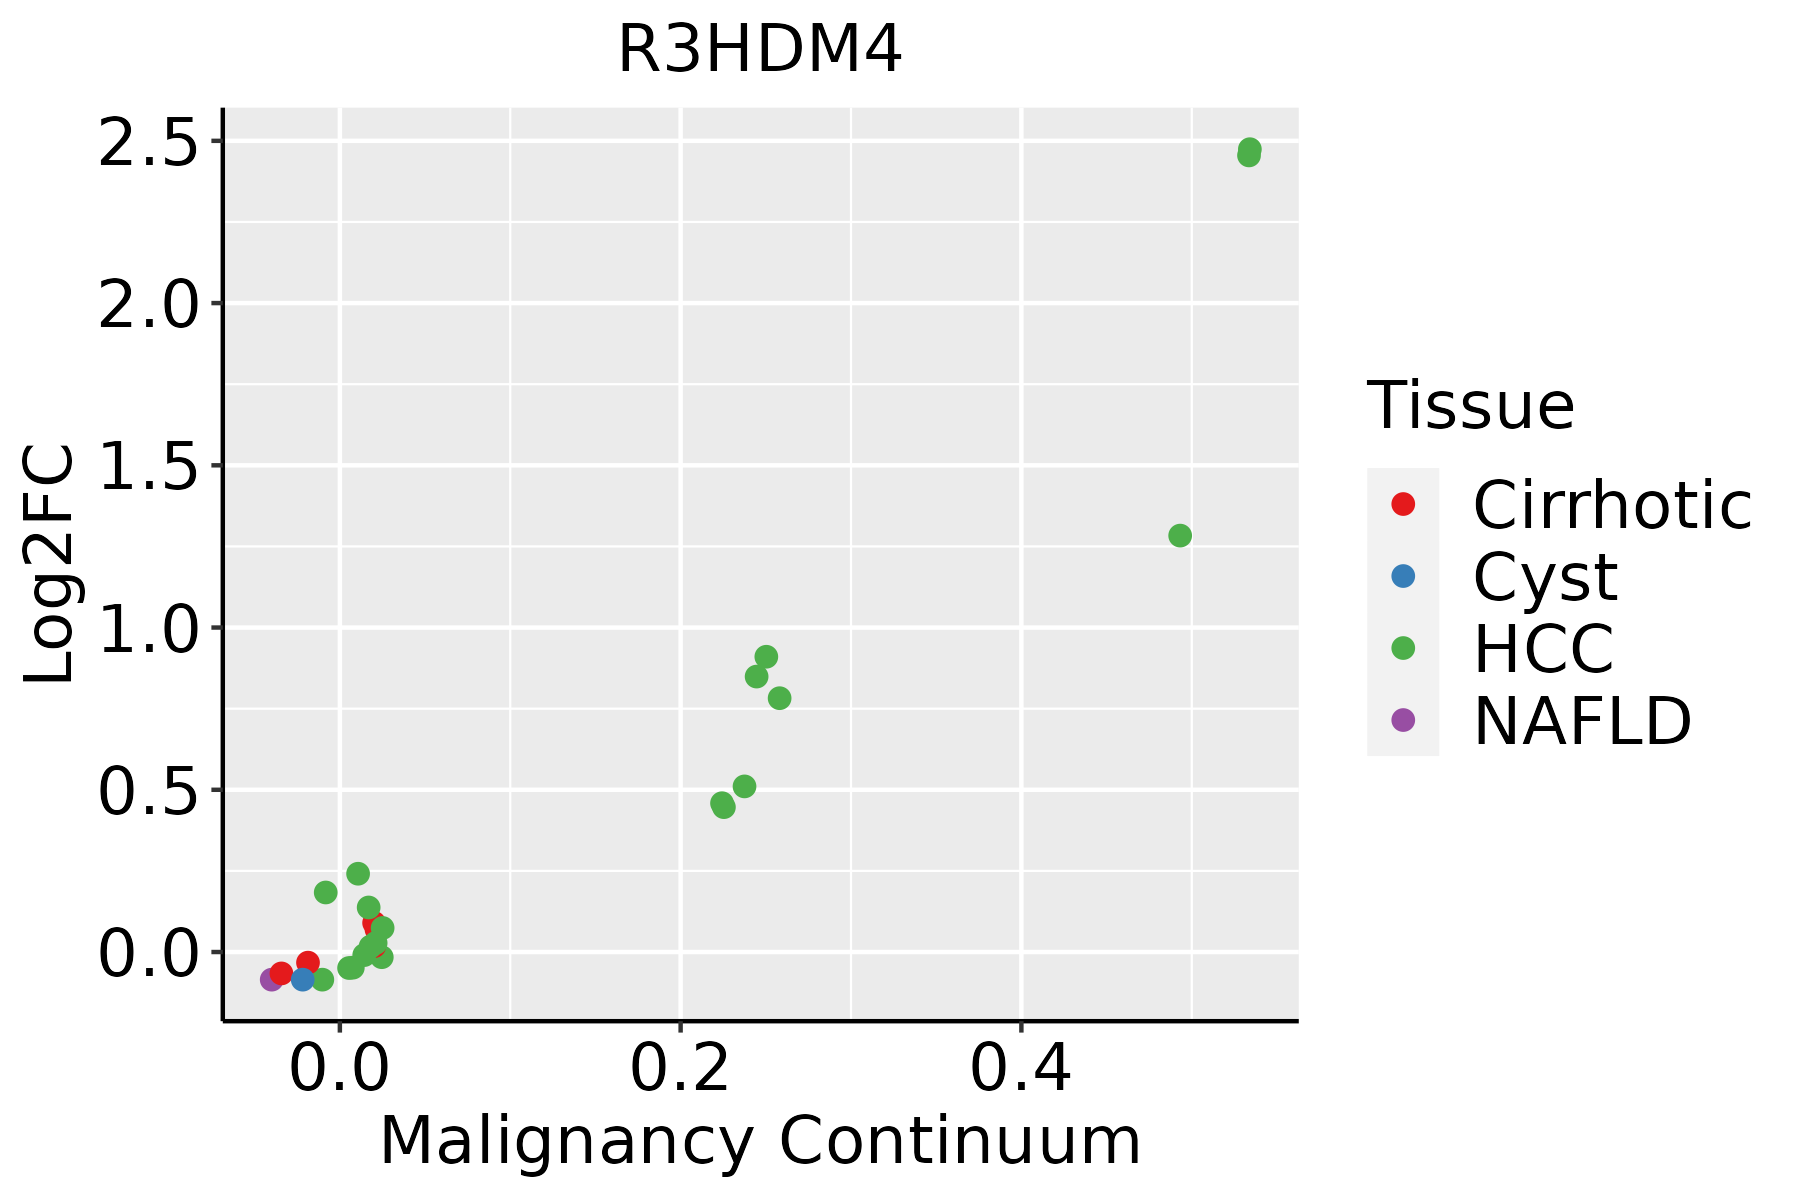 | HCC: Hepatocellular carcinoma |
| NAFLD: Non-alcoholic fatty liver disease | ||
| Oral Cavity | 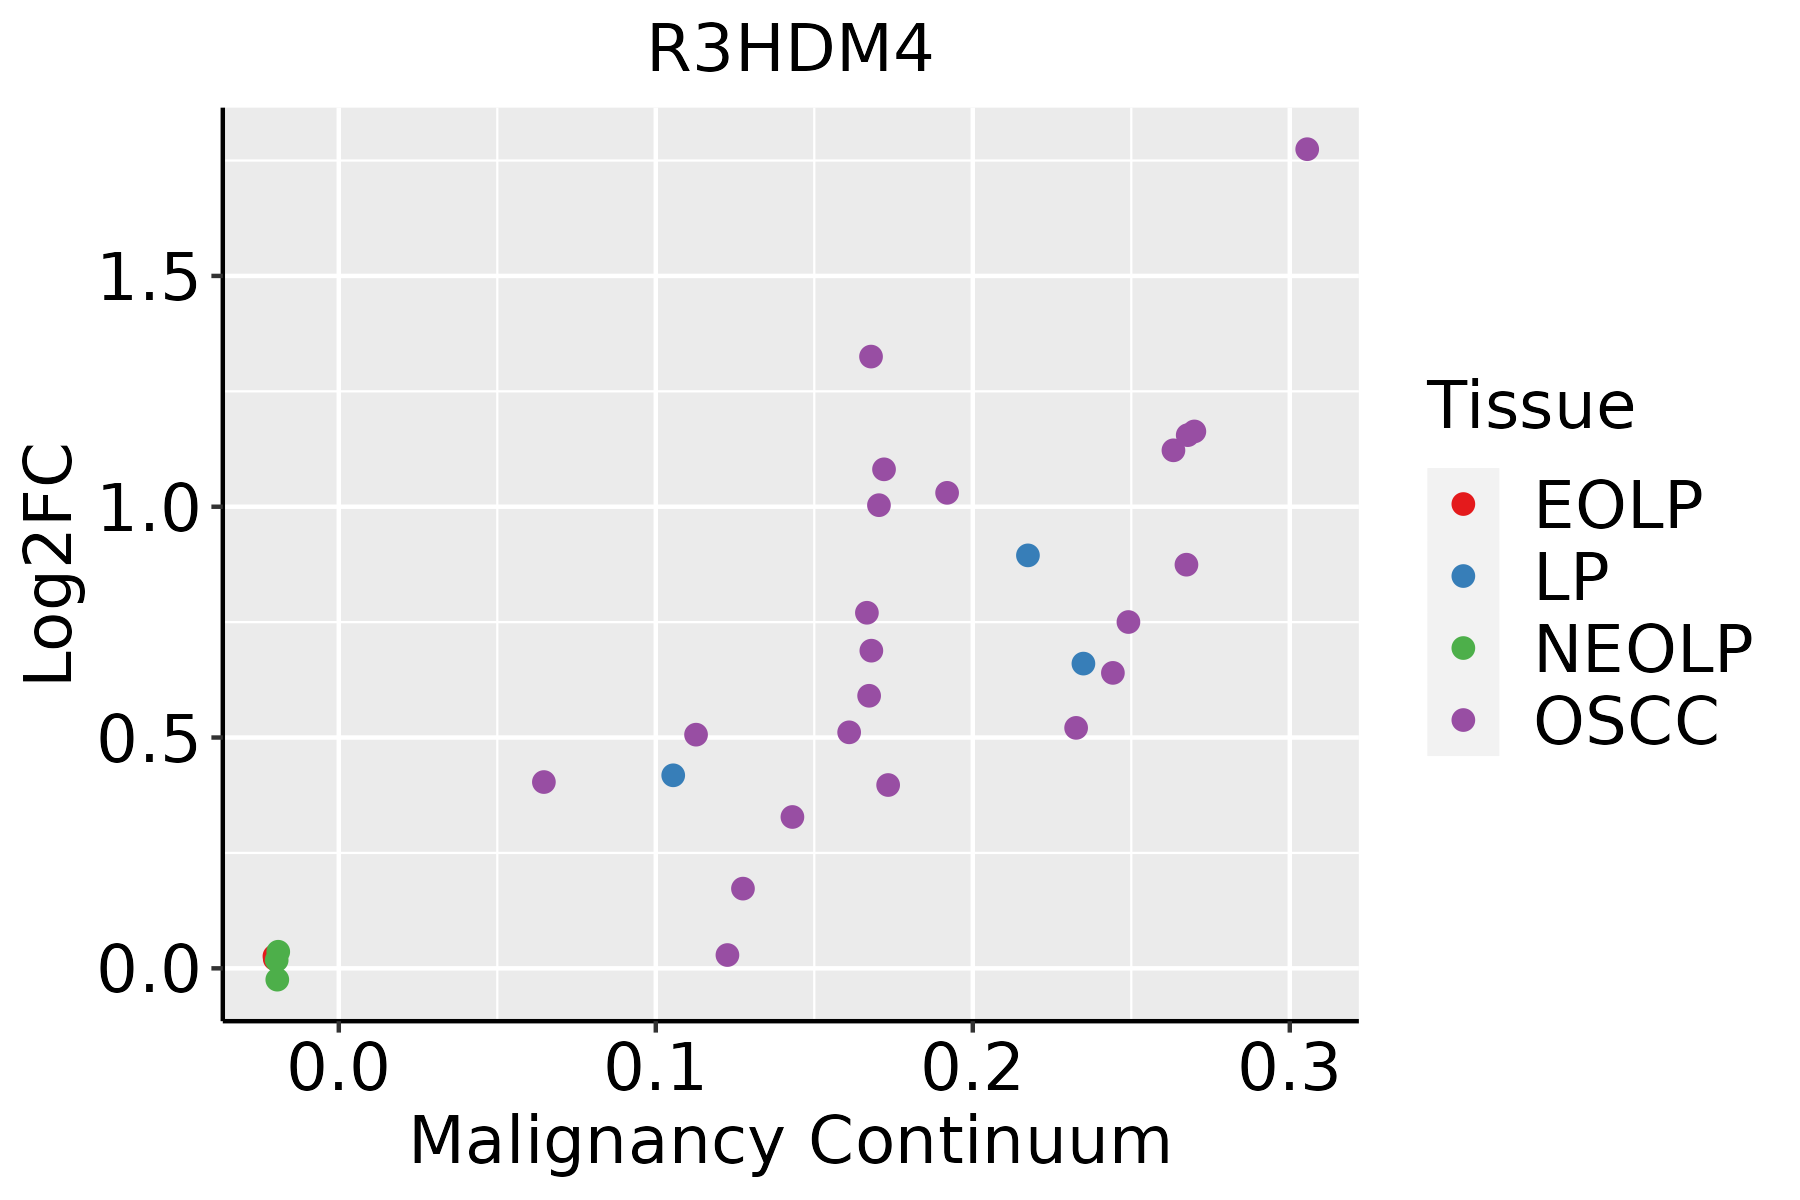 | EOLP: Erosive Oral lichen planus |
| LP: leukoplakia | ||
| NEOLP: Non-erosive oral lichen planus | ||
| OSCC: Oral squamous cell carcinoma | ||
| Skin |  | AK: Actinic keratosis |
| cSCC: Cutaneous squamous cell carcinoma | ||
| SCCIS:squamous cell carcinoma in situ | ||
| Thyroid |  | ATC: Anaplastic thyroid cancer |
| HT: Hashimoto's thyroiditis | ||
| PTC: Papillary thyroid cancer |
| ∗log2FC in expression of this searched gene in stem-like cells from each diseased tissue sample relative to stem-like cells in normal samples in each tissue plotted against the malignancy continuum. Samples are colored based on if they are from different disease stage. |
Top |
Malignant transformation related pathway analysis |
| Find out the enriched GO biological processes and KEGG pathways involved in transition from healthy to precancer to cancer |
| Tissue | Disease Stage | Enriched GO biological Processes |
| Colorectum | AD |  |
| Colorectum | SER |  |
| Colorectum | MSS |  |
| Colorectum | MSI-H |  |
| Colorectum | FAP |  |
| ∗Top 15 enriched GO BP terms are showed in the bar plot of each disease state in each tissue. Each row represents a significant GO biological process which is colored according to the -log10(p.adjust). |
| Page: 1 2 3 4 5 6 7 8 9 |
| GO ID | Tissue | Disease Stage | Description | Gene Ratio | Bg Ratio | pvalue | p.adjust | Count |
| Page: 1 |
| Pathway ID | Tissue | Disease Stage | Description | Gene Ratio | Bg Ratio | pvalue | p.adjust | qvalue | Count |
| Page: 1 |
Top |
Cell-cell communication analysis |
| Identification of potential cell-cell interactions between two cell types and their ligand-receptor pairs for different disease states |
| Ligand | Receptor | LRpair | Pathway | Tissue | Disease Stage |
| Page: 1 |
Top |
Single-cell gene regulatory network inference analysis |
| Find out the significant the regulons (TFs) and the target genes of each regulon across cell types for different disease states |
| TF | Cell Type | Tissue | Disease Stage | Target Gene | RSS | Regulon Activity |
| ∗The dot plots of a searched regulon are shown for all cell subpopulations in each disease state of each tissue based on the regulon specific score inferred using pySCENIC and by calculating the average expression. |
| Page: 1 |
Top |
Somatic mutation of malignant transformation related genes |
| Annotation of somatic variants for genes involved in malignant transformation |
| Hugo Symbol | Variant Class | Variant Classification | dbSNP RS | HGVSc | HGVSp | HGVSp Short | SWISSPROT | BIOTYPE | SIFT | PolyPhen | Tumor Sample Barcode | Tissue | Histology | Sex | Age | Stage | Therapy Types | Drugs | Outcome |
| R3HDM4 | SNV | Missense_Mutation | rs537357318 | c.524N>A | p.Arg175His | p.R175H | Q96D70 | protein_coding | deleterious(0.01) | benign(0.069) | TCGA-E9-A1RE-01 | Breast | breast invasive carcinoma | Female | >=65 | III/IV | Hormone Therapy | tamoxiphen | SD |
| R3HDM4 | insertion | Frame_Shift_Ins | novel | c.398_404dupTTCTTCG | p.Tyr136SerfsTer7 | p.Y136Sfs*7 | Q96D70 | protein_coding | TCGA-OL-A5DA-01 | Breast | breast invasive carcinoma | Female | <65 | I/II | Unknown | Unknown | SD | ||
| R3HDM4 | SNV | Missense_Mutation | rs777141353 | c.484G>A | p.Ala162Thr | p.A162T | Q96D70 | protein_coding | deleterious(0.04) | benign(0.198) | TCGA-AA-3663-01 | Colorectum | colon adenocarcinoma | Male | <65 | I/II | Unknown | Unknown | SD |
| R3HDM4 | SNV | Missense_Mutation | novel | c.506N>C | p.Phe169Ser | p.F169S | Q96D70 | protein_coding | deleterious(0) | probably_damaging(0.948) | TCGA-CK-4951-01 | Colorectum | colon adenocarcinoma | Female | >=65 | I/II | Unknown | Unknown | PD |
| R3HDM4 | SNV | Missense_Mutation | c.648N>G | p.Ser216Arg | p.S216R | Q96D70 | protein_coding | deleterious(0.04) | benign(0.003) | TCGA-CM-4752-01 | Colorectum | colon adenocarcinoma | Male | <65 | I/II | Unknown | Unknown | SD | |
| R3HDM4 | SNV | Missense_Mutation | novel | c.649N>A | p.Phe217Ile | p.F217I | Q96D70 | protein_coding | deleterious(0) | benign(0.104) | TCGA-CM-5341-01 | Colorectum | colon adenocarcinoma | Female | >=65 | III/IV | Chemotherapy | fluorouracil | SD |
| R3HDM4 | SNV | Missense_Mutation | c.119G>A | p.Arg40Lys | p.R40K | Q96D70 | protein_coding | tolerated(0.17) | benign(0.092) | TCGA-CM-6680-01 | Colorectum | colon adenocarcinoma | Female | >=65 | III/IV | Unknown | Unknown | SD | |
| R3HDM4 | SNV | Missense_Mutation | rs768386258 | c.784N>A | p.Ala262Thr | p.A262T | Q96D70 | protein_coding | tolerated(0.14) | benign(0.422) | TCGA-NH-A5IV-01 | Colorectum | colon adenocarcinoma | Female | >=65 | I/II | Unknown | Unknown | SD |
| R3HDM4 | SNV | Missense_Mutation | rs537357318 | c.524N>A | p.Arg175His | p.R175H | Q96D70 | protein_coding | deleterious(0.01) | benign(0.069) | TCGA-WS-AB45-01 | Colorectum | colon adenocarcinoma | Female | <65 | I/II | Unknown | Unknown | SD |
| R3HDM4 | SNV | Missense_Mutation | novel | c.194N>G | p.Lys65Arg | p.K65R | Q96D70 | protein_coding | tolerated(0.08) | probably_damaging(0.984) | TCGA-A5-A1OF-01 | Endometrium | uterine corpus endometrioid carcinoma | Female | <65 | I/II | Unknown | Unknown | SD |
| Page: 1 2 3 |
Top |
Related drugs of malignant transformation related genes |
| Identification of chemicals and drugs interact with genes involved in malignant transfromation |
| (DGIdb 4.0) |
| Entrez ID | Symbol | Category | Interaction Types | Drug Claim Name | Drug Name | PMIDs |
| Page: 1 |

Copyright 2023-Present -The University of Texas Health Science Center at Houston |