
|
|||||
|
 | |
| |
| |
| |
| |
| |
|
Gene: R3HCC1L |
Gene summary for R3HCC1L |
| Gene information | Species | Human | Gene symbol | R3HCC1L | Gene ID | 27291 |
| Gene name | R3H domain and coiled-coil containing 1 like | |
| Gene Alias | C10orf28 | |
| Cytomap | 10q24.2 | |
| Gene Type | protein-coding | GO ID | GO:0003674 | UniProtAcc | D3DR60 |
Top |
Malignant transformation analysis |
| Identification of the aberrant gene expression in precancerous and cancerous lesions by comparing the gene expression of stem-like cells in diseased tissues with normal stem cells |
| Entrez ID | Symbol | Replicates | Species | Organ | Tissue | Adj P-value | Log2FC | Malignancy |
| 27291 | R3HCC1L | HTA11_3410_2000001011 | Human | Colorectum | AD | 1.99e-09 | -4.81e-01 | 0.0155 |
| 27291 | R3HCC1L | HTA11_696_2000001011 | Human | Colorectum | AD | 3.86e-06 | -3.30e-01 | -0.1464 |
| 27291 | R3HCC1L | HTA11_866_3004761011 | Human | Colorectum | AD | 1.62e-06 | -4.41e-01 | 0.096 |
| 27291 | R3HCC1L | HTA11_10711_2000001011 | Human | Colorectum | AD | 7.56e-03 | -4.32e-01 | 0.0338 |
| 27291 | R3HCC1L | HTA11_7696_3000711011 | Human | Colorectum | AD | 1.85e-11 | -4.22e-01 | 0.0674 |
| 27291 | R3HCC1L | HTA11_99999970781_79442 | Human | Colorectum | MSS | 3.10e-12 | -4.32e-01 | 0.294 |
| 27291 | R3HCC1L | HTA11_99999971662_82457 | Human | Colorectum | MSS | 7.87e-06 | -3.81e-01 | 0.3859 |
| 27291 | R3HCC1L | HTA11_99999973899_84307 | Human | Colorectum | MSS | 1.94e-02 | -4.99e-01 | 0.2585 |
| 27291 | R3HCC1L | HTA11_99999974143_84620 | Human | Colorectum | MSS | 2.04e-12 | -4.79e-01 | 0.3005 |
| 27291 | R3HCC1L | A002-C-010 | Human | Colorectum | FAP | 8.31e-03 | -1.05e-01 | 0.242 |
| 27291 | R3HCC1L | A015-C-203 | Human | Colorectum | FAP | 6.84e-18 | -3.55e-01 | -0.1294 |
| 27291 | R3HCC1L | A015-C-204 | Human | Colorectum | FAP | 1.75e-05 | -3.18e-01 | -0.0228 |
| 27291 | R3HCC1L | A014-C-040 | Human | Colorectum | FAP | 2.62e-02 | -3.60e-01 | -0.1184 |
| 27291 | R3HCC1L | A002-C-201 | Human | Colorectum | FAP | 6.54e-09 | -2.47e-01 | 0.0324 |
| 27291 | R3HCC1L | A002-C-203 | Human | Colorectum | FAP | 8.24e-04 | -1.08e-01 | 0.2786 |
| 27291 | R3HCC1L | A001-C-119 | Human | Colorectum | FAP | 3.54e-12 | -5.54e-01 | -0.1557 |
| 27291 | R3HCC1L | A001-C-108 | Human | Colorectum | FAP | 1.80e-10 | -2.74e-01 | -0.0272 |
| 27291 | R3HCC1L | A002-C-205 | Human | Colorectum | FAP | 4.97e-18 | -4.19e-01 | -0.1236 |
| 27291 | R3HCC1L | A001-C-104 | Human | Colorectum | FAP | 1.50e-04 | -2.78e-01 | 0.0184 |
| 27291 | R3HCC1L | A015-C-005 | Human | Colorectum | FAP | 3.24e-03 | -2.14e-01 | -0.0336 |
| Page: 1 2 3 4 5 |
| Tissue | Expression Dynamics | Abbreviation |
| Colorectum (GSE201348) |  | FAP: Familial adenomatous polyposis |
| CRC: Colorectal cancer | ||
| Colorectum (HTA11) |  | AD: Adenomas |
| SER: Sessile serrated lesions | ||
| MSI-H: Microsatellite-high colorectal cancer | ||
| MSS: Microsatellite stable colorectal cancer | ||
| Esophagus | 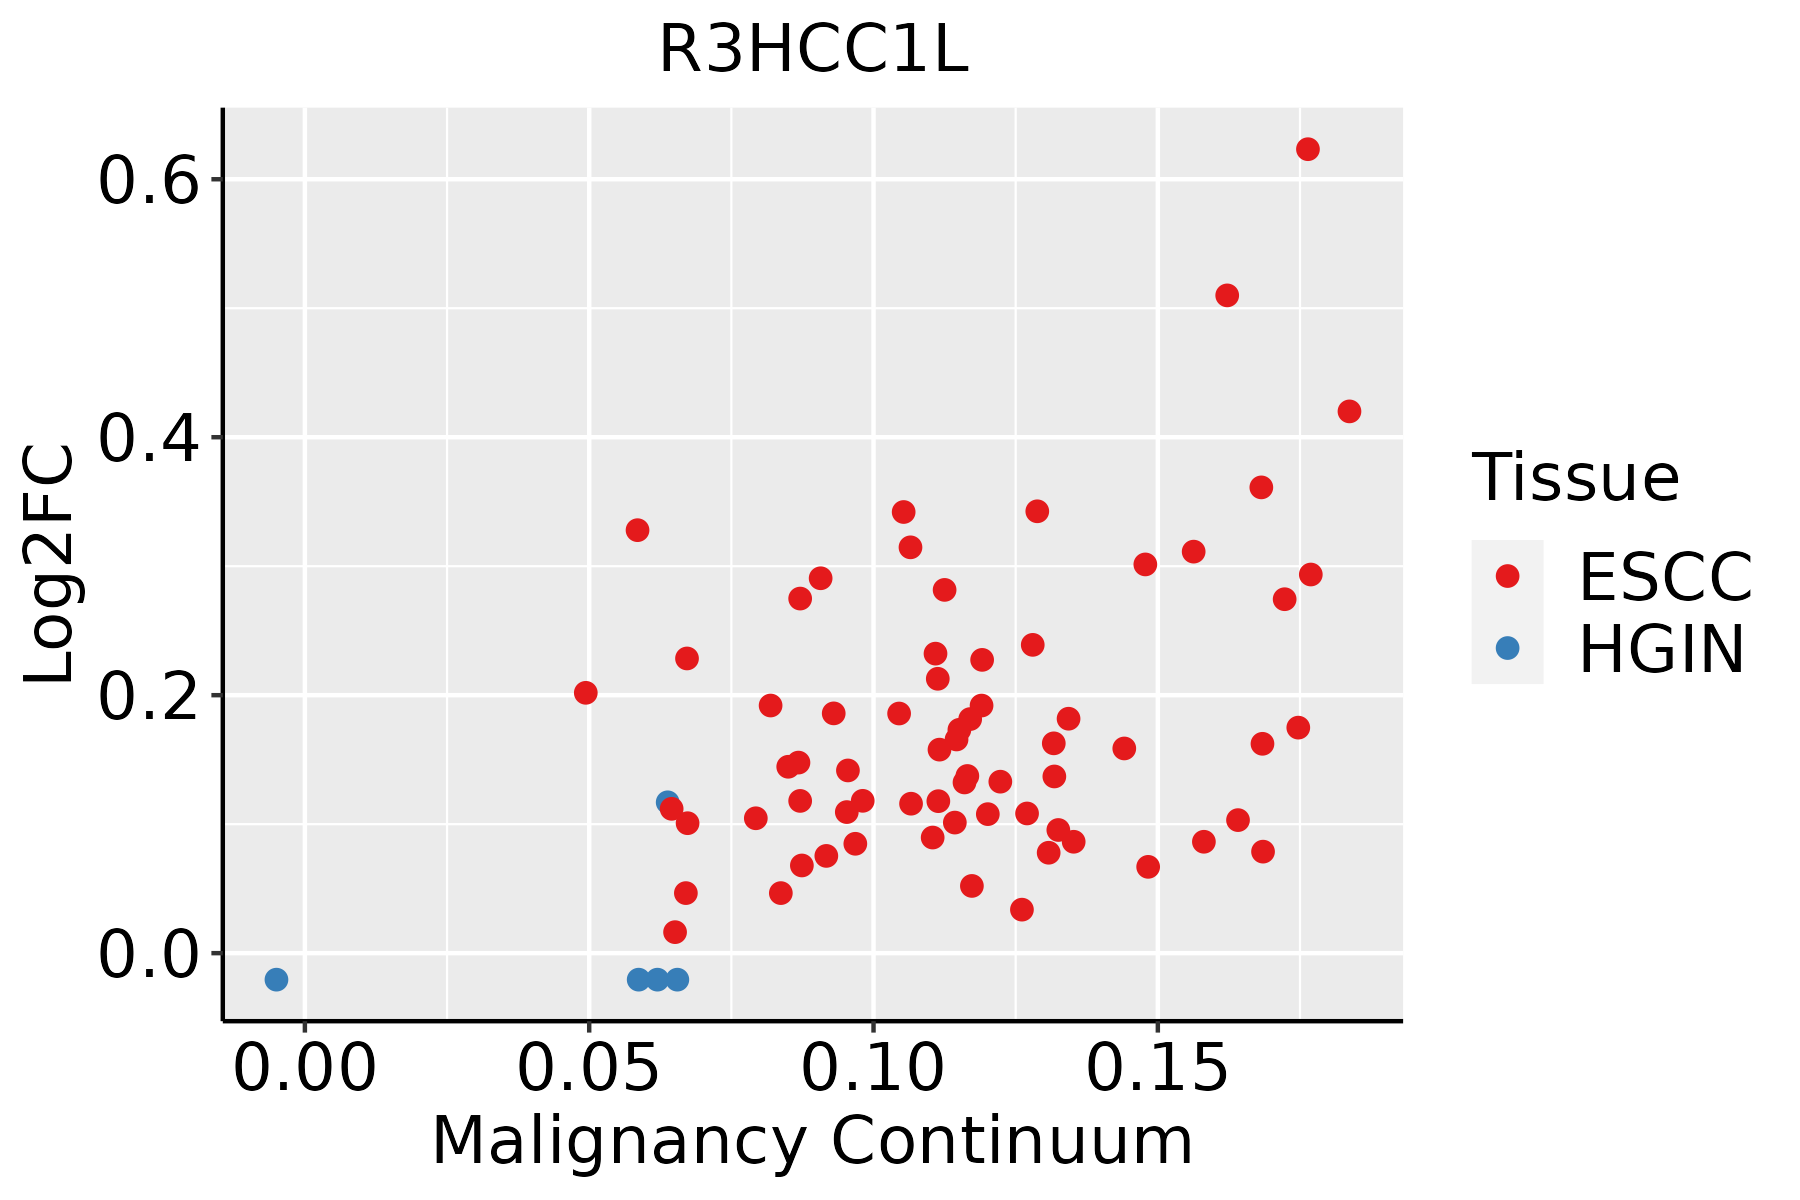 | ESCC: Esophageal squamous cell carcinoma |
| HGIN: High-grade intraepithelial neoplasias | ||
| LGIN: Low-grade intraepithelial neoplasias |
| ∗log2FC in expression of this searched gene in stem-like cells from each diseased tissue sample relative to stem-like cells in normal samples in each tissue plotted against the malignancy continuum. Samples are colored based on if they are from different disease stage. |
Top |
Malignant transformation related pathway analysis |
| Find out the enriched GO biological processes and KEGG pathways involved in transition from healthy to precancer to cancer |
| Tissue | Disease Stage | Enriched GO biological Processes |
| Colorectum | AD |  |
| Colorectum | SER |  |
| Colorectum | MSS |  |
| Colorectum | MSI-H |  |
| Colorectum | FAP |  |
| ∗Top 15 enriched GO BP terms are showed in the bar plot of each disease state in each tissue. Each row represents a significant GO biological process which is colored according to the -log10(p.adjust). |
| Page: 1 2 3 4 5 6 7 8 9 |
| GO ID | Tissue | Disease Stage | Description | Gene Ratio | Bg Ratio | pvalue | p.adjust | Count |
| Page: 1 |
| Pathway ID | Tissue | Disease Stage | Description | Gene Ratio | Bg Ratio | pvalue | p.adjust | qvalue | Count |
| Page: 1 |
Top |
Cell-cell communication analysis |
| Identification of potential cell-cell interactions between two cell types and their ligand-receptor pairs for different disease states |
| Ligand | Receptor | LRpair | Pathway | Tissue | Disease Stage |
| Page: 1 |
Top |
Single-cell gene regulatory network inference analysis |
| Find out the significant the regulons (TFs) and the target genes of each regulon across cell types for different disease states |
| TF | Cell Type | Tissue | Disease Stage | Target Gene | RSS | Regulon Activity |
| ∗The dot plots of a searched regulon are shown for all cell subpopulations in each disease state of each tissue based on the regulon specific score inferred using pySCENIC and by calculating the average expression. |
| Page: 1 |
Top |
Somatic mutation of malignant transformation related genes |
| Annotation of somatic variants for genes involved in malignant transformation |
| Hugo Symbol | Variant Class | Variant Classification | dbSNP RS | HGVSc | HGVSp | HGVSp Short | SWISSPROT | BIOTYPE | SIFT | PolyPhen | Tumor Sample Barcode | Tissue | Histology | Sex | Age | Stage | Therapy Types | Drugs | Outcome |
| R3HCC1L | SNV | Missense_Mutation | rs369451185 | c.1447N>C | p.Tyr483His | p.Y483H | protein_coding | tolerated(0.16) | benign(0.013) | TCGA-A8-A09Z-01 | Breast | breast invasive carcinoma | Female | >=65 | I/II | Unknown | Unknown | SD | |
| R3HCC1L | SNV | Missense_Mutation | novel | c.859N>A | p.Glu287Lys | p.E287K | protein_coding | tolerated(0.12) | benign(0.104) | TCGA-B6-A3ZX-01 | Breast | breast invasive carcinoma | Female | <65 | III/IV | Chemotherapy | cyclophosphamide | PD | |
| R3HCC1L | SNV | Missense_Mutation | c.2044N>A | p.Ala682Thr | p.A682T | protein_coding | deleterious(0) | probably_damaging(1) | TCGA-BH-A18V-01 | Breast | breast invasive carcinoma | Female | <65 | I/II | Unknown | Unknown | SD | ||
| R3HCC1L | SNV | Missense_Mutation | c.1504N>A | p.Asp502Asn | p.D502N | protein_coding | tolerated(0.17) | benign(0.007) | TCGA-IR-A3LK-01 | Cervix | cervical & endocervical cancer | Female | >=65 | I/II | Chemotherapy | cisplatin | PD | ||
| R3HCC1L | SNV | Missense_Mutation | novel | c.808C>G | p.Pro270Ala | p.P270A | protein_coding | tolerated(0.15) | benign(0.287) | TCGA-VS-AA62-01 | Cervix | cervical & endocervical cancer | Female | <65 | I/II | Chemotherapy | cisplatin | PD | |
| R3HCC1L | SNV | Missense_Mutation | c.1966N>T | p.His656Tyr | p.H656Y | protein_coding | deleterious(0) | benign(0.017) | TCGA-AA-3977-01 | Colorectum | colon adenocarcinoma | Male | >=65 | I/II | Unknown | Unknown | SD | ||
| R3HCC1L | SNV | Missense_Mutation | novel | c.258N>T | p.Lys86Asn | p.K86N | protein_coding | deleterious(0) | possibly_damaging(0.885) | TCGA-AA-3984-01 | Colorectum | colon adenocarcinoma | Female | <65 | I/II | Unknown | Unknown | SD | |
| R3HCC1L | SNV | Missense_Mutation | c.1960G>A | p.Glu654Lys | p.E654K | protein_coding | deleterious(0.02) | probably_damaging(0.987) | TCGA-AD-6964-01 | Colorectum | colon adenocarcinoma | Male | <65 | III/IV | Chemotherapy | folfox | PD | ||
| R3HCC1L | SNV | Missense_Mutation | novel | c.744A>C | p.Gln248His | p.Q248H | protein_coding | deleterious(0) | benign(0.067) | TCGA-AZ-4315-01 | Colorectum | colon adenocarcinoma | Male | <65 | I/II | Unknown | Unknown | SD | |
| R3HCC1L | SNV | Missense_Mutation | rs373657280 | c.206N>A | p.Arg69Gln | p.R69Q | protein_coding | tolerated(1) | benign(0) | TCGA-CA-6717-01 | Colorectum | colon adenocarcinoma | Male | <65 | I/II | Chemotherapy | oxaliplatin | CR |
| Page: 1 2 3 4 5 6 7 8 9 10 |
Top |
Related drugs of malignant transformation related genes |
| Identification of chemicals and drugs interact with genes involved in malignant transfromation |
| (DGIdb 4.0) |
| Entrez ID | Symbol | Category | Interaction Types | Drug Claim Name | Drug Name | PMIDs |
| Page: 1 |

Copyright 2023-Present -The University of Texas Health Science Center at Houston |