
|
|||||
|
 | |
| |
| |
| |
| |
| |
|
Gene: R3HCC1 |
Gene summary for R3HCC1 |
| Gene information | Species | Human | Gene symbol | R3HCC1 | Gene ID | 203069 |
| Gene name | R3H domain and coiled-coil containing 1 | |
| Gene Alias | R3HCC1 | |
| Cytomap | 8p21.3 | |
| Gene Type | protein-coding | GO ID | GO:0003674 | UniProtAcc | Q9Y3T6 |
Top |
Malignant transformation analysis |
| Identification of the aberrant gene expression in precancerous and cancerous lesions by comparing the gene expression of stem-like cells in diseased tissues with normal stem cells |
| Entrez ID | Symbol | Replicates | Species | Organ | Tissue | Adj P-value | Log2FC | Malignancy |
| 203069 | R3HCC1 | LZE4T | Human | Esophagus | ESCC | 6.03e-05 | 2.72e-01 | 0.0811 |
| 203069 | R3HCC1 | LZE7T | Human | Esophagus | ESCC | 7.52e-04 | 2.39e-01 | 0.0667 |
| 203069 | R3HCC1 | LZE8T | Human | Esophagus | ESCC | 1.41e-04 | 1.55e-01 | 0.067 |
| 203069 | R3HCC1 | LZE24T | Human | Esophagus | ESCC | 7.09e-08 | 3.16e-01 | 0.0596 |
| 203069 | R3HCC1 | LZE21T | Human | Esophagus | ESCC | 4.02e-03 | 2.32e-01 | 0.0655 |
| 203069 | R3HCC1 | LZE6T | Human | Esophagus | ESCC | 5.22e-09 | 2.81e-01 | 0.0845 |
| 203069 | R3HCC1 | P1T-E | Human | Esophagus | ESCC | 6.20e-08 | 3.53e-01 | 0.0875 |
| 203069 | R3HCC1 | P2T-E | Human | Esophagus | ESCC | 1.46e-34 | 6.63e-01 | 0.1177 |
| 203069 | R3HCC1 | P4T-E | Human | Esophagus | ESCC | 9.33e-20 | 5.40e-01 | 0.1323 |
| 203069 | R3HCC1 | P5T-E | Human | Esophagus | ESCC | 1.02e-13 | 2.22e-01 | 0.1327 |
| 203069 | R3HCC1 | P8T-E | Human | Esophagus | ESCC | 9.34e-19 | 3.60e-01 | 0.0889 |
| 203069 | R3HCC1 | P9T-E | Human | Esophagus | ESCC | 1.45e-14 | 1.57e-01 | 0.1131 |
| 203069 | R3HCC1 | P10T-E | Human | Esophagus | ESCC | 2.12e-26 | 4.60e-01 | 0.116 |
| 203069 | R3HCC1 | P11T-E | Human | Esophagus | ESCC | 2.88e-12 | 3.70e-01 | 0.1426 |
| 203069 | R3HCC1 | P12T-E | Human | Esophagus | ESCC | 3.48e-19 | 4.26e-01 | 0.1122 |
| 203069 | R3HCC1 | P15T-E | Human | Esophagus | ESCC | 4.92e-07 | 1.86e-01 | 0.1149 |
| 203069 | R3HCC1 | P16T-E | Human | Esophagus | ESCC | 4.53e-27 | 4.82e-01 | 0.1153 |
| 203069 | R3HCC1 | P17T-E | Human | Esophagus | ESCC | 2.45e-09 | 3.42e-01 | 0.1278 |
| 203069 | R3HCC1 | P19T-E | Human | Esophagus | ESCC | 1.25e-05 | 6.52e-01 | 0.1662 |
| 203069 | R3HCC1 | P20T-E | Human | Esophagus | ESCC | 1.36e-19 | 4.23e-01 | 0.1124 |
| Page: 1 2 3 4 5 |
| Tissue | Expression Dynamics | Abbreviation |
| Esophagus | 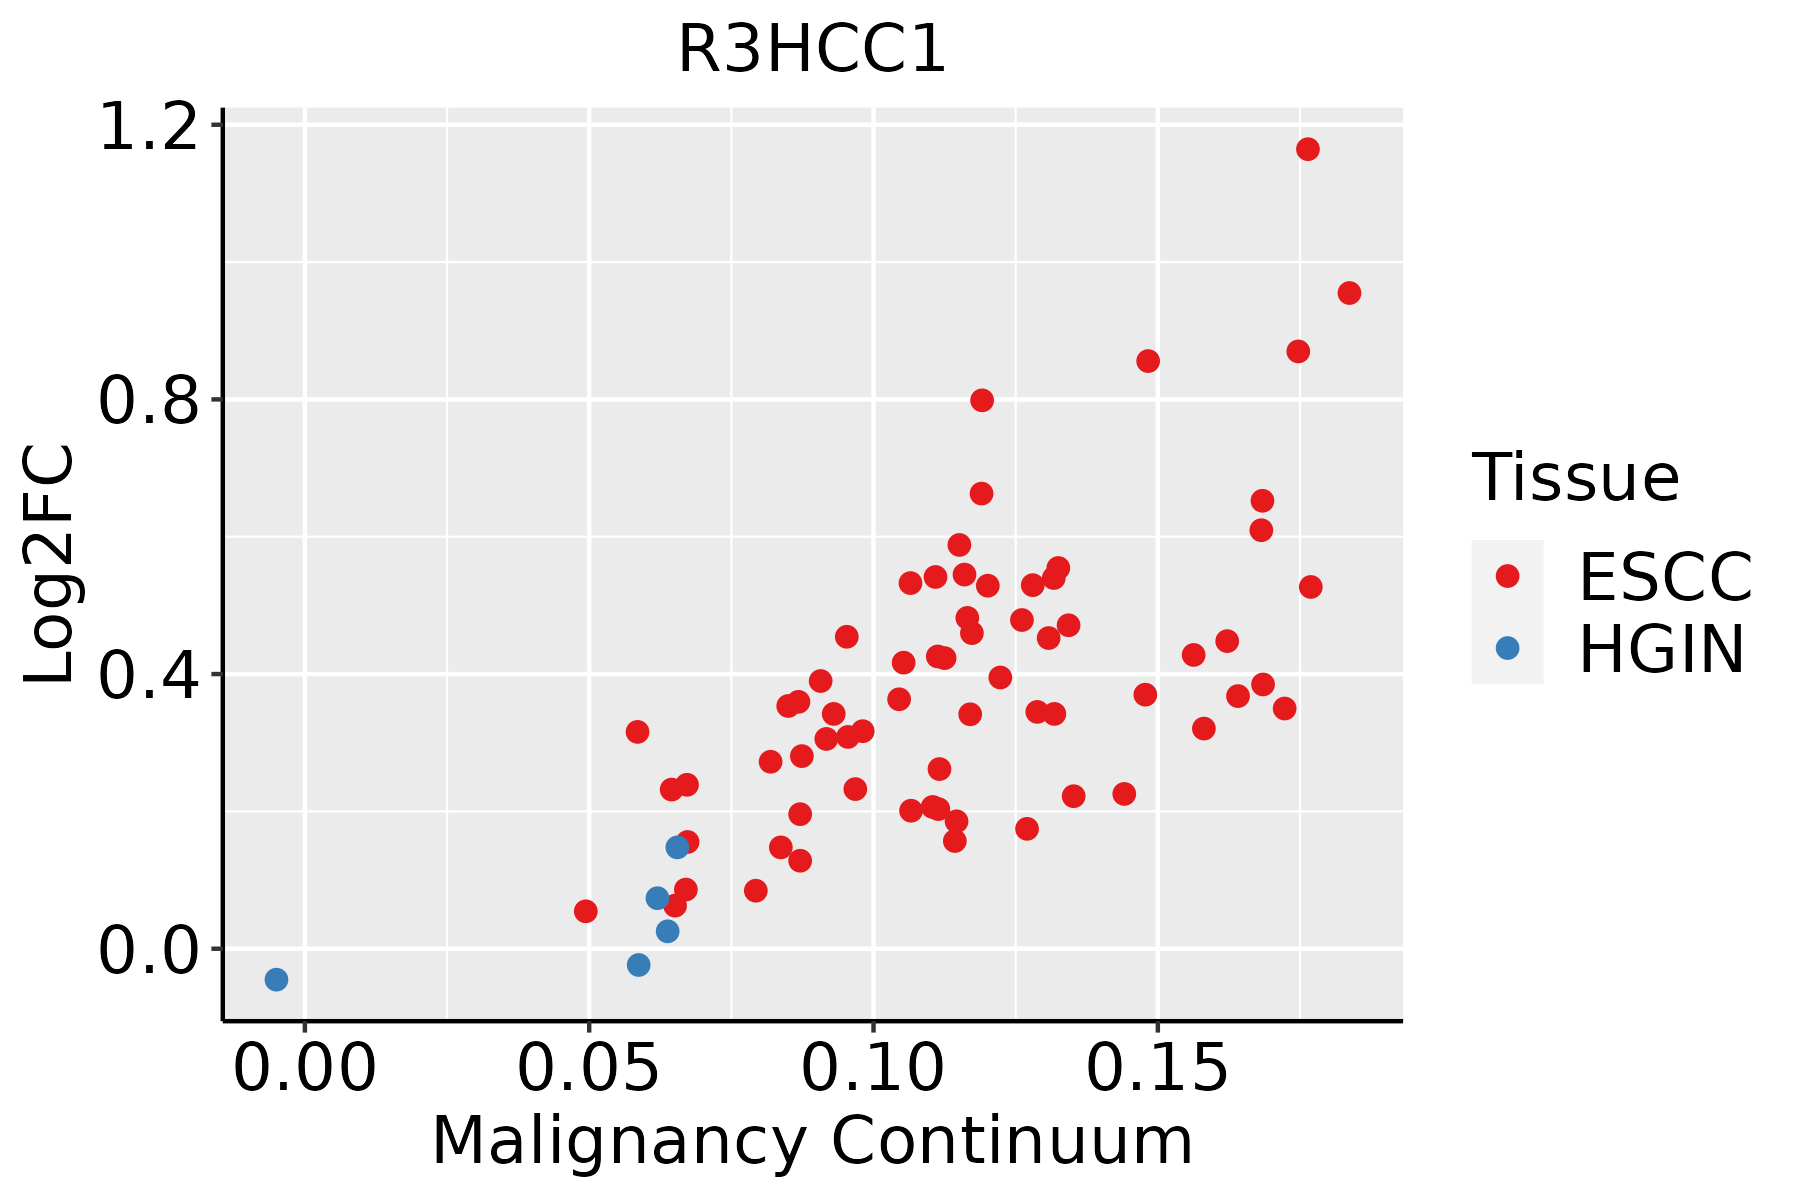 | ESCC: Esophageal squamous cell carcinoma |
| HGIN: High-grade intraepithelial neoplasias | ||
| LGIN: Low-grade intraepithelial neoplasias | ||
| Oral Cavity |  | EOLP: Erosive Oral lichen planus |
| LP: leukoplakia | ||
| NEOLP: Non-erosive oral lichen planus | ||
| OSCC: Oral squamous cell carcinoma | ||
| Skin |  | AK: Actinic keratosis |
| cSCC: Cutaneous squamous cell carcinoma | ||
| SCCIS:squamous cell carcinoma in situ |
| ∗log2FC in expression of this searched gene in stem-like cells from each diseased tissue sample relative to stem-like cells in normal samples in each tissue plotted against the malignancy continuum. Samples are colored based on if they are from different disease stage. |
Top |
Malignant transformation related pathway analysis |
| Find out the enriched GO biological processes and KEGG pathways involved in transition from healthy to precancer to cancer |
| Tissue | Disease Stage | Enriched GO biological Processes |
| Colorectum | AD |  |
| Colorectum | SER |  |
| Colorectum | MSS |  |
| Colorectum | MSI-H |  |
| Colorectum | FAP |  |
| ∗Top 15 enriched GO BP terms are showed in the bar plot of each disease state in each tissue. Each row represents a significant GO biological process which is colored according to the -log10(p.adjust). |
| Page: 1 2 3 4 5 6 7 8 9 |
| GO ID | Tissue | Disease Stage | Description | Gene Ratio | Bg Ratio | pvalue | p.adjust | Count |
| Page: 1 |
| Pathway ID | Tissue | Disease Stage | Description | Gene Ratio | Bg Ratio | pvalue | p.adjust | qvalue | Count |
| Page: 1 |
Top |
Cell-cell communication analysis |
| Identification of potential cell-cell interactions between two cell types and their ligand-receptor pairs for different disease states |
| Ligand | Receptor | LRpair | Pathway | Tissue | Disease Stage |
| Page: 1 |
Top |
Single-cell gene regulatory network inference analysis |
| Find out the significant the regulons (TFs) and the target genes of each regulon across cell types for different disease states |
| TF | Cell Type | Tissue | Disease Stage | Target Gene | RSS | Regulon Activity |
| ∗The dot plots of a searched regulon are shown for all cell subpopulations in each disease state of each tissue based on the regulon specific score inferred using pySCENIC and by calculating the average expression. |
| Page: 1 |
Top |
Somatic mutation of malignant transformation related genes |
| Annotation of somatic variants for genes involved in malignant transformation |
| Hugo Symbol | Variant Class | Variant Classification | dbSNP RS | HGVSc | HGVSp | HGVSp Short | SWISSPROT | BIOTYPE | SIFT | PolyPhen | Tumor Sample Barcode | Tissue | Histology | Sex | Age | Stage | Therapy Types | Drugs | Outcome |
| R3HCC1 | SNV | Missense_Mutation | novel | c.1029N>T | p.Glu343Asp | p.E343D | protein_coding | tolerated(0.11) | benign(0.07) | TCGA-AN-A046-01 | Breast | breast invasive carcinoma | Female | >=65 | I/II | Unknown | Unknown | SD | |
| R3HCC1 | insertion | Frame_Shift_Ins | novel | c.934_935insTGGGTTCAGTTGGGAGGGTGGCATCTTTTATGGCTATTTTATACAT | p.Gly312ValfsTer28 | p.G312Vfs*28 | protein_coding | TCGA-B6-A0IN-01 | Breast | breast invasive carcinoma | Female | <65 | I/II | Unknown | Unknown | PD | |||
| R3HCC1 | SNV | Missense_Mutation | novel | c.260N>T | p.Ser87Leu | p.S87L | protein_coding | tolerated(0.16) | benign(0.165) | TCGA-2W-A8YY-01 | Cervix | cervical & endocervical cancer | Female | <65 | I/II | Chemotherapy | cisplatin | CR | |
| R3HCC1 | SNV | Missense_Mutation | rs758791727 | c.955N>A | p.Val319Met | p.V319M | protein_coding | deleterious(0) | probably_damaging(0.931) | TCGA-2W-A8YY-01 | Cervix | cervical & endocervical cancer | Female | <65 | I/II | Chemotherapy | cisplatin | CR | |
| R3HCC1 | SNV | Missense_Mutation | c.935N>C | p.Gly312Ala | p.G312A | protein_coding | tolerated(0.06) | benign(0.019) | TCGA-IR-A3LH-01 | Cervix | cervical & endocervical cancer | Female | <65 | I/II | Chemotherapy | cisplatin | CR | ||
| R3HCC1 | SNV | Missense_Mutation | rs375081566 | c.1066G>A | p.Ala356Thr | p.A356T | protein_coding | deleterious(0) | probably_damaging(0.996) | TCGA-AM-5821-01 | Colorectum | colon adenocarcinoma | Female | >=65 | I/II | Unknown | Unknown | SD | |
| R3HCC1 | SNV | Missense_Mutation | rs772503867 | c.1202N>A | p.Arg401His | p.R401H | protein_coding | tolerated(0.82) | benign(0.001) | TCGA-AY-6197-01 | Colorectum | colon adenocarcinoma | Male | <65 | I/II | Unknown | Unknown | SD | |
| R3HCC1 | SNV | Missense_Mutation | rs375081566 | c.1066N>A | p.Ala356Thr | p.A356T | protein_coding | deleterious(0) | probably_damaging(0.996) | TCGA-CK-5913-01 | Colorectum | colon adenocarcinoma | Female | <65 | I/II | Unknown | Unknown | SD | |
| R3HCC1 | SNV | Missense_Mutation | rs375766658 | c.784N>A | p.Glu262Lys | p.E262K | protein_coding | tolerated(0.11) | benign(0.005) | TCGA-AP-A0LM-01 | Endometrium | uterine corpus endometrioid carcinoma | Female | <65 | III/IV | Chemotherapy | cisplatin | SD | |
| R3HCC1 | SNV | Missense_Mutation | novel | c.143T>A | p.Leu48His | p.L48H | protein_coding | deleterious(0) | probably_damaging(0.998) | TCGA-AP-A1DK-01 | Endometrium | uterine corpus endometrioid carcinoma | Female | <65 | I/II | Unknown | Unknown | SD |
| Page: 1 2 3 |
Top |
Related drugs of malignant transformation related genes |
| Identification of chemicals and drugs interact with genes involved in malignant transfromation |
| (DGIdb 4.0) |
| Entrez ID | Symbol | Category | Interaction Types | Drug Claim Name | Drug Name | PMIDs |
| Page: 1 |

Copyright 2023-Present -The University of Texas Health Science Center at Houston |