
|
|||||
|
 | |
| |
| |
| |
| |
| |
|
Gene: QSOX2 |
Gene summary for QSOX2 |
| Gene information | Species | Human | Gene symbol | QSOX2 | Gene ID | 169714 |
| Gene name | quiescin sulfhydryl oxidase 2 | |
| Gene Alias | QSCN6L1 | |
| Cytomap | 9q34.3 | |
| Gene Type | protein-coding | GO ID | GO:0006457 | UniProtAcc | Q6ZRP7 |
Top |
Malignant transformation analysis |
| Identification of the aberrant gene expression in precancerous and cancerous lesions by comparing the gene expression of stem-like cells in diseased tissues with normal stem cells |
| Entrez ID | Symbol | Replicates | Species | Organ | Tissue | Adj P-value | Log2FC | Malignancy |
| 169714 | QSOX2 | C21 | Human | Oral cavity | OSCC | 8.28e-15 | 4.85e-01 | 0.2678 |
| 169714 | QSOX2 | C30 | Human | Oral cavity | OSCC | 2.97e-26 | 9.82e-01 | 0.3055 |
| 169714 | QSOX2 | C51 | Human | Oral cavity | OSCC | 4.87e-07 | 3.82e-01 | 0.2674 |
| 169714 | QSOX2 | C06 | Human | Oral cavity | OSCC | 3.83e-02 | 5.23e-01 | 0.2699 |
| 169714 | QSOX2 | C09 | Human | Oral cavity | OSCC | 1.29e-04 | 2.83e-01 | 0.1431 |
| 169714 | QSOX2 | SYSMH2 | Human | Oral cavity | OSCC | 7.87e-03 | 9.55e-02 | 0.2326 |
| 169714 | QSOX2 | SYSMH3 | Human | Oral cavity | OSCC | 4.63e-17 | 2.98e-01 | 0.2442 |
| Page: 1 |
| Tissue | Expression Dynamics | Abbreviation |
| Oral Cavity | 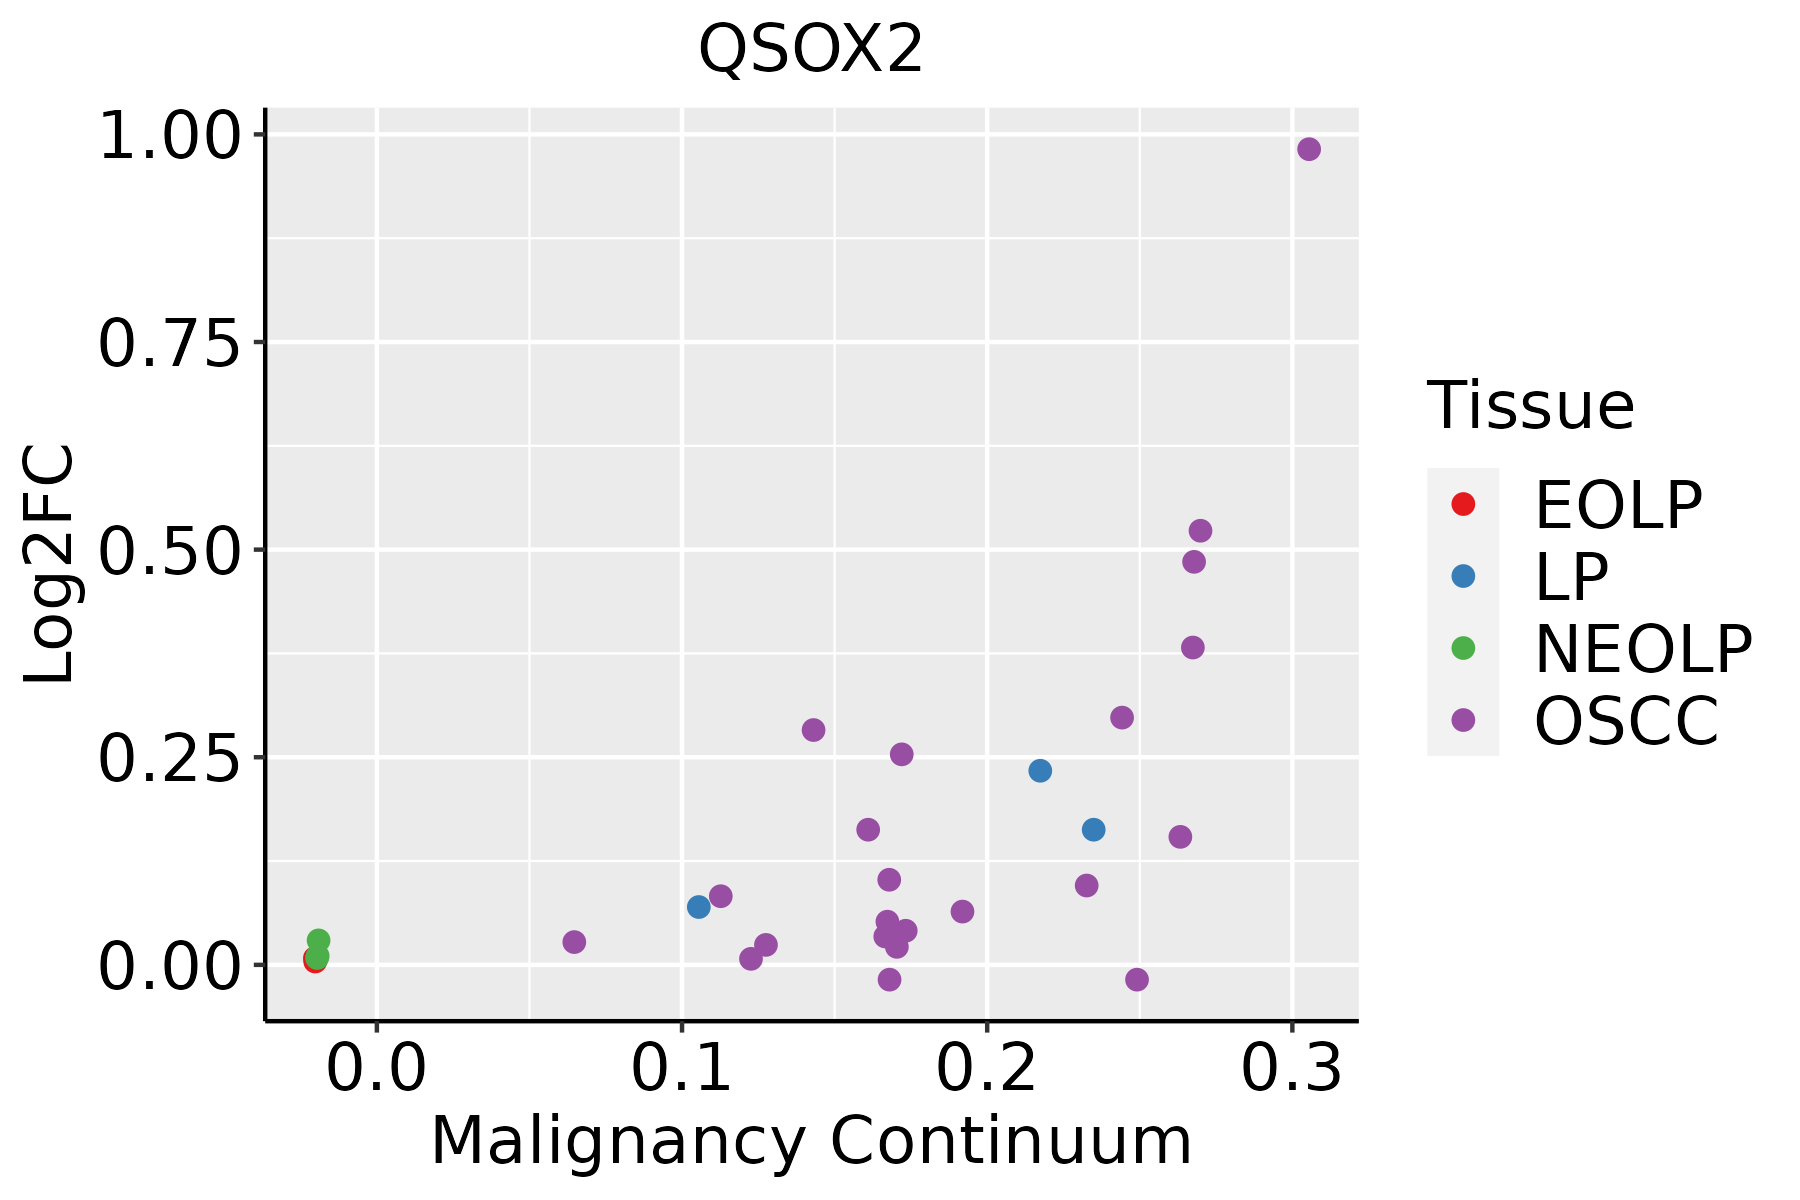 | EOLP: Erosive Oral lichen planus |
| LP: leukoplakia | ||
| NEOLP: Non-erosive oral lichen planus | ||
| OSCC: Oral squamous cell carcinoma |
| ∗log2FC in expression of this searched gene in stem-like cells from each diseased tissue sample relative to stem-like cells in normal samples in each tissue plotted against the malignancy continuum. Samples are colored based on if they are from different disease stage. |
Top |
Malignant transformation related pathway analysis |
| Find out the enriched GO biological processes and KEGG pathways involved in transition from healthy to precancer to cancer |
| Tissue | Disease Stage | Enriched GO biological Processes |
| Colorectum | AD |  |
| Colorectum | SER |  |
| Colorectum | MSS |  |
| Colorectum | MSI-H |  |
| Colorectum | FAP |  |
| ∗Top 15 enriched GO BP terms are showed in the bar plot of each disease state in each tissue. Each row represents a significant GO biological process which is colored according to the -log10(p.adjust). |
| Page: 1 2 3 4 5 6 7 8 9 |
| GO ID | Tissue | Disease Stage | Description | Gene Ratio | Bg Ratio | pvalue | p.adjust | Count |
| GO:000645718 | Oral cavity | OSCC | protein folding | 154/7305 | 212/18723 | 1.89e-23 | 4.60e-21 | 154 |
| Page: 1 |
| Pathway ID | Tissue | Disease Stage | Description | Gene Ratio | Bg Ratio | pvalue | p.adjust | qvalue | Count |
| Page: 1 |
Top |
Cell-cell communication analysis |
| Identification of potential cell-cell interactions between two cell types and their ligand-receptor pairs for different disease states |
| Ligand | Receptor | LRpair | Pathway | Tissue | Disease Stage |
| Page: 1 |
Top |
Single-cell gene regulatory network inference analysis |
| Find out the significant the regulons (TFs) and the target genes of each regulon across cell types for different disease states |
| TF | Cell Type | Tissue | Disease Stage | Target Gene | RSS | Regulon Activity |
| ∗The dot plots of a searched regulon are shown for all cell subpopulations in each disease state of each tissue based on the regulon specific score inferred using pySCENIC and by calculating the average expression. |
| Page: 1 |
Top |
Somatic mutation of malignant transformation related genes |
| Annotation of somatic variants for genes involved in malignant transformation |
| Hugo Symbol | Variant Class | Variant Classification | dbSNP RS | HGVSc | HGVSp | HGVSp Short | SWISSPROT | BIOTYPE | SIFT | PolyPhen | Tumor Sample Barcode | Tissue | Histology | Sex | Age | Stage | Therapy Types | Drugs | Outcome |
| QSOX2 | SNV | Missense_Mutation | rs780960010 | c.1660G>A | p.Val554Met | p.V554M | Q6ZRP7 | protein_coding | deleterious(0) | probably_damaging(0.998) | TCGA-A7-A26E-01 | Breast | breast invasive carcinoma | Female | >=65 | III/IV | Chemotherapy | cytoxan | SD |
| QSOX2 | SNV | Missense_Mutation | rs376098174 | c.631G>A | p.Val211Met | p.V211M | Q6ZRP7 | protein_coding | tolerated(0.15) | benign(0.081) | TCGA-LD-A7W6-01 | Breast | breast invasive carcinoma | Female | <65 | I/II | Chemotherapy | letrozole | SD |
| QSOX2 | insertion | Frame_Shift_Ins | novel | c.704_705insAGTCGCAGAGGAAACCGTGGCTAAAC | p.Ser235ArgfsTer13 | p.S235Rfs*13 | Q6ZRP7 | protein_coding | TCGA-A7-A0CE-01 | Breast | breast invasive carcinoma | Female | <65 | I/II | Chemotherapy | adriamycin | SD | ||
| QSOX2 | insertion | Nonsense_Mutation | novel | c.895_896insCAGTTTAAGGACAGCTCAC | p.Leu299SerfsTer3 | p.L299Sfs*3 | Q6ZRP7 | protein_coding | TCGA-AN-A0FV-01 | Breast | breast invasive carcinoma | Female | <65 | I/II | Unknown | Unknown | SD | ||
| QSOX2 | insertion | In_Frame_Ins | novel | c.460_461insGCTCCATGAAGAAGGCGGCCGTTAGACTCGTGT | p.Thr154delinsSerSerMetLysLysAlaAlaValArgLeuValSer | p.T154delinsSSMKKAAVRLVS | Q6ZRP7 | protein_coding | TCGA-BH-A0AY-01 | Breast | breast invasive carcinoma | Female | <65 | I/II | Chemotherapy | SD | |||
| QSOX2 | insertion | Frame_Shift_Ins | novel | c.425dupT | p.Arg143ProfsTer4 | p.R143Pfs*4 | Q6ZRP7 | protein_coding | TCGA-BH-A1FC-01 | Breast | breast invasive carcinoma | Female | >=65 | I/II | Unknown | Unknown | SD | ||
| QSOX2 | deletion | Frame_Shift_Del | novel | c.1676delA | p.Lys559SerfsTer10 | p.K559Sfs*10 | Q6ZRP7 | protein_coding | TCGA-EW-A2FV-01 | Breast | breast invasive carcinoma | Female | <65 | III/IV | Chemotherapy | docetaxel | SD | ||
| QSOX2 | SNV | Missense_Mutation | c.769N>T | p.Val257Phe | p.V257F | Q6ZRP7 | protein_coding | tolerated(0.6) | benign(0.061) | TCGA-EK-A2RN-01 | Cervix | cervical & endocervical cancer | Female | <65 | I/II | Unknown | Unknown | SD | |
| QSOX2 | SNV | Missense_Mutation | rs368735255 | c.1208N>A | p.Arg403Gln | p.R403Q | Q6ZRP7 | protein_coding | tolerated(0.1) | benign(0.03) | TCGA-JX-A5QV-01 | Cervix | cervical & endocervical cancer | Female | <65 | I/II | Unknown | Unknown | SD |
| QSOX2 | SNV | Missense_Mutation | c.1024N>T | p.His342Tyr | p.H342Y | Q6ZRP7 | protein_coding | deleterious(0) | possibly_damaging(0.791) | TCGA-VS-A9UO-01 | Cervix | cervical & endocervical cancer | Female | <65 | I/II | Chemotherapy | cisplatin | CR |
| Page: 1 2 3 4 5 6 7 8 |
Top |
Related drugs of malignant transformation related genes |
| Identification of chemicals and drugs interact with genes involved in malignant transfromation |
| (DGIdb 4.0) |
| Entrez ID | Symbol | Category | Interaction Types | Drug Claim Name | Drug Name | PMIDs |
| Page: 1 |

Copyright 2023-Present -The University of Texas Health Science Center at Houston |