
|
|||||
|
 | |
| |
| |
| |
| |
| |
|
Gene: QSOX1 |
Gene summary for QSOX1 |
| Gene information | Species | Human | Gene symbol | QSOX1 | Gene ID | 5768 |
| Gene name | quiescin sulfhydryl oxidase 1 | |
| Gene Alias | Q6 | |
| Cytomap | 1q25.2 | |
| Gene Type | protein-coding | GO ID | GO:0006457 | UniProtAcc | A0A140VKE5 |
Top |
Malignant transformation analysis |
| Identification of the aberrant gene expression in precancerous and cancerous lesions by comparing the gene expression of stem-like cells in diseased tissues with normal stem cells |
| Entrez ID | Symbol | Replicates | Species | Organ | Tissue | Adj P-value | Log2FC | Malignancy |
| 5768 | QSOX1 | HTA11_2487_2000001011 | Human | Colorectum | SER | 3.56e-10 | 9.68e-01 | -0.1808 |
| 5768 | QSOX1 | HTA11_1938_2000001011 | Human | Colorectum | AD | 4.01e-07 | 5.70e-01 | -0.0811 |
| 5768 | QSOX1 | HTA11_347_2000001011 | Human | Colorectum | AD | 5.56e-17 | 7.50e-01 | -0.1954 |
| 5768 | QSOX1 | HTA11_411_2000001011 | Human | Colorectum | SER | 4.94e-11 | 2.23e+00 | -0.2602 |
| 5768 | QSOX1 | HTA11_2112_2000001011 | Human | Colorectum | SER | 7.33e-08 | 1.52e+00 | -0.2196 |
| 5768 | QSOX1 | HTA11_696_2000001011 | Human | Colorectum | AD | 4.28e-19 | 7.72e-01 | -0.1464 |
| 5768 | QSOX1 | HTA11_1391_2000001011 | Human | Colorectum | AD | 2.15e-02 | 3.05e-01 | -0.059 |
| 5768 | QSOX1 | HTA11_2992_2000001011 | Human | Colorectum | SER | 7.87e-04 | 8.18e-01 | -0.1706 |
| 5768 | QSOX1 | HTA11_5212_2000001011 | Human | Colorectum | AD | 1.00e-03 | 6.67e-01 | -0.2061 |
| 5768 | QSOX1 | HTA11_7862_2000001011 | Human | Colorectum | AD | 6.50e-03 | 4.26e-01 | -0.0179 |
| 5768 | QSOX1 | HTA11_866_3004761011 | Human | Colorectum | AD | 7.23e-04 | 3.25e-01 | 0.096 |
| 5768 | QSOX1 | HTA11_7696_3000711011 | Human | Colorectum | AD | 1.21e-03 | 3.68e-01 | 0.0674 |
| 5768 | QSOX1 | HTA11_99999970781_79442 | Human | Colorectum | MSS | 3.24e-07 | 4.47e-01 | 0.294 |
| 5768 | QSOX1 | A015-C-203 | Human | Colorectum | FAP | 2.08e-05 | -1.19e-01 | -0.1294 |
| 5768 | QSOX1 | A002-C-205 | Human | Colorectum | FAP | 3.37e-05 | -1.49e-01 | -0.1236 |
| 5768 | QSOX1 | A002-C-114 | Human | Colorectum | FAP | 2.79e-02 | -1.30e-01 | -0.1561 |
| 5768 | QSOX1 | A015-C-104 | Human | Colorectum | FAP | 3.38e-05 | -1.51e-01 | -0.1899 |
| 5768 | QSOX1 | A002-C-016 | Human | Colorectum | FAP | 8.14e-06 | -9.67e-02 | 0.0521 |
| 5768 | QSOX1 | A001-C-203 | Human | Colorectum | FAP | 2.22e-02 | -1.15e-01 | -0.0481 |
| 5768 | QSOX1 | A002-C-116 | Human | Colorectum | FAP | 7.63e-06 | -1.34e-01 | -0.0452 |
| Page: 1 2 3 4 5 6 7 |
| Tissue | Expression Dynamics | Abbreviation |
| Colorectum (GSE201348) |  | FAP: Familial adenomatous polyposis |
| CRC: Colorectal cancer | ||
| Colorectum (HTA11) |  | AD: Adenomas |
| SER: Sessile serrated lesions | ||
| MSI-H: Microsatellite-high colorectal cancer | ||
| MSS: Microsatellite stable colorectal cancer | ||
| Esophagus |  | ESCC: Esophageal squamous cell carcinoma |
| HGIN: High-grade intraepithelial neoplasias | ||
| LGIN: Low-grade intraepithelial neoplasias | ||
| Liver | 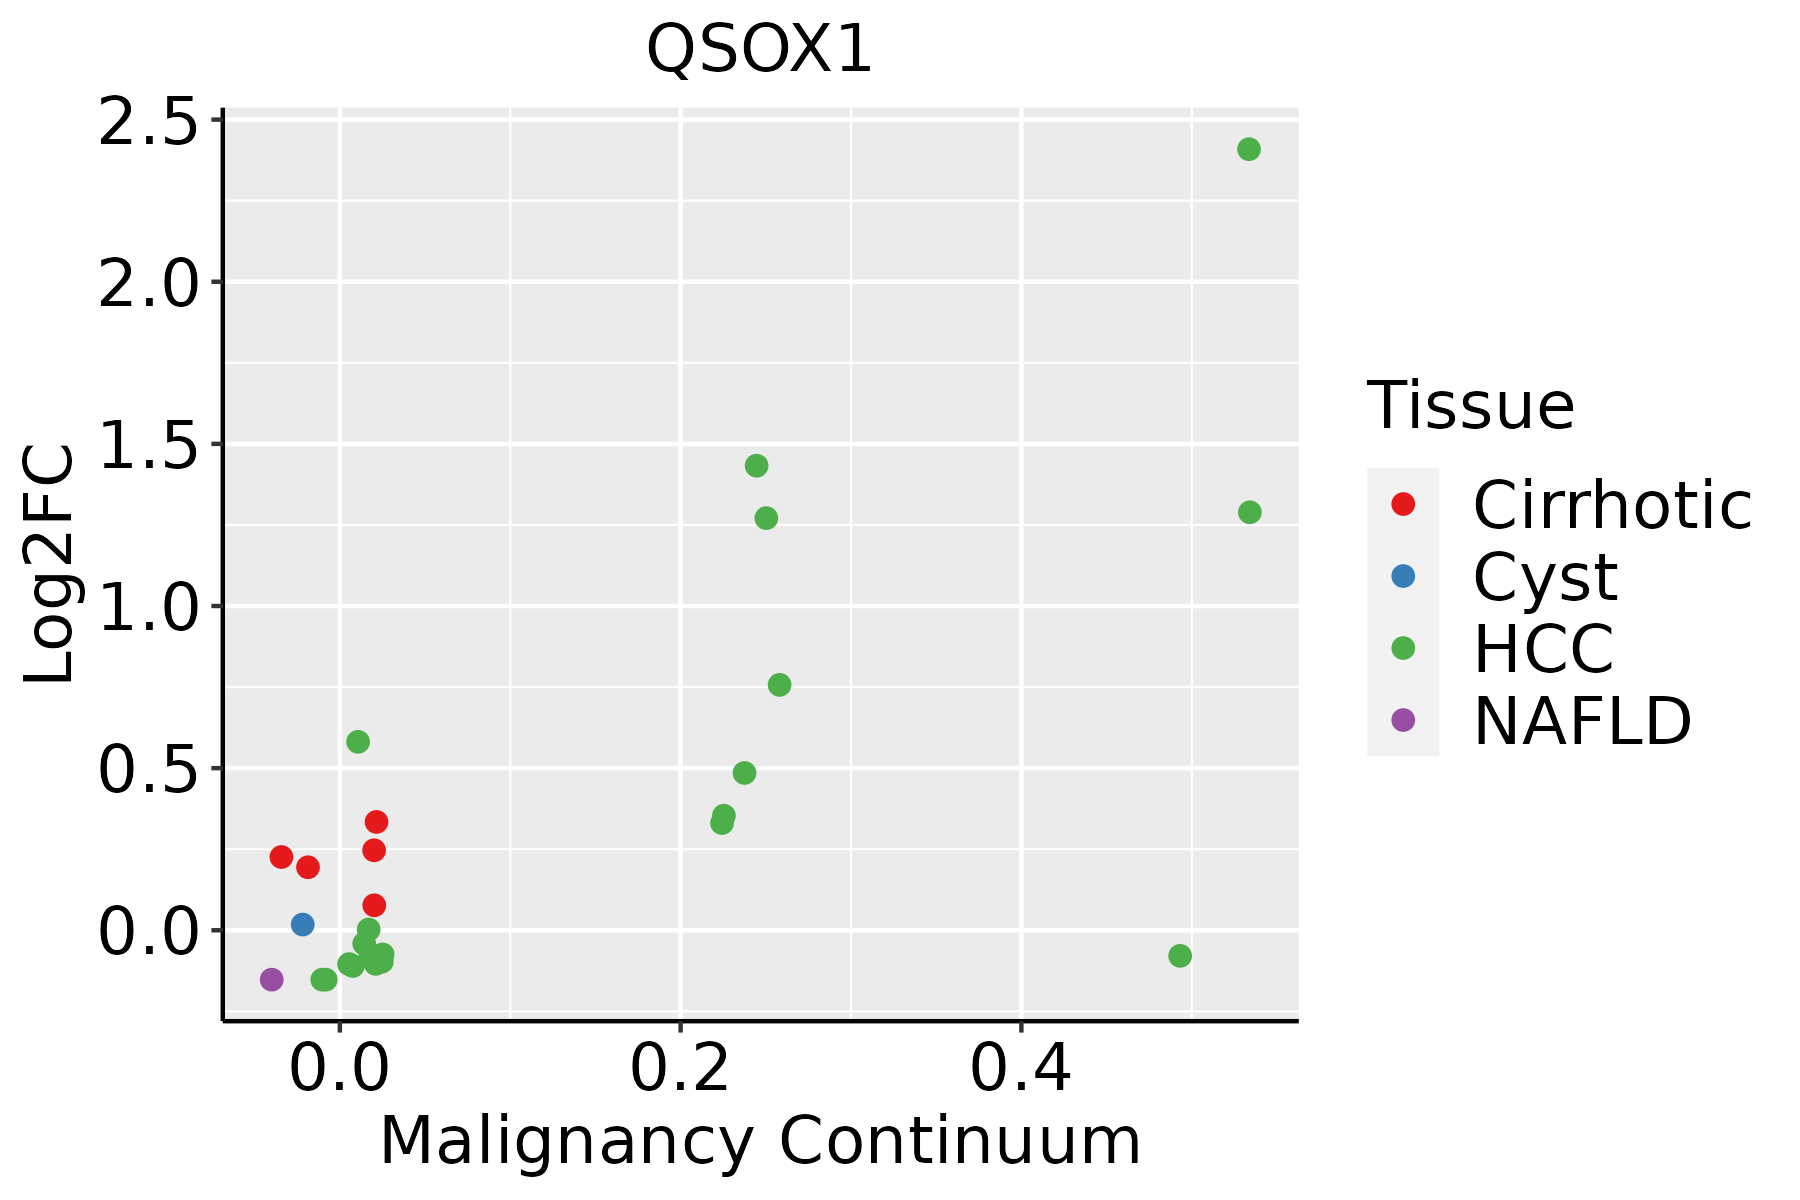 | HCC: Hepatocellular carcinoma |
| NAFLD: Non-alcoholic fatty liver disease | ||
| Oral Cavity | 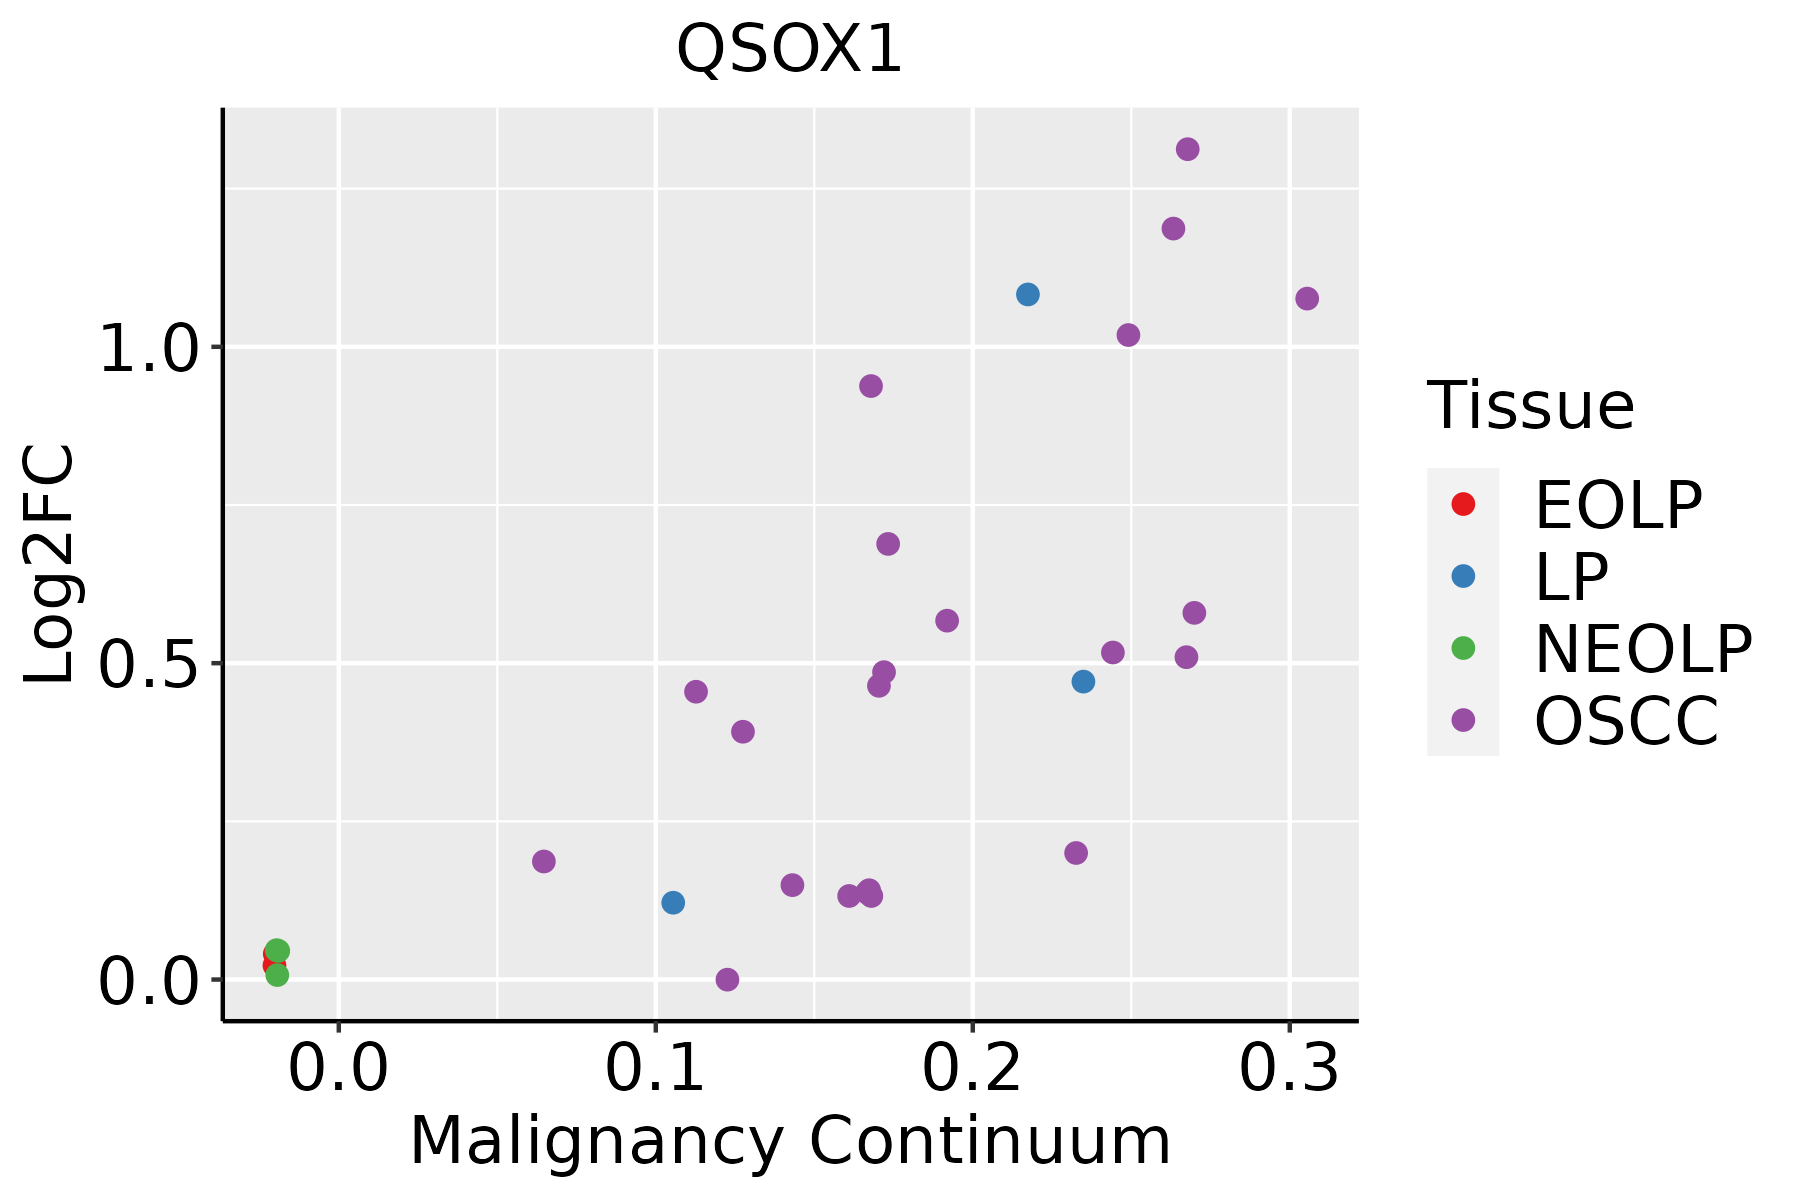 | EOLP: Erosive Oral lichen planus |
| LP: leukoplakia | ||
| NEOLP: Non-erosive oral lichen planus | ||
| OSCC: Oral squamous cell carcinoma | ||
| Skin |  | AK: Actinic keratosis |
| cSCC: Cutaneous squamous cell carcinoma | ||
| SCCIS:squamous cell carcinoma in situ | ||
| Thyroid | 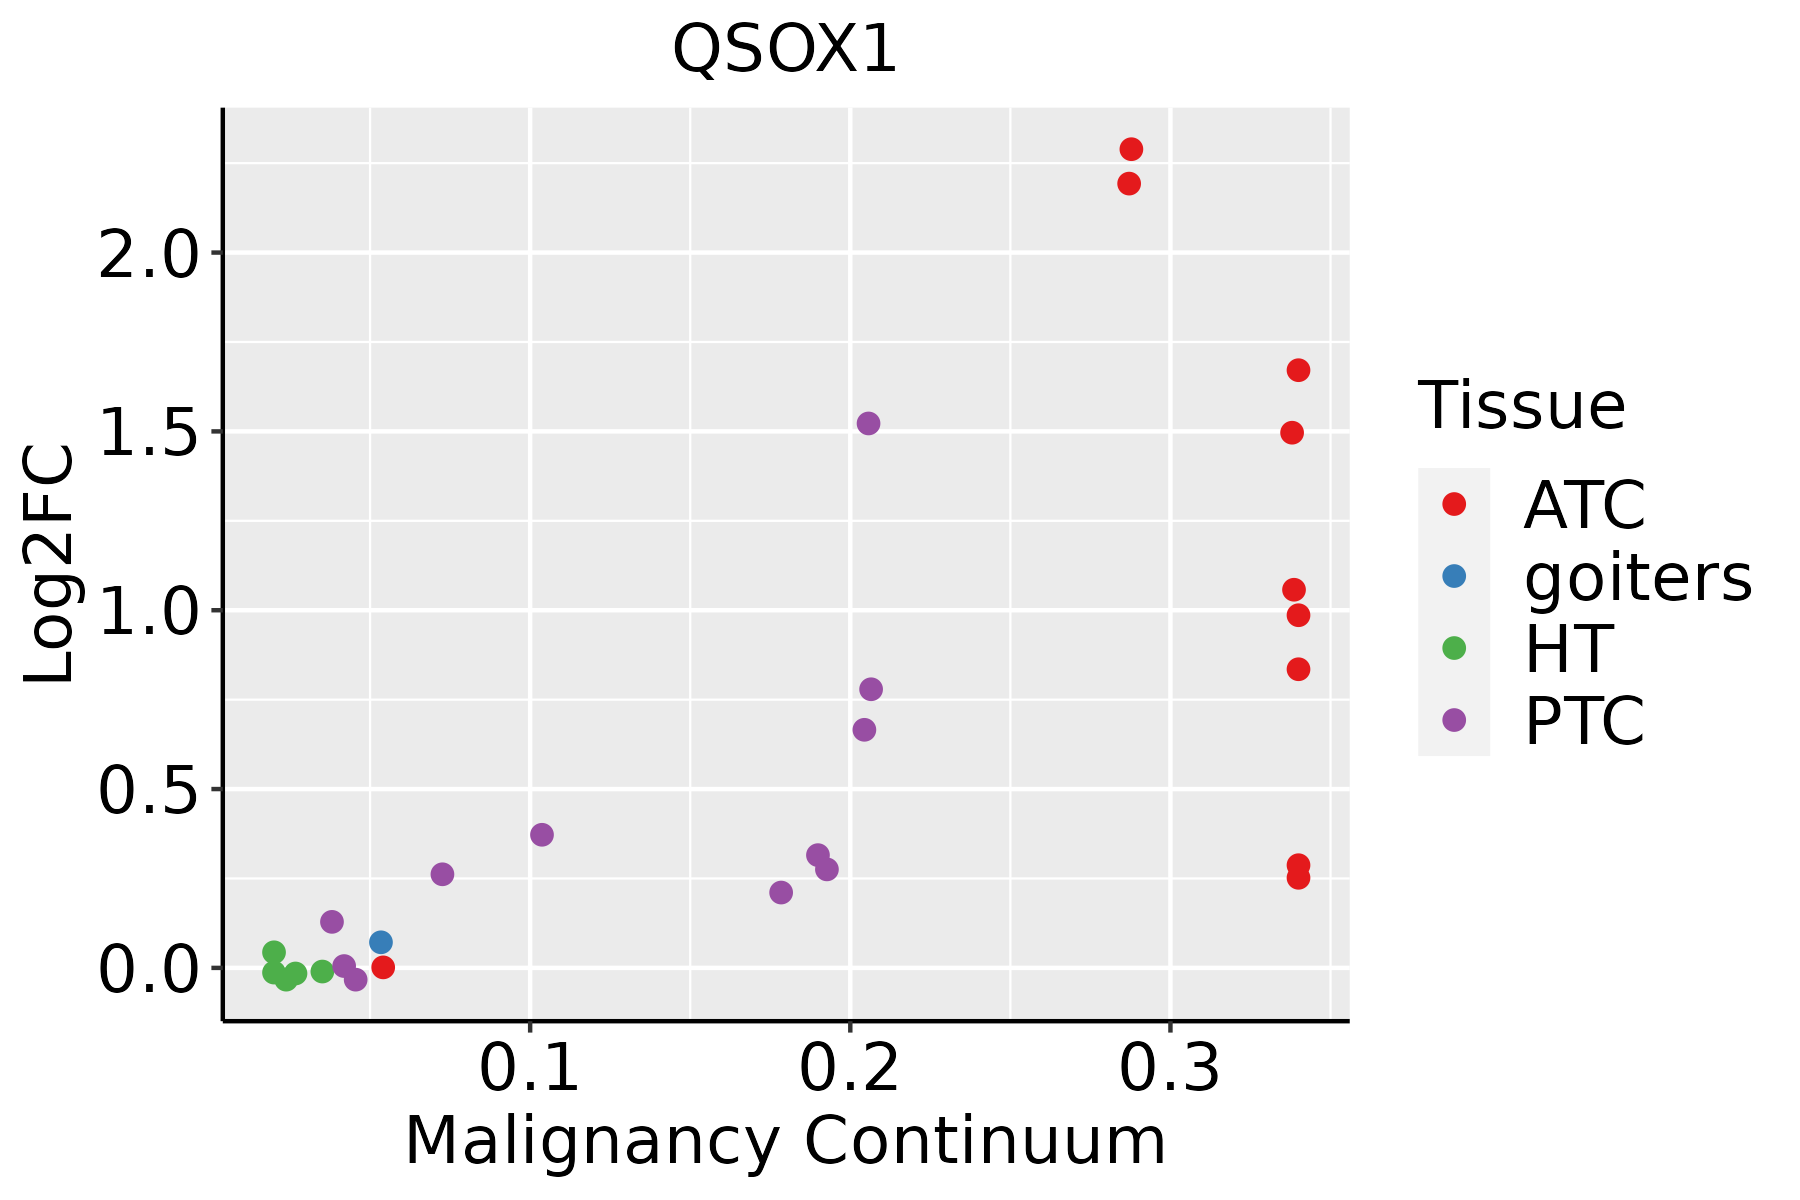 | ATC: Anaplastic thyroid cancer |
| HT: Hashimoto's thyroiditis | ||
| PTC: Papillary thyroid cancer |
| ∗log2FC in expression of this searched gene in stem-like cells from each diseased tissue sample relative to stem-like cells in normal samples in each tissue plotted against the malignancy continuum. Samples are colored based on if they are from different disease stage. |
Top |
Malignant transformation related pathway analysis |
| Find out the enriched GO biological processes and KEGG pathways involved in transition from healthy to precancer to cancer |
| Tissue | Disease Stage | Enriched GO biological Processes |
| Colorectum | AD |  |
| Colorectum | SER |  |
| Colorectum | MSS |  |
| Colorectum | MSI-H |  |
| Colorectum | FAP |  |
| ∗Top 15 enriched GO BP terms are showed in the bar plot of each disease state in each tissue. Each row represents a significant GO biological process which is colored according to the -log10(p.adjust). |
| Page: 1 2 3 4 5 6 7 8 9 |
| GO ID | Tissue | Disease Stage | Description | Gene Ratio | Bg Ratio | pvalue | p.adjust | Count |
| GO:0009895 | Colorectum | AD | negative regulation of catabolic process | 124/3918 | 320/18723 | 1.66e-13 | 3.35e-11 | 124 |
| GO:0031330 | Colorectum | AD | negative regulation of cellular catabolic process | 104/3918 | 262/18723 | 2.66e-12 | 3.96e-10 | 104 |
| GO:0010506 | Colorectum | AD | regulation of autophagy | 111/3918 | 317/18723 | 3.57e-09 | 2.35e-07 | 111 |
| GO:0016236 | Colorectum | AD | macroautophagy | 103/3918 | 291/18723 | 6.76e-09 | 4.15e-07 | 103 |
| GO:0006457 | Colorectum | AD | protein folding | 73/3918 | 212/18723 | 3.24e-06 | 9.10e-05 | 73 |
| GO:0016241 | Colorectum | AD | regulation of macroautophagy | 50/3918 | 141/18723 | 4.55e-05 | 7.92e-04 | 50 |
| GO:0010507 | Colorectum | AD | negative regulation of autophagy | 31/3918 | 85/18723 | 6.91e-04 | 7.05e-03 | 31 |
| GO:00162361 | Colorectum | SER | macroautophagy | 79/2897 | 291/18723 | 1.97e-07 | 1.10e-05 | 79 |
| GO:00098951 | Colorectum | SER | negative regulation of catabolic process | 84/2897 | 320/18723 | 3.93e-07 | 2.06e-05 | 84 |
| GO:00313301 | Colorectum | SER | negative regulation of cellular catabolic process | 70/2897 | 262/18723 | 1.79e-06 | 7.70e-05 | 70 |
| GO:00064571 | Colorectum | SER | protein folding | 54/2897 | 212/18723 | 1.04e-04 | 2.18e-03 | 54 |
| GO:00105061 | Colorectum | SER | regulation of autophagy | 74/2897 | 317/18723 | 1.39e-04 | 2.77e-03 | 74 |
| GO:00162411 | Colorectum | SER | regulation of macroautophagy | 34/2897 | 141/18723 | 4.74e-03 | 3.72e-02 | 34 |
| GO:00313302 | Colorectum | MSS | negative regulation of cellular catabolic process | 96/3467 | 262/18723 | 2.67e-12 | 4.63e-10 | 96 |
| GO:00098952 | Colorectum | MSS | negative regulation of catabolic process | 110/3467 | 320/18723 | 7.88e-12 | 1.20e-09 | 110 |
| GO:00162362 | Colorectum | MSS | macroautophagy | 93/3467 | 291/18723 | 2.08e-08 | 1.17e-06 | 93 |
| GO:00064572 | Colorectum | MSS | protein folding | 71/3467 | 212/18723 | 1.25e-07 | 5.91e-06 | 71 |
| GO:00105062 | Colorectum | MSS | regulation of autophagy | 95/3467 | 317/18723 | 4.36e-07 | 1.71e-05 | 95 |
| GO:00162412 | Colorectum | MSS | regulation of macroautophagy | 44/3467 | 141/18723 | 1.88e-04 | 2.64e-03 | 44 |
| GO:00105071 | Colorectum | MSS | negative regulation of autophagy | 26/3467 | 85/18723 | 4.84e-03 | 3.38e-02 | 26 |
| Page: 1 2 3 4 5 6 |
| Pathway ID | Tissue | Disease Stage | Description | Gene Ratio | Bg Ratio | pvalue | p.adjust | qvalue | Count |
| Page: 1 |
Top |
Cell-cell communication analysis |
| Identification of potential cell-cell interactions between two cell types and their ligand-receptor pairs for different disease states |
| Ligand | Receptor | LRpair | Pathway | Tissue | Disease Stage |
| Page: 1 |
Top |
Single-cell gene regulatory network inference analysis |
| Find out the significant the regulons (TFs) and the target genes of each regulon across cell types for different disease states |
| TF | Cell Type | Tissue | Disease Stage | Target Gene | RSS | Regulon Activity |
| ∗The dot plots of a searched regulon are shown for all cell subpopulations in each disease state of each tissue based on the regulon specific score inferred using pySCENIC and by calculating the average expression. |
| Page: 1 |
Top |
Somatic mutation of malignant transformation related genes |
| Annotation of somatic variants for genes involved in malignant transformation |
| Hugo Symbol | Variant Class | Variant Classification | dbSNP RS | HGVSc | HGVSp | HGVSp Short | SWISSPROT | BIOTYPE | SIFT | PolyPhen | Tumor Sample Barcode | Tissue | Histology | Sex | Age | Stage | Therapy Types | Drugs | Outcome |
| QSOX1 | SNV | Missense_Mutation | c.1714G>C | p.Glu572Gln | p.E572Q | O00391 | protein_coding | tolerated(0.29) | benign(0.255) | TCGA-A8-A08L-01 | Breast | breast invasive carcinoma | Female | >=65 | III/IV | Unknown | Unknown | SD | |
| QSOX1 | SNV | Missense_Mutation | c.1275N>G | p.His425Gln | p.H425Q | O00391 | protein_coding | tolerated(0.21) | benign(0.136) | TCGA-A8-A09A-01 | Breast | breast invasive carcinoma | Female | <65 | I/II | Hormone Therapy | tamoxiphen | SD | |
| QSOX1 | SNV | Missense_Mutation | c.847G>A | p.Ala283Thr | p.A283T | O00391 | protein_coding | tolerated(0.41) | benign(0.009) | TCGA-BH-A18G-01 | Breast | breast invasive carcinoma | Female | >=65 | I/II | Unknown | Unknown | SD | |
| QSOX1 | SNV | Missense_Mutation | c.328T>A | p.Cys110Ser | p.C110S | O00391 | protein_coding | deleterious(0) | probably_damaging(1) | TCGA-E9-A1RE-01 | Breast | breast invasive carcinoma | Female | >=65 | III/IV | Hormone Therapy | tamoxiphen | SD | |
| QSOX1 | SNV | Missense_Mutation | novel | c.1864N>T | p.Pro622Ser | p.P622S | O00391 | protein_coding | tolerated(0.17) | benign(0.078) | TCGA-C5-A2LZ-01 | Cervix | cervical & endocervical cancer | Female | >=65 | III/IV | Unknown | Unknown | PD |
| QSOX1 | SNV | Missense_Mutation | c.1110C>A | p.Phe370Leu | p.F370L | O00391 | protein_coding | tolerated(0.67) | benign(0) | TCGA-FU-A3HZ-01 | Cervix | cervical & endocervical cancer | Female | <65 | I/II | Chemotherapy | cisplatin | CR | |
| QSOX1 | SNV | Missense_Mutation | novel | c.1841N>C | p.Arg614Thr | p.R614T | O00391 | protein_coding | tolerated(0.42) | benign(0.007) | TCGA-HM-A4S6-01 | Cervix | cervical & endocervical cancer | Female | <65 | III/IV | Chemotherapy | cisplatin | CR |
| QSOX1 | SNV | Missense_Mutation | rs747164407 | c.977G>A | p.Arg326His | p.R326H | O00391 | protein_coding | deleterious(0.01) | probably_damaging(0.937) | TCGA-MA-AA42-01 | Cervix | cervical & endocervical cancer | Female | >=65 | I/II | Unknown | Unknown | SD |
| QSOX1 | SNV | Missense_Mutation | c.595N>A | p.Leu199Met | p.L199M | O00391 | protein_coding | deleterious(0.01) | possibly_damaging(0.899) | TCGA-4T-AA8H-01 | Colorectum | colon adenocarcinoma | Female | <65 | I/II | Unknown | Unknown | SD | |
| QSOX1 | SNV | Missense_Mutation | c.1574N>G | p.Glu525Gly | p.E525G | O00391 | protein_coding | tolerated(0.88) | benign(0) | TCGA-AA-3672-01 | Colorectum | colon adenocarcinoma | Female | >=65 | III/IV | Unknown | Unknown | SD |
| Page: 1 2 3 4 5 6 7 8 |
Top |
Related drugs of malignant transformation related genes |
| Identification of chemicals and drugs interact with genes involved in malignant transfromation |
| (DGIdb 4.0) |
| Entrez ID | Symbol | Category | Interaction Types | Drug Claim Name | Drug Name | PMIDs |
| Page: 1 |

Copyright 2023-Present -The University of Texas Health Science Center at Houston |