
|
|||||
|
 | |
| |
| |
| |
| |
| |
|
Gene: QSER1 |
Gene summary for QSER1 |
| Gene information | Species | Human | Gene symbol | QSER1 | Gene ID | 79832 |
| Gene name | glutamine and serine rich 1 | |
| Gene Alias | QSER1 | |
| Cytomap | 11p13 | |
| Gene Type | protein-coding | GO ID | NA | UniProtAcc | B3KWV1 |
Top |
Malignant transformation analysis |
| Identification of the aberrant gene expression in precancerous and cancerous lesions by comparing the gene expression of stem-like cells in diseased tissues with normal stem cells |
| Entrez ID | Symbol | Replicates | Species | Organ | Tissue | Adj P-value | Log2FC | Malignancy |
| 79832 | QSER1 | HTA11_3410_2000001011 | Human | Colorectum | AD | 4.24e-16 | -5.21e-01 | 0.0155 |
| 79832 | QSER1 | HTA11_2487_2000001011 | Human | Colorectum | SER | 1.36e-07 | -4.97e-01 | -0.1808 |
| 79832 | QSER1 | HTA11_1938_2000001011 | Human | Colorectum | AD | 3.42e-02 | -4.15e-01 | -0.0811 |
| 79832 | QSER1 | HTA11_78_2000001011 | Human | Colorectum | AD | 4.61e-02 | -3.24e-01 | -0.1088 |
| 79832 | QSER1 | HTA11_3361_2000001011 | Human | Colorectum | AD | 3.25e-04 | -4.55e-01 | -0.1207 |
| 79832 | QSER1 | HTA11_696_2000001011 | Human | Colorectum | AD | 1.83e-11 | -4.03e-01 | -0.1464 |
| 79832 | QSER1 | HTA11_866_2000001011 | Human | Colorectum | AD | 1.98e-05 | -3.65e-01 | -0.1001 |
| 79832 | QSER1 | HTA11_1391_2000001011 | Human | Colorectum | AD | 1.80e-04 | -3.96e-01 | -0.059 |
| 79832 | QSER1 | HTA11_7862_2000001011 | Human | Colorectum | AD | 4.41e-03 | -5.24e-01 | -0.0179 |
| 79832 | QSER1 | HTA11_866_3004761011 | Human | Colorectum | AD | 5.57e-11 | -4.77e-01 | 0.096 |
| 79832 | QSER1 | HTA11_8622_2000001021 | Human | Colorectum | SER | 6.78e-03 | -5.41e-01 | 0.0528 |
| 79832 | QSER1 | HTA11_10711_2000001011 | Human | Colorectum | AD | 6.98e-06 | -4.71e-01 | 0.0338 |
| 79832 | QSER1 | HTA11_7696_3000711011 | Human | Colorectum | AD | 1.27e-12 | -4.63e-01 | 0.0674 |
| 79832 | QSER1 | HTA11_6818_2000001021 | Human | Colorectum | AD | 4.63e-02 | -4.20e-01 | 0.0588 |
| 79832 | QSER1 | HTA11_99999970781_79442 | Human | Colorectum | MSS | 1.39e-12 | -4.10e-01 | 0.294 |
| 79832 | QSER1 | HTA11_99999965104_69814 | Human | Colorectum | MSS | 1.05e-03 | -4.31e-01 | 0.281 |
| 79832 | QSER1 | HTA11_99999971662_82457 | Human | Colorectum | MSS | 1.39e-02 | -2.88e-01 | 0.3859 |
| 79832 | QSER1 | HTA11_99999974143_84620 | Human | Colorectum | MSS | 8.37e-12 | -4.16e-01 | 0.3005 |
| 79832 | QSER1 | F007 | Human | Colorectum | FAP | 3.77e-07 | -4.27e-01 | 0.1176 |
| 79832 | QSER1 | A002-C-010 | Human | Colorectum | FAP | 1.52e-05 | -2.91e-01 | 0.242 |
| Page: 1 2 3 4 5 6 7 8 |
| Tissue | Expression Dynamics | Abbreviation |
| Colorectum (GSE201348) |  | FAP: Familial adenomatous polyposis |
| CRC: Colorectal cancer | ||
| Colorectum (HTA11) |  | AD: Adenomas |
| SER: Sessile serrated lesions | ||
| MSI-H: Microsatellite-high colorectal cancer | ||
| MSS: Microsatellite stable colorectal cancer | ||
| Esophagus | 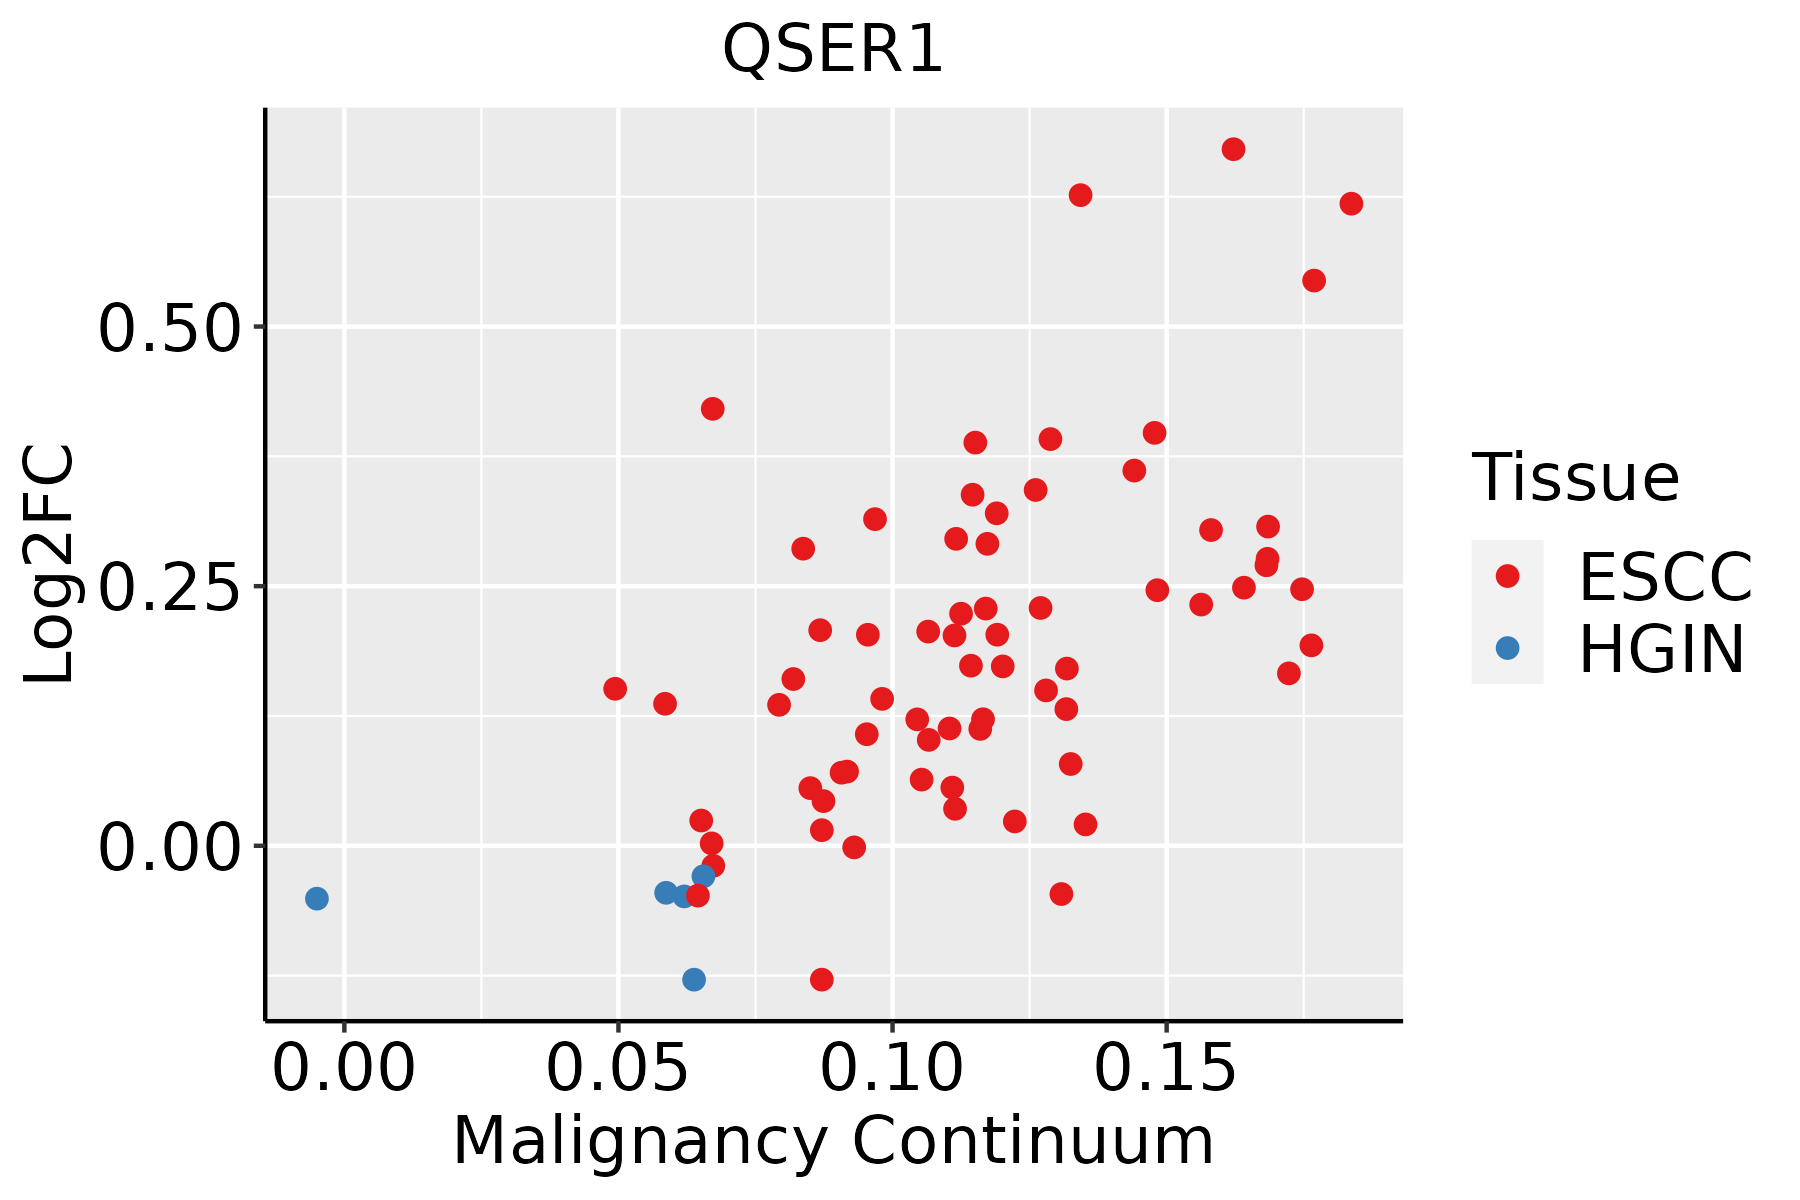 | ESCC: Esophageal squamous cell carcinoma |
| HGIN: High-grade intraepithelial neoplasias | ||
| LGIN: Low-grade intraepithelial neoplasias | ||
| Liver |  | HCC: Hepatocellular carcinoma |
| NAFLD: Non-alcoholic fatty liver disease | ||
| Oral Cavity | 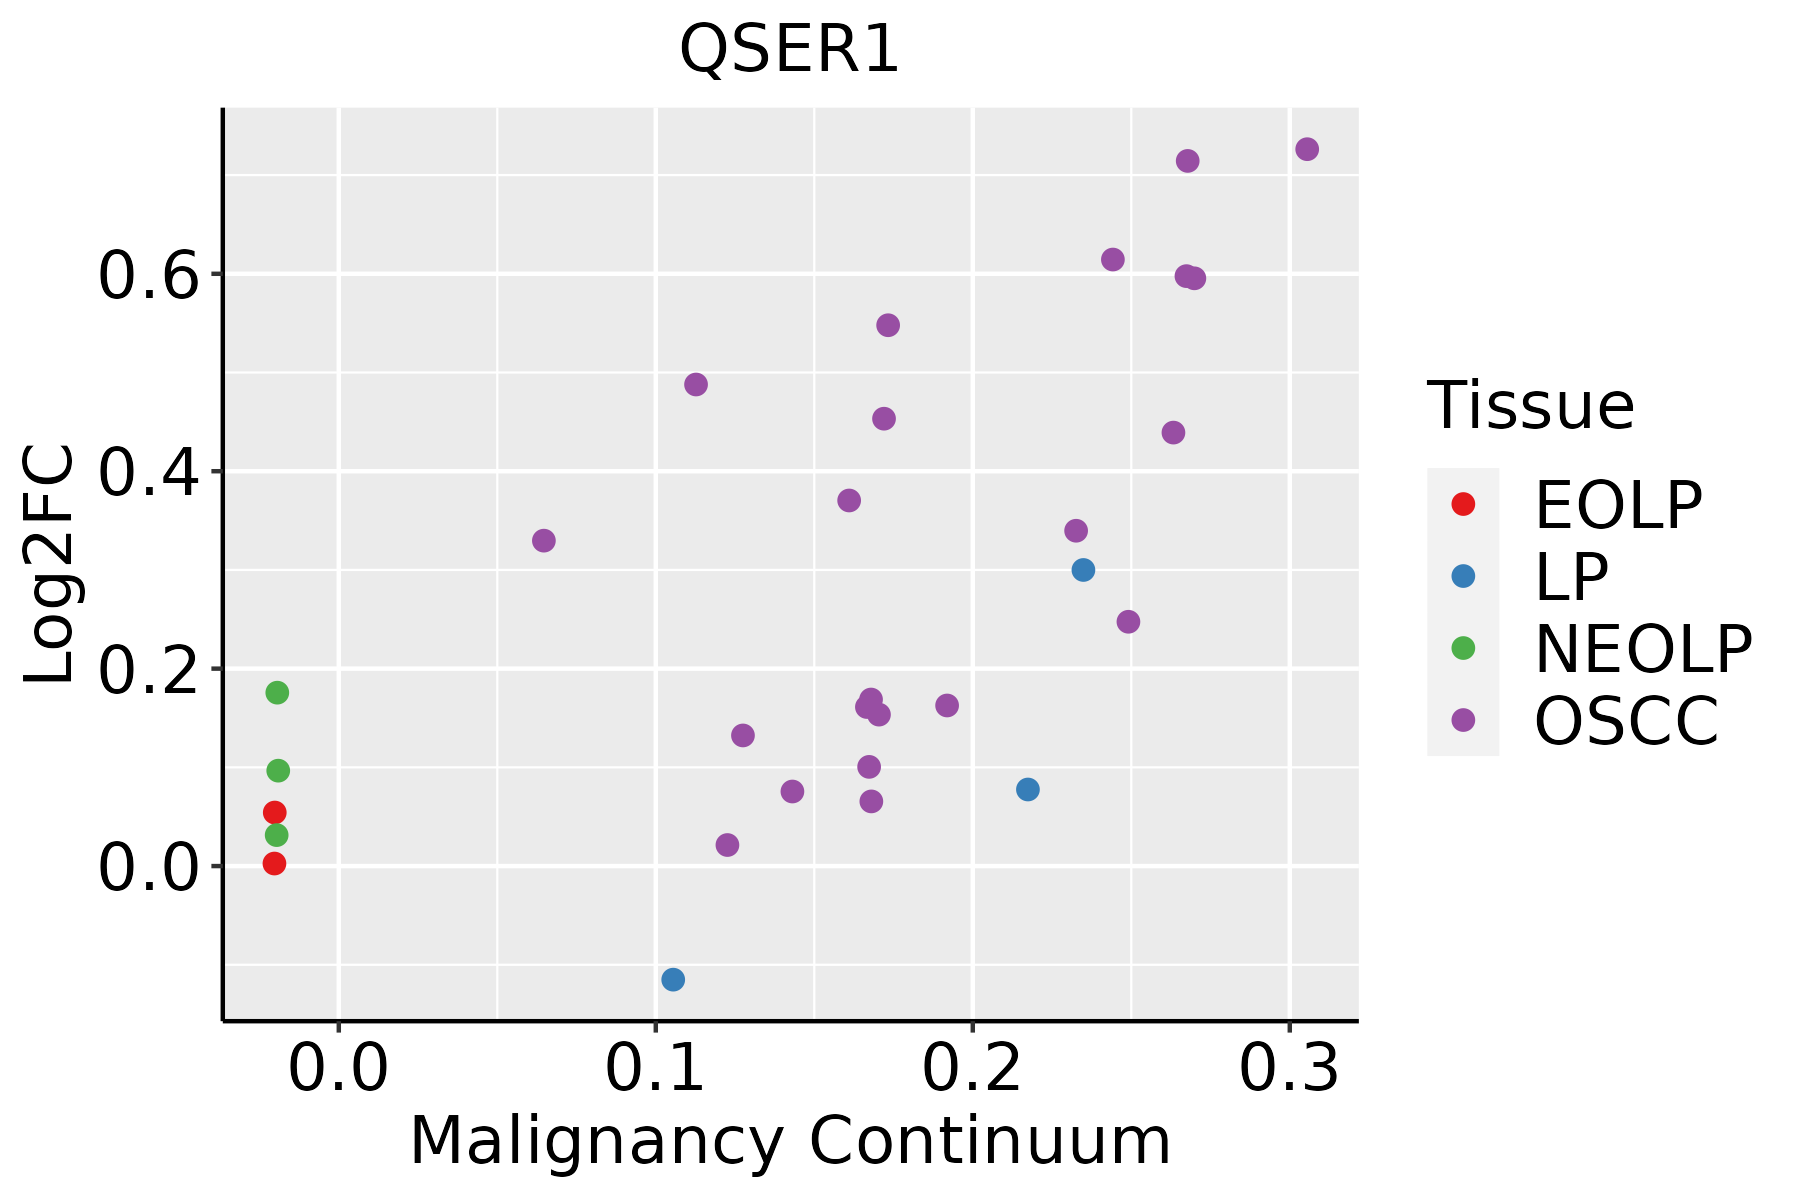 | EOLP: Erosive Oral lichen planus |
| LP: leukoplakia | ||
| NEOLP: Non-erosive oral lichen planus | ||
| OSCC: Oral squamous cell carcinoma | ||
| Skin | 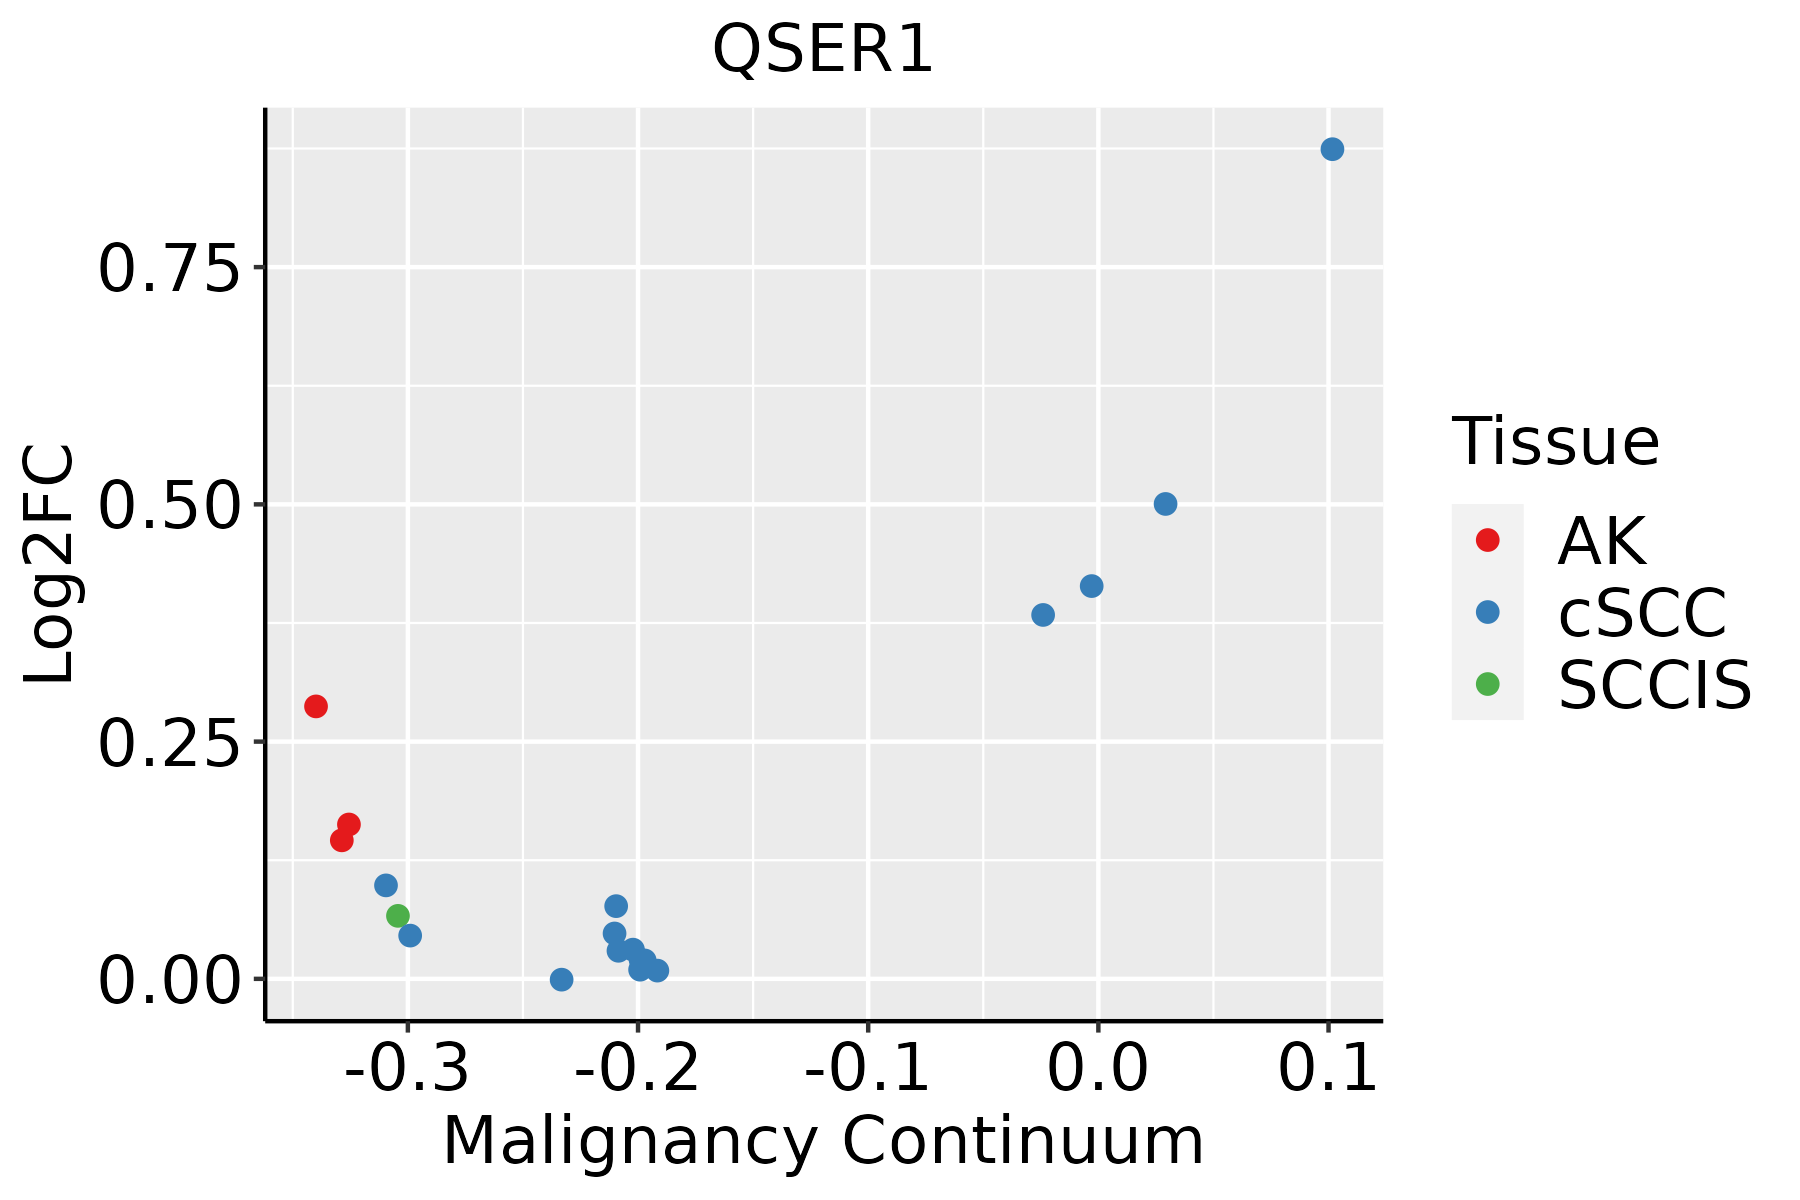 | AK: Actinic keratosis |
| cSCC: Cutaneous squamous cell carcinoma | ||
| SCCIS:squamous cell carcinoma in situ | ||
| Thyroid |  | ATC: Anaplastic thyroid cancer |
| HT: Hashimoto's thyroiditis | ||
| PTC: Papillary thyroid cancer |
| ∗log2FC in expression of this searched gene in stem-like cells from each diseased tissue sample relative to stem-like cells in normal samples in each tissue plotted against the malignancy continuum. Samples are colored based on if they are from different disease stage. |
Top |
Malignant transformation related pathway analysis |
| Find out the enriched GO biological processes and KEGG pathways involved in transition from healthy to precancer to cancer |
| Tissue | Disease Stage | Enriched GO biological Processes |
| Colorectum | AD |  |
| Colorectum | SER |  |
| Colorectum | MSS |  |
| Colorectum | MSI-H |  |
| Colorectum | FAP |  |
| ∗Top 15 enriched GO BP terms are showed in the bar plot of each disease state in each tissue. Each row represents a significant GO biological process which is colored according to the -log10(p.adjust). |
| Page: 1 2 3 4 5 6 7 8 9 |
| GO ID | Tissue | Disease Stage | Description | Gene Ratio | Bg Ratio | pvalue | p.adjust | Count |
| Page: 1 |
| Pathway ID | Tissue | Disease Stage | Description | Gene Ratio | Bg Ratio | pvalue | p.adjust | qvalue | Count |
| Page: 1 |
Top |
Cell-cell communication analysis |
| Identification of potential cell-cell interactions between two cell types and their ligand-receptor pairs for different disease states |
| Ligand | Receptor | LRpair | Pathway | Tissue | Disease Stage |
| Page: 1 |
Top |
Single-cell gene regulatory network inference analysis |
| Find out the significant the regulons (TFs) and the target genes of each regulon across cell types for different disease states |
| TF | Cell Type | Tissue | Disease Stage | Target Gene | RSS | Regulon Activity |
| ∗The dot plots of a searched regulon are shown for all cell subpopulations in each disease state of each tissue based on the regulon specific score inferred using pySCENIC and by calculating the average expression. |
| Page: 1 |
Top |
Somatic mutation of malignant transformation related genes |
| Annotation of somatic variants for genes involved in malignant transformation |
| Hugo Symbol | Variant Class | Variant Classification | dbSNP RS | HGVSc | HGVSp | HGVSp Short | SWISSPROT | BIOTYPE | SIFT | PolyPhen | Tumor Sample Barcode | Tissue | Histology | Sex | Age | Stage | Therapy Types | Drugs | Outcome |
| QSER1 | SNV | Missense_Mutation | c.2913G>T | p.Glu971Asp | p.E971D | Q2KHR3 | protein_coding | tolerated_low_confidence(0.22) | benign(0.007) | TCGA-A1-A0SI-01 | Breast | breast invasive carcinoma | Female | <65 | I/II | Unknown | Unknown | SD | |
| QSER1 | SNV | Missense_Mutation | c.2206N>G | p.Leu736Val | p.L736V | Q2KHR3 | protein_coding | deleterious(0.02) | benign(0.089) | TCGA-A2-A0EY-01 | Breast | breast invasive carcinoma | Female | <65 | I/II | Chemotherapy | adriamycin | SD | |
| QSER1 | SNV | Missense_Mutation | c.2372N>G | p.Ser791Cys | p.S791C | Q2KHR3 | protein_coding | deleterious(0) | possibly_damaging(0.635) | TCGA-A2-A0EY-01 | Breast | breast invasive carcinoma | Female | <65 | I/II | Chemotherapy | adriamycin | SD | |
| QSER1 | SNV | Missense_Mutation | c.2554N>T | p.Asp852Tyr | p.D852Y | Q2KHR3 | protein_coding | deleterious(0) | probably_damaging(0.999) | TCGA-A8-A09I-01 | Breast | breast invasive carcinoma | Female | >=65 | I/II | Hormone Therapy | anastrozole | SD | |
| QSER1 | SNV | Missense_Mutation | c.2801C>T | p.Pro934Leu | p.P934L | Q2KHR3 | protein_coding | deleterious_low_confidence(0.03) | benign(0.018) | TCGA-A8-A0A9-01 | Breast | breast invasive carcinoma | Female | >=65 | I/II | Hormone Therapy | anastrozole | SD | |
| QSER1 | SNV | Missense_Mutation | c.1339C>G | p.Gln447Glu | p.Q447E | Q2KHR3 | protein_coding | tolerated(0.07) | benign(0.315) | TCGA-AC-A23H-01 | Breast | breast invasive carcinoma | Female | >=65 | I/II | Unknown | Unknown | PD | |
| QSER1 | SNV | Missense_Mutation | c.1460C>G | p.Ser487Cys | p.S487C | Q2KHR3 | protein_coding | deleterious(0) | possibly_damaging(0.554) | TCGA-AC-A23H-01 | Breast | breast invasive carcinoma | Female | >=65 | I/II | Unknown | Unknown | PD | |
| QSER1 | SNV | Missense_Mutation | c.607G>A | p.Ala203Thr | p.A203T | Q2KHR3 | protein_coding | tolerated(0.11) | benign(0.162) | TCGA-AO-A0JG-01 | Breast | breast invasive carcinoma | Female | <65 | III/IV | Chemotherapy | doxorubicin | SD | |
| QSER1 | SNV | Missense_Mutation | novel | c.2083N>G | p.His695Asp | p.H695D | Q2KHR3 | protein_coding | deleterious(0.01) | benign(0.058) | TCGA-AR-A0TU-01 | Breast | breast invasive carcinoma | Female | <65 | I/II | Unspecific | Doxorubicin | SD |
| QSER1 | SNV | Missense_Mutation | rs776302648 | c.3144N>T | p.Met1048Ile | p.M1048I | Q2KHR3 | protein_coding | tolerated_low_confidence(0.22) | benign(0) | TCGA-AR-A1AS-01 | Breast | breast invasive carcinoma | Female | <65 | I/II | Chemotherapy | doxorubicin | SD |
| Page: 1 2 3 4 5 6 7 8 9 10 11 12 13 14 15 16 17 18 19 |
Top |
Related drugs of malignant transformation related genes |
| Identification of chemicals and drugs interact with genes involved in malignant transfromation |
| (DGIdb 4.0) |
| Entrez ID | Symbol | Category | Interaction Types | Drug Claim Name | Drug Name | PMIDs |
| Page: 1 |

Copyright 2023-Present -The University of Texas Health Science Center at Houston |