
|
|||||
|
 | |
| |
| |
| |
| |
| |
|
Gene: QRICH1 |
Gene summary for QRICH1 |
| Gene information | Species | Human | Gene symbol | QRICH1 | Gene ID | 54870 |
| Gene name | glutamine rich 1 | |
| Gene Alias | AB-DIP | |
| Cytomap | 3p21.31 | |
| Gene Type | protein-coding | GO ID | GO:0006139 | UniProtAcc | A1L3Z9 |
Top |
Malignant transformation analysis |
| Identification of the aberrant gene expression in precancerous and cancerous lesions by comparing the gene expression of stem-like cells in diseased tissues with normal stem cells |
| Entrez ID | Symbol | Replicates | Species | Organ | Tissue | Adj P-value | Log2FC | Malignancy |
| 54870 | QRICH1 | LZE4T | Human | Esophagus | ESCC | 1.55e-10 | 1.12e-01 | 0.0811 |
| 54870 | QRICH1 | LZE7T | Human | Esophagus | ESCC | 1.73e-04 | 2.41e-01 | 0.0667 |
| 54870 | QRICH1 | LZE20T | Human | Esophagus | ESCC | 1.25e-04 | 4.31e-02 | 0.0662 |
| 54870 | QRICH1 | LZE24T | Human | Esophagus | ESCC | 2.84e-13 | 2.75e-01 | 0.0596 |
| 54870 | QRICH1 | LZE21T | Human | Esophagus | ESCC | 8.89e-03 | 9.63e-02 | 0.0655 |
| 54870 | QRICH1 | P1T-E | Human | Esophagus | ESCC | 3.44e-03 | 2.38e-01 | 0.0875 |
| 54870 | QRICH1 | P2T-E | Human | Esophagus | ESCC | 4.03e-23 | 3.16e-01 | 0.1177 |
| 54870 | QRICH1 | P4T-E | Human | Esophagus | ESCC | 2.34e-21 | 3.66e-01 | 0.1323 |
| 54870 | QRICH1 | P5T-E | Human | Esophagus | ESCC | 1.58e-06 | 1.18e-01 | 0.1327 |
| 54870 | QRICH1 | P8T-E | Human | Esophagus | ESCC | 3.13e-10 | 2.05e-01 | 0.0889 |
| 54870 | QRICH1 | P9T-E | Human | Esophagus | ESCC | 4.15e-14 | 2.10e-01 | 0.1131 |
| 54870 | QRICH1 | P10T-E | Human | Esophagus | ESCC | 1.55e-16 | 2.13e-01 | 0.116 |
| 54870 | QRICH1 | P11T-E | Human | Esophagus | ESCC | 1.22e-11 | 3.92e-01 | 0.1426 |
| 54870 | QRICH1 | P12T-E | Human | Esophagus | ESCC | 1.08e-23 | 4.59e-01 | 0.1122 |
| 54870 | QRICH1 | P15T-E | Human | Esophagus | ESCC | 1.06e-15 | 2.66e-01 | 0.1149 |
| 54870 | QRICH1 | P16T-E | Human | Esophagus | ESCC | 5.11e-21 | 3.21e-01 | 0.1153 |
| 54870 | QRICH1 | P19T-E | Human | Esophagus | ESCC | 3.19e-06 | 2.35e-01 | 0.1662 |
| 54870 | QRICH1 | P20T-E | Human | Esophagus | ESCC | 7.91e-20 | 2.53e-01 | 0.1124 |
| 54870 | QRICH1 | P21T-E | Human | Esophagus | ESCC | 2.72e-22 | 3.01e-01 | 0.1617 |
| 54870 | QRICH1 | P22T-E | Human | Esophagus | ESCC | 5.55e-16 | 2.15e-01 | 0.1236 |
| Page: 1 2 3 4 |
| Tissue | Expression Dynamics | Abbreviation |
| Esophagus | 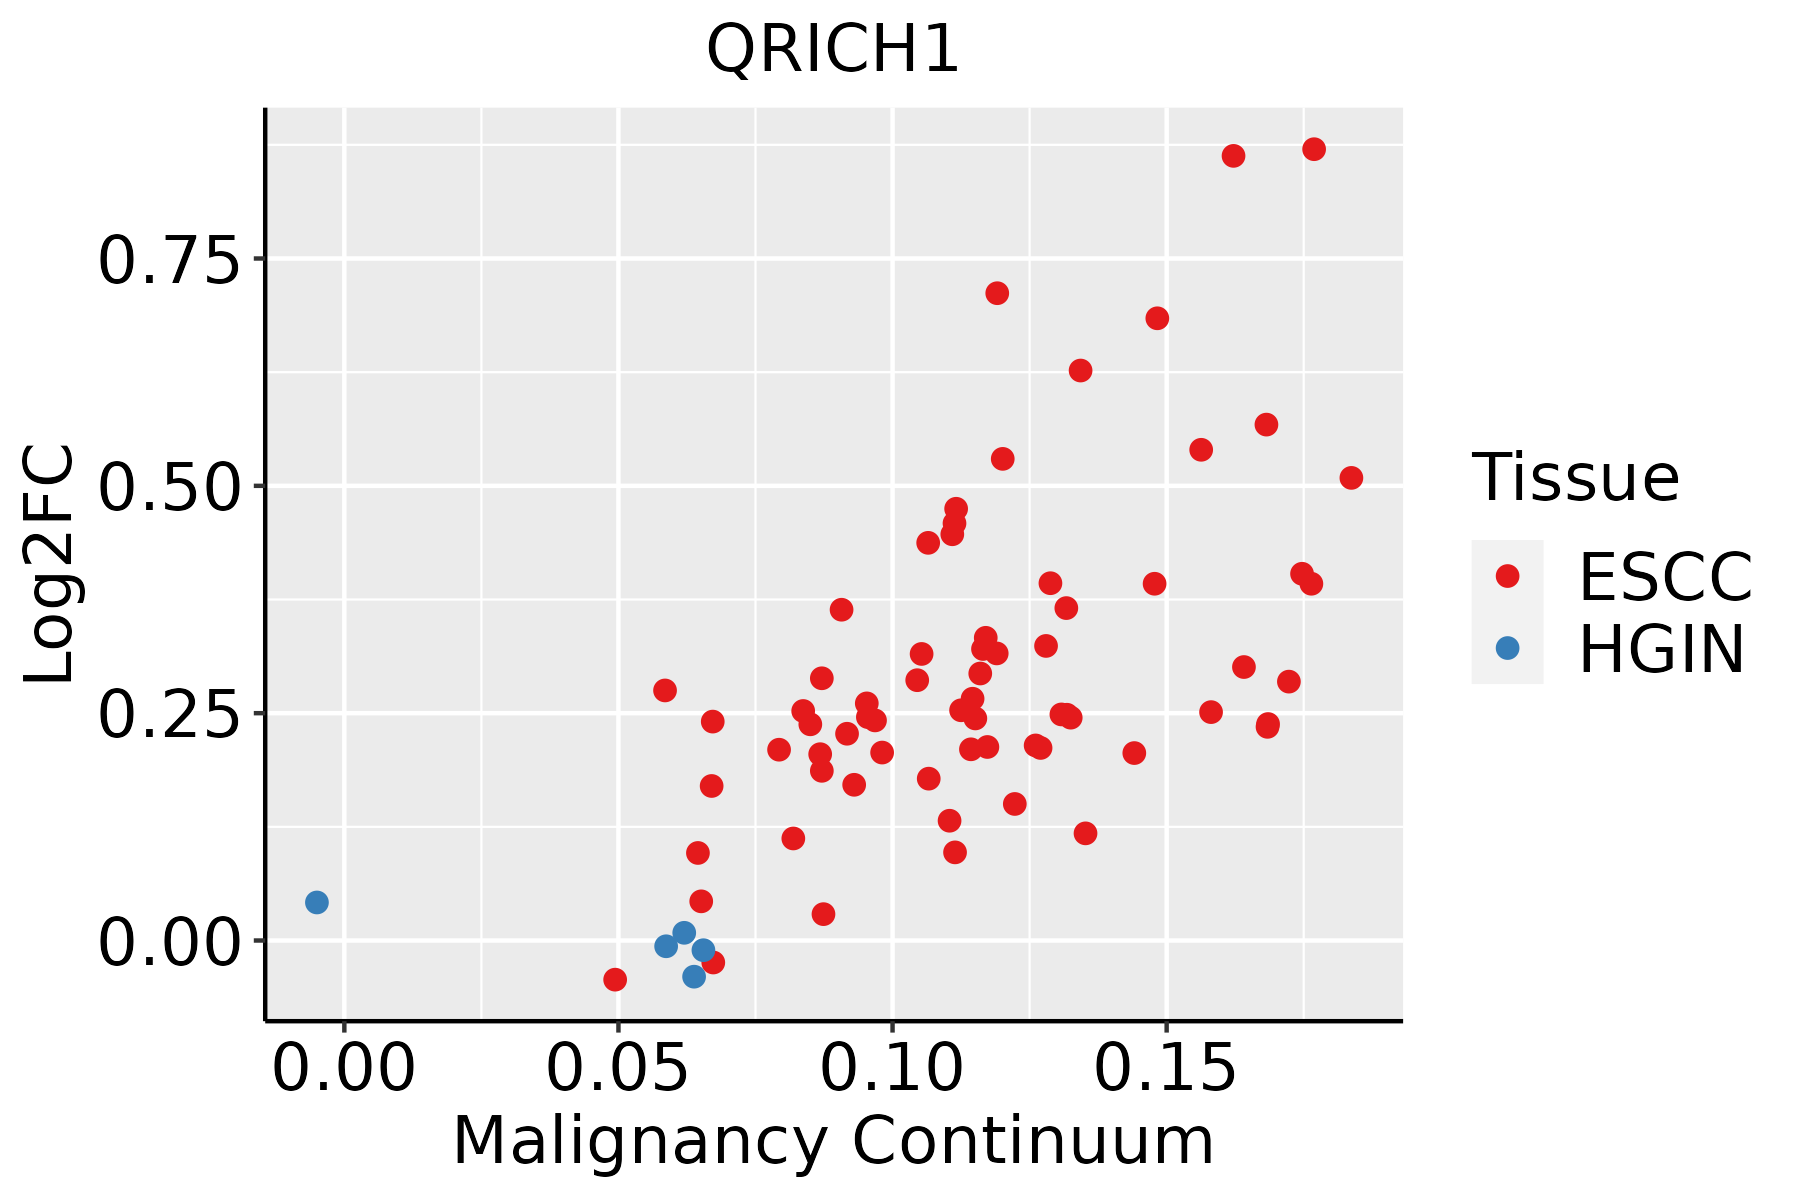 | ESCC: Esophageal squamous cell carcinoma |
| HGIN: High-grade intraepithelial neoplasias | ||
| LGIN: Low-grade intraepithelial neoplasias | ||
| Liver | 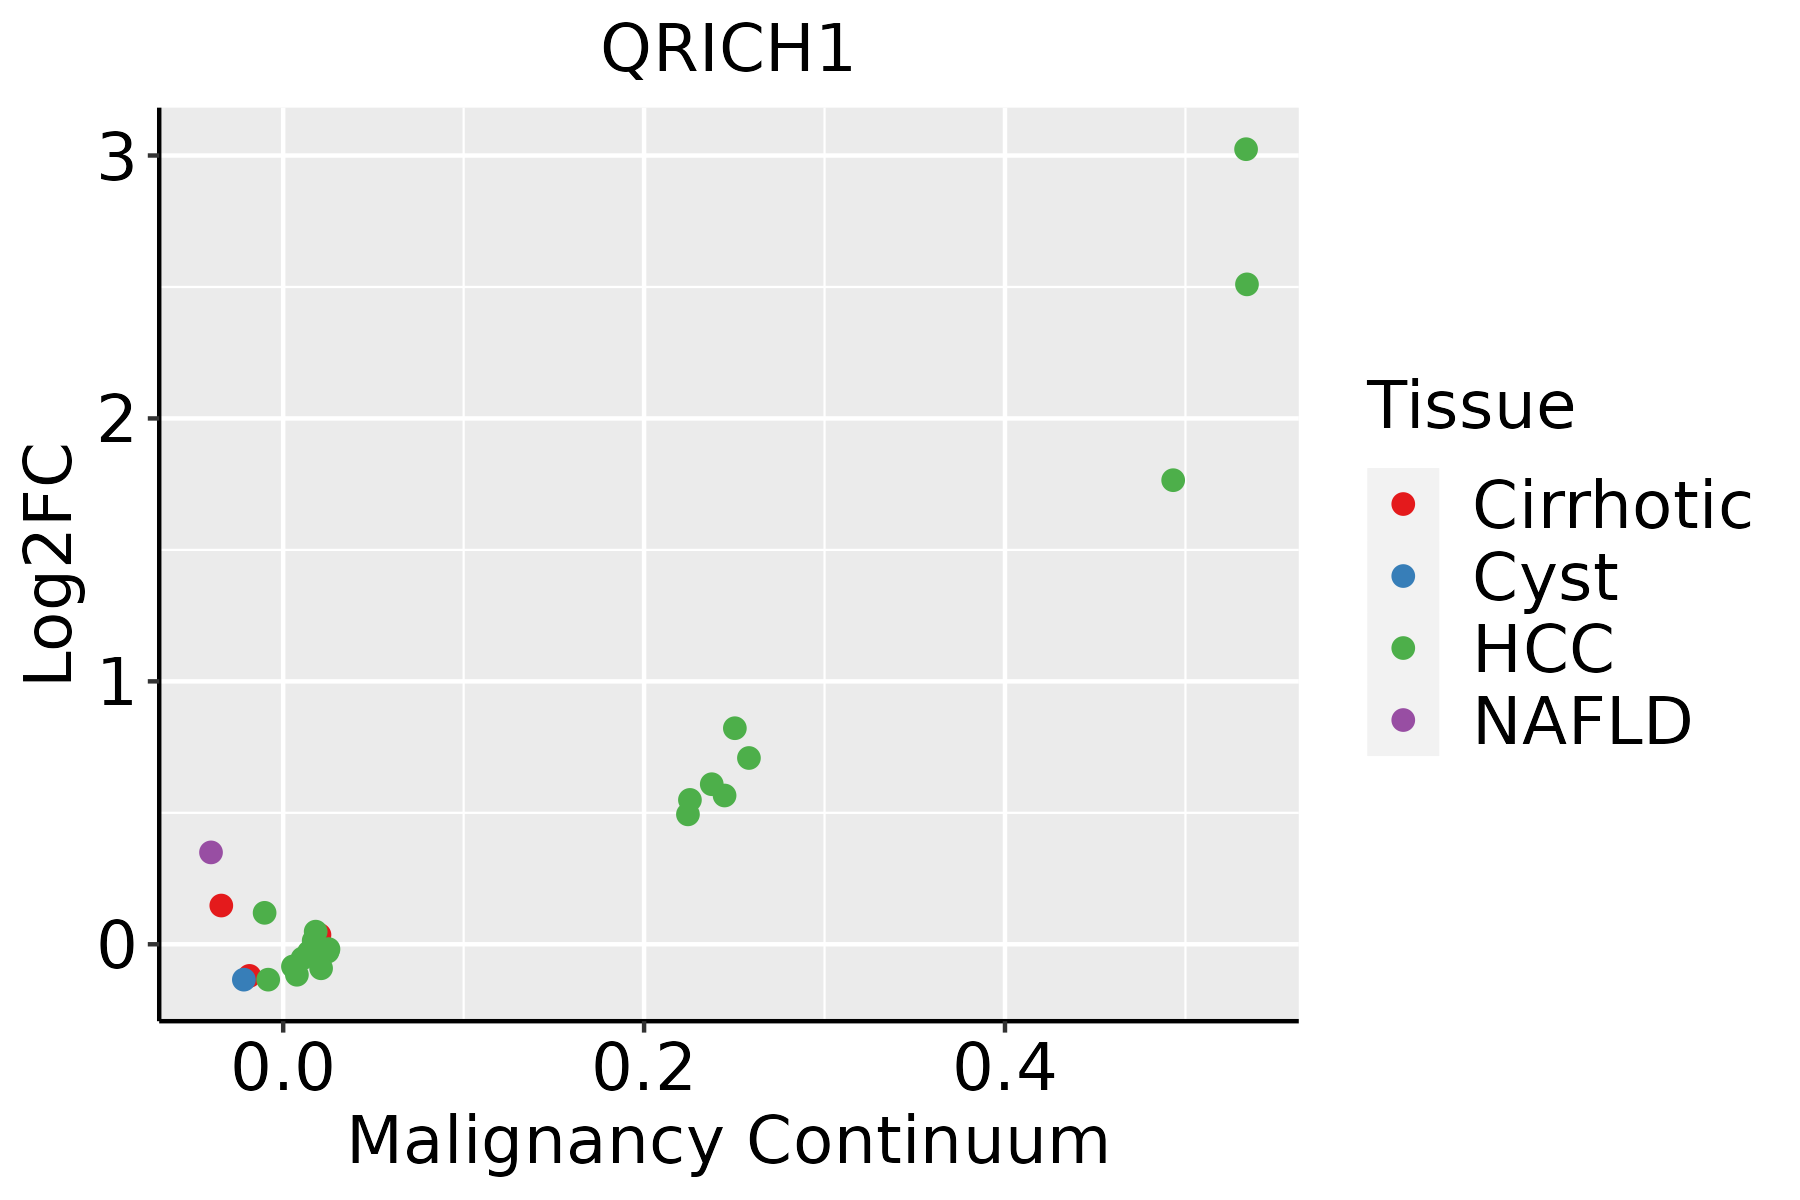 | HCC: Hepatocellular carcinoma |
| NAFLD: Non-alcoholic fatty liver disease |
| ∗log2FC in expression of this searched gene in stem-like cells from each diseased tissue sample relative to stem-like cells in normal samples in each tissue plotted against the malignancy continuum. Samples are colored based on if they are from different disease stage. |
Top |
Malignant transformation related pathway analysis |
| Find out the enriched GO biological processes and KEGG pathways involved in transition from healthy to precancer to cancer |
| Tissue | Disease Stage | Enriched GO biological Processes |
| Colorectum | AD |  |
| Colorectum | SER |  |
| Colorectum | MSS |  |
| Colorectum | MSI-H |  |
| Colorectum | FAP |  |
| ∗Top 15 enriched GO BP terms are showed in the bar plot of each disease state in each tissue. Each row represents a significant GO biological process which is colored according to the -log10(p.adjust). |
| Page: 1 2 3 4 5 6 7 8 9 |
| GO ID | Tissue | Disease Stage | Description | Gene Ratio | Bg Ratio | pvalue | p.adjust | Count |
| GO:0097193111 | Esophagus | ESCC | intrinsic apoptotic signaling pathway | 222/8552 | 288/18723 | 5.87e-28 | 2.02e-25 | 222 |
| GO:0034976111 | Esophagus | ESCC | response to endoplasmic reticulum stress | 192/8552 | 256/18723 | 7.15e-22 | 1.30e-19 | 192 |
| GO:0035966111 | Esophagus | ESCC | response to topologically incorrect protein | 125/8552 | 159/18723 | 1.44e-17 | 1.27e-15 | 125 |
| GO:0006986111 | Esophagus | ESCC | response to unfolded protein | 107/8552 | 137/18723 | 7.01e-15 | 3.87e-13 | 107 |
| GO:0035967111 | Esophagus | ESCC | cellular response to topologically incorrect protein | 90/8552 | 116/18723 | 1.94e-12 | 8.11e-11 | 90 |
| GO:0034620111 | Esophagus | ESCC | cellular response to unfolded protein | 74/8552 | 96/18723 | 3.10e-10 | 8.66e-09 | 74 |
| GO:003096818 | Esophagus | ESCC | endoplasmic reticulum unfolded protein response | 59/8552 | 74/18723 | 1.90e-09 | 4.36e-08 | 59 |
| GO:0070059111 | Esophagus | ESCC | intrinsic apoptotic signaling pathway in response to endoplasmic reticulum stress | 50/8552 | 63/18723 | 4.37e-08 | 7.96e-07 | 50 |
| GO:000698416 | Esophagus | ESCC | ER-nucleus signaling pathway | 38/8552 | 46/18723 | 2.70e-07 | 4.00e-06 | 38 |
| GO:014046713 | Esophagus | ESCC | integrated stress response signaling | 18/8552 | 22/18723 | 5.69e-04 | 3.10e-03 | 18 |
| GO:003649913 | Esophagus | ESCC | PERK-mediated unfolded protein response | 15/8552 | 18/18723 | 1.20e-03 | 5.88e-03 | 15 |
| GO:00349767 | Liver | Cirrhotic | response to endoplasmic reticulum stress | 130/4634 | 256/18723 | 1.72e-19 | 3.86e-17 | 130 |
| GO:00359667 | Liver | Cirrhotic | response to topologically incorrect protein | 91/4634 | 159/18723 | 2.07e-18 | 3.60e-16 | 91 |
| GO:00069867 | Liver | Cirrhotic | response to unfolded protein | 79/4634 | 137/18723 | 1.99e-16 | 2.49e-14 | 79 |
| GO:009719312 | Liver | Cirrhotic | intrinsic apoptotic signaling pathway | 130/4634 | 288/18723 | 2.69e-14 | 2.45e-12 | 130 |
| GO:00359677 | Liver | Cirrhotic | cellular response to topologically incorrect protein | 64/4634 | 116/18723 | 2.20e-12 | 1.62e-10 | 64 |
| GO:00346207 | Liver | Cirrhotic | cellular response to unfolded protein | 54/4634 | 96/18723 | 4.16e-11 | 2.42e-09 | 54 |
| GO:00309686 | Liver | Cirrhotic | endoplasmic reticulum unfolded protein response | 43/4634 | 74/18723 | 9.86e-10 | 4.48e-08 | 43 |
| GO:00069844 | Liver | Cirrhotic | ER-nucleus signaling pathway | 29/4634 | 46/18723 | 4.23e-08 | 1.36e-06 | 29 |
| GO:0140467 | Liver | Cirrhotic | integrated stress response signaling | 15/4634 | 22/18723 | 2.14e-05 | 2.81e-04 | 15 |
| Page: 1 2 |
| Pathway ID | Tissue | Disease Stage | Description | Gene Ratio | Bg Ratio | pvalue | p.adjust | qvalue | Count |
| Page: 1 |
Top |
Cell-cell communication analysis |
| Identification of potential cell-cell interactions between two cell types and their ligand-receptor pairs for different disease states |
| Ligand | Receptor | LRpair | Pathway | Tissue | Disease Stage |
| Page: 1 |
Top |
Single-cell gene regulatory network inference analysis |
| Find out the significant the regulons (TFs) and the target genes of each regulon across cell types for different disease states |
| TF | Cell Type | Tissue | Disease Stage | Target Gene | RSS | Regulon Activity |
| ∗The dot plots of a searched regulon are shown for all cell subpopulations in each disease state of each tissue based on the regulon specific score inferred using pySCENIC and by calculating the average expression. |
| Page: 1 |
Top |
Somatic mutation of malignant transformation related genes |
| Annotation of somatic variants for genes involved in malignant transformation |
| Hugo Symbol | Variant Class | Variant Classification | dbSNP RS | HGVSc | HGVSp | HGVSp Short | SWISSPROT | BIOTYPE | SIFT | PolyPhen | Tumor Sample Barcode | Tissue | Histology | Sex | Age | Stage | Therapy Types | Drugs | Outcome |
| QRICH1 | SNV | Missense_Mutation | c.1813G>C | p.Glu605Gln | p.E605Q | Q2TAL8 | protein_coding | deleterious(0) | possibly_damaging(0.596) | TCGA-A2-A0EQ-01 | Breast | breast invasive carcinoma | Female | <65 | I/II | Chemotherapy | adriamycin | SD | |
| QRICH1 | SNV | Missense_Mutation | c.1579G>A | p.Gly527Arg | p.G527R | Q2TAL8 | protein_coding | deleterious(0) | probably_damaging(0.988) | TCGA-A2-A0YK-01 | Breast | breast invasive carcinoma | Female | <65 | I/II | Chemotherapy | cytoxan | SD | |
| QRICH1 | SNV | Missense_Mutation | c.1711N>T | p.Asp571Tyr | p.D571Y | Q2TAL8 | protein_coding | deleterious(0) | probably_damaging(0.999) | TCGA-AC-A23H-01 | Breast | breast invasive carcinoma | Female | >=65 | I/II | Unknown | Unknown | PD | |
| QRICH1 | insertion | In_Frame_Ins | novel | c.241_242insTGAGCCACCACGCCCAGCCTTGTTTTGTCTTTG | p.Thr81delinsMetSerHisHisAlaGlnProCysPheValPheAla | p.T81delinsMSHHAQPCFVFA | Q2TAL8 | protein_coding | TCGA-A7-A0CD-01 | Breast | breast invasive carcinoma | Female | >=65 | I/II | Hormone Therapy | arimidex | SD | ||
| QRICH1 | deletion | Frame_Shift_Del | novel | c.349delN | p.Ala117LeufsTer129 | p.A117Lfs*129 | Q2TAL8 | protein_coding | TCGA-EW-A2FV-01 | Breast | breast invasive carcinoma | Female | <65 | III/IV | Chemotherapy | docetaxel | SD | ||
| QRICH1 | SNV | Missense_Mutation | novel | c.846G>C | p.Leu282Phe | p.L282F | Q2TAL8 | protein_coding | deleterious(0) | probably_damaging(0.946) | TCGA-C5-A8YR-01 | Cervix | cervical & endocervical cancer | Female | <65 | I/II | Unknown | Unknown | PD |
| QRICH1 | SNV | Missense_Mutation | rs376240203 | c.713N>T | p.Thr238Met | p.T238M | Q2TAL8 | protein_coding | deleterious(0.02) | benign(0.067) | TCGA-EA-A410-01 | Cervix | cervical & endocervical cancer | Female | <65 | I/II | Unknown | Unknown | SD |
| QRICH1 | SNV | Missense_Mutation | novel | c.1337N>T | p.Ser446Leu | p.S446L | Q2TAL8 | protein_coding | tolerated(0.45) | benign(0.001) | TCGA-VS-A9UC-01 | Cervix | cervical & endocervical cancer | Female | <65 | I/II | Chemotherapy | cisplatin | SD |
| QRICH1 | SNV | Missense_Mutation | c.103N>T | p.Ala35Ser | p.A35S | Q2TAL8 | protein_coding | tolerated(0.29) | probably_damaging(0.968) | TCGA-AA-3673-01 | Colorectum | colon adenocarcinoma | Female | <65 | I/II | Unknown | Unknown | SD | |
| QRICH1 | SNV | Missense_Mutation | c.299N>C | p.Gln100Pro | p.Q100P | Q2TAL8 | protein_coding | tolerated(0.13) | possibly_damaging(0.84) | TCGA-AA-3710-01 | Colorectum | colon adenocarcinoma | Female | >=65 | I/II | Unknown | Unknown | SD |
| Page: 1 2 3 4 5 6 7 8 |
Top |
Related drugs of malignant transformation related genes |
| Identification of chemicals and drugs interact with genes involved in malignant transfromation |
| (DGIdb 4.0) |
| Entrez ID | Symbol | Category | Interaction Types | Drug Claim Name | Drug Name | PMIDs |
| Page: 1 |

Copyright 2023-Present -The University of Texas Health Science Center at Houston |