
|
|||||
|
 | |
| |
| |
| |
| |
| |
|
Gene: QRFPR |
Gene summary for QRFPR |
| Gene information | Species | Human | Gene symbol | QRFPR | Gene ID | 84109 |
| Gene name | pyroglutamylated RFamide peptide receptor | |
| Gene Alias | AQ27 | |
| Cytomap | 4q27 | |
| Gene Type | protein-coding | GO ID | GO:0007154 | UniProtAcc | Q96P65 |
Top |
Malignant transformation analysis |
| Identification of the aberrant gene expression in precancerous and cancerous lesions by comparing the gene expression of stem-like cells in diseased tissues with normal stem cells |
| Entrez ID | Symbol | Replicates | Species | Organ | Tissue | Adj P-value | Log2FC | Malignancy |
| 84109 | QRFPR | LZE21T | Human | Esophagus | ESCC | 9.73e-05 | 2.77e-01 | 0.0655 |
| 84109 | QRFPR | P2T-E | Human | Esophagus | ESCC | 4.31e-06 | 1.27e-01 | 0.1177 |
| 84109 | QRFPR | P4T-E | Human | Esophagus | ESCC | 1.17e-15 | 3.63e-01 | 0.1323 |
| 84109 | QRFPR | P9T-E | Human | Esophagus | ESCC | 1.08e-07 | 2.08e-01 | 0.1131 |
| 84109 | QRFPR | P12T-E | Human | Esophagus | ESCC | 4.31e-06 | 2.51e-01 | 0.1122 |
| 84109 | QRFPR | P15T-E | Human | Esophagus | ESCC | 2.04e-07 | 1.81e-01 | 0.1149 |
| 84109 | QRFPR | P16T-E | Human | Esophagus | ESCC | 2.06e-08 | 1.86e-01 | 0.1153 |
| 84109 | QRFPR | P22T-E | Human | Esophagus | ESCC | 8.56e-12 | 2.49e-01 | 0.1236 |
| 84109 | QRFPR | P23T-E | Human | Esophagus | ESCC | 1.14e-03 | 1.26e-01 | 0.108 |
| 84109 | QRFPR | P26T-E | Human | Esophagus | ESCC | 4.40e-09 | 2.21e-01 | 0.1276 |
| 84109 | QRFPR | P30T-E | Human | Esophagus | ESCC | 3.85e-06 | 2.55e-01 | 0.137 |
| 84109 | QRFPR | P31T-E | Human | Esophagus | ESCC | 4.30e-10 | 2.55e-01 | 0.1251 |
| 84109 | QRFPR | P32T-E | Human | Esophagus | ESCC | 2.93e-15 | 3.24e-01 | 0.1666 |
| 84109 | QRFPR | P48T-E | Human | Esophagus | ESCC | 2.03e-09 | 2.38e-01 | 0.0959 |
| 84109 | QRFPR | P49T-E | Human | Esophagus | ESCC | 7.97e-13 | 1.11e+00 | 0.1768 |
| 84109 | QRFPR | P62T-E | Human | Esophagus | ESCC | 4.85e-19 | 3.75e-01 | 0.1302 |
| 84109 | QRFPR | P74T-E | Human | Esophagus | ESCC | 2.44e-20 | 5.16e-01 | 0.1479 |
| 84109 | QRFPR | P76T-E | Human | Esophagus | ESCC | 9.02e-11 | 2.94e-01 | 0.1207 |
| 84109 | QRFPR | P107T-E | Human | Esophagus | ESCC | 5.52e-09 | 2.56e-01 | 0.171 |
| 84109 | QRFPR | HCC1 | Human | Liver | HCC | 1.73e-10 | 1.04e+00 | 0.5336 |
| Page: 1 2 |
| Tissue | Expression Dynamics | Abbreviation |
| Esophagus | 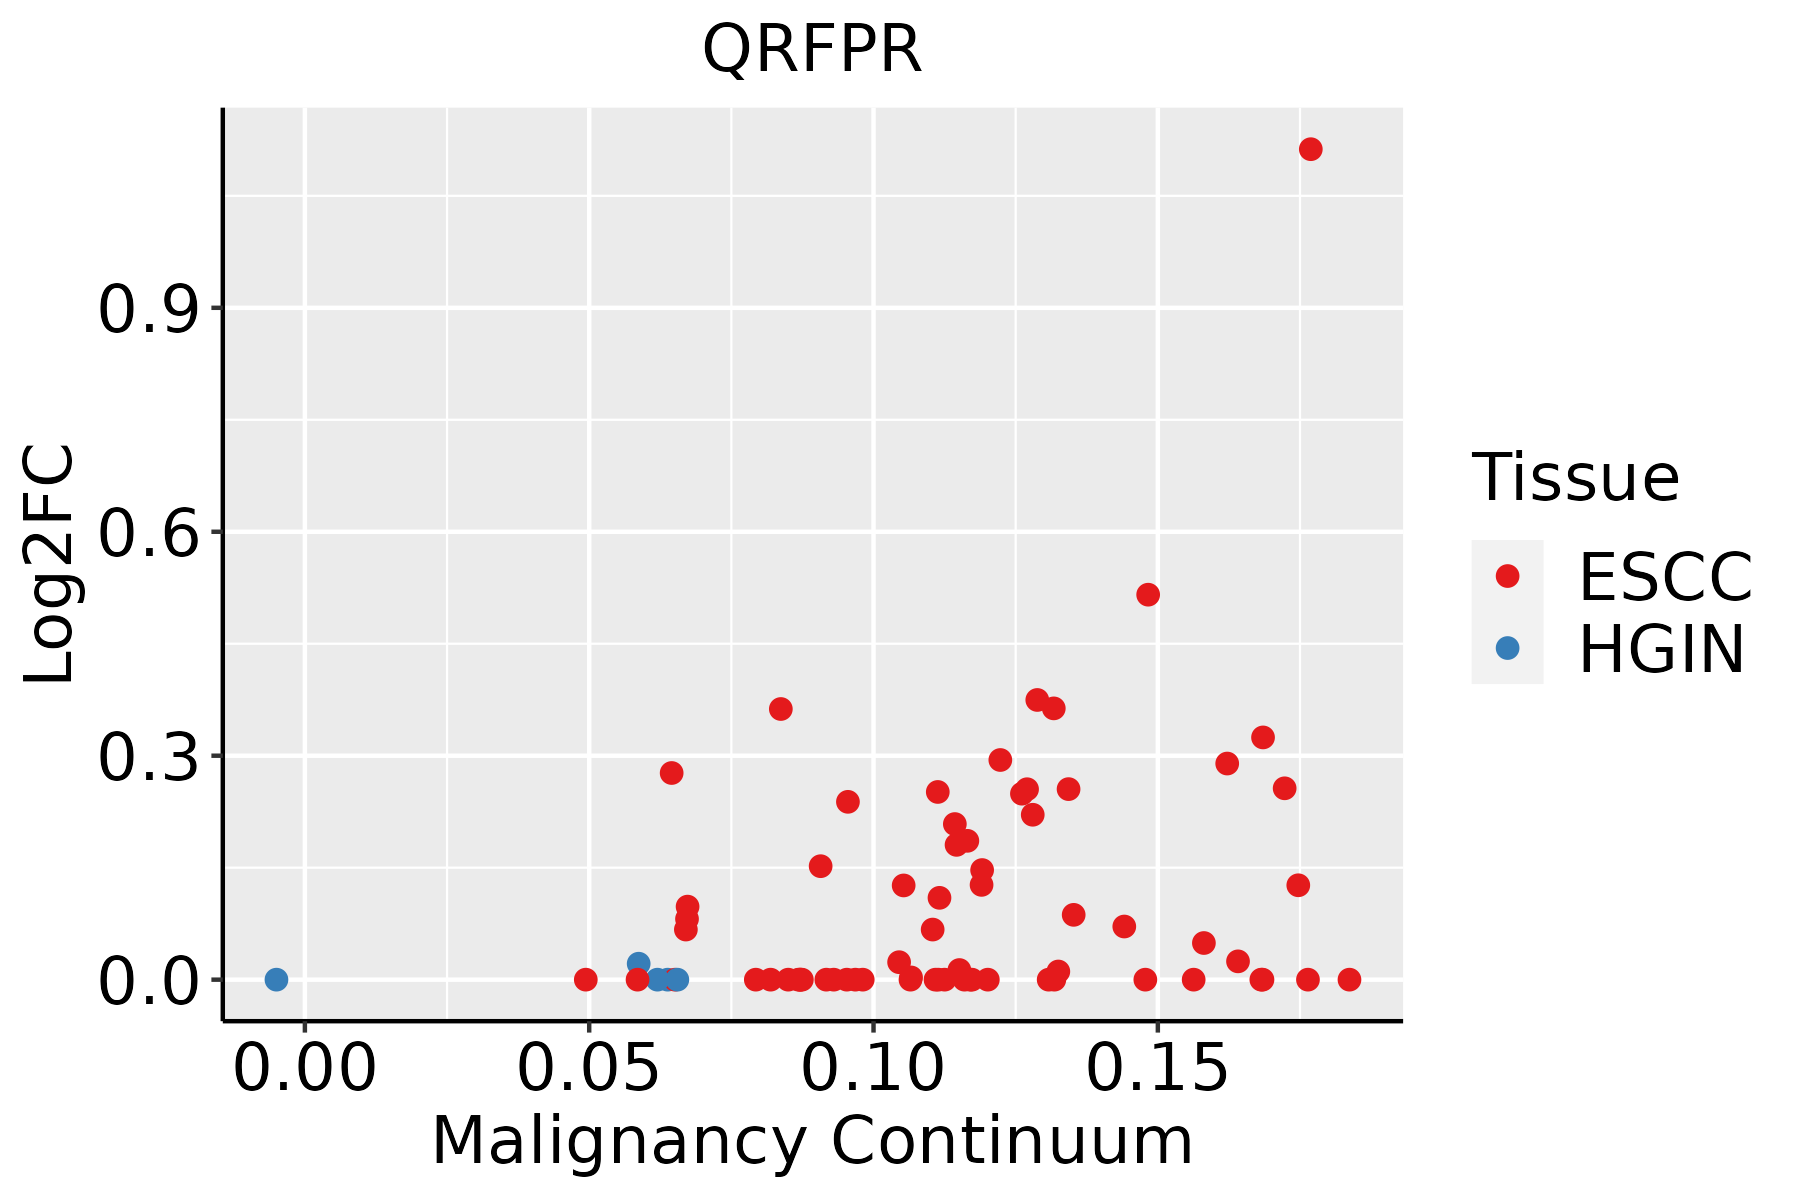 | ESCC: Esophageal squamous cell carcinoma |
| HGIN: High-grade intraepithelial neoplasias | ||
| LGIN: Low-grade intraepithelial neoplasias | ||
| Liver |  | HCC: Hepatocellular carcinoma |
| NAFLD: Non-alcoholic fatty liver disease |
| ∗log2FC in expression of this searched gene in stem-like cells from each diseased tissue sample relative to stem-like cells in normal samples in each tissue plotted against the malignancy continuum. Samples are colored based on if they are from different disease stage. |
Top |
Malignant transformation related pathway analysis |
| Find out the enriched GO biological processes and KEGG pathways involved in transition from healthy to precancer to cancer |
| Tissue | Disease Stage | Enriched GO biological Processes |
| Colorectum | AD |  |
| Colorectum | SER |  |
| Colorectum | MSS |  |
| Colorectum | MSI-H |  |
| Colorectum | FAP |  |
| ∗Top 15 enriched GO BP terms are showed in the bar plot of each disease state in each tissue. Each row represents a significant GO biological process which is colored according to the -log10(p.adjust). |
| Page: 1 2 3 4 5 6 7 8 9 |
| GO ID | Tissue | Disease Stage | Description | Gene Ratio | Bg Ratio | pvalue | p.adjust | Count |
| Page: 1 |
| Pathway ID | Tissue | Disease Stage | Description | Gene Ratio | Bg Ratio | pvalue | p.adjust | qvalue | Count |
| Page: 1 |
Top |
Cell-cell communication analysis |
| Identification of potential cell-cell interactions between two cell types and their ligand-receptor pairs for different disease states |
| Ligand | Receptor | LRpair | Pathway | Tissue | Disease Stage |
| Page: 1 |
Top |
Single-cell gene regulatory network inference analysis |
| Find out the significant the regulons (TFs) and the target genes of each regulon across cell types for different disease states |
| TF | Cell Type | Tissue | Disease Stage | Target Gene | RSS | Regulon Activity |
| ∗The dot plots of a searched regulon are shown for all cell subpopulations in each disease state of each tissue based on the regulon specific score inferred using pySCENIC and by calculating the average expression. |
| Page: 1 |
Top |
Somatic mutation of malignant transformation related genes |
| Annotation of somatic variants for genes involved in malignant transformation |
| Hugo Symbol | Variant Class | Variant Classification | dbSNP RS | HGVSc | HGVSp | HGVSp Short | SWISSPROT | BIOTYPE | SIFT | PolyPhen | Tumor Sample Barcode | Tissue | Histology | Sex | Age | Stage | Therapy Types | Drugs | Outcome |
| QRFPR | SNV | Missense_Mutation | rs543792498 | c.761N>A | p.Arg254Gln | p.R254Q | Q96P65 | protein_coding | tolerated(1) | benign(0.003) | TCGA-AR-A1AJ-01 | Breast | breast invasive carcinoma | Female | >=65 | I/II | Unknown | Unknown | SD |
| QRFPR | insertion | Nonsense_Mutation | novel | c.1_2insGTTTGAAAGTGCAGTGAGTCTGGCCAGGCGTGG | p.Met1? | p.M1? | Q96P65 | protein_coding | TCGA-AN-A0FN-01 | Breast | breast invasive carcinoma | Female | <65 | I/II | Unknown | Unknown | SD | ||
| QRFPR | insertion | Nonsense_Mutation | novel | c.974_975insTTGTTGTATGACTGGCAAGTAACGTCGCCT | p.Ser325_Ile326insCysCysMetThrGlyLysTerArgArgLeu | p.S325_I326insCCMTGK*RRL | Q96P65 | protein_coding | TCGA-BH-A0HK-01 | Breast | breast invasive carcinoma | Female | >=65 | I/II | Hormone Therapy | arimidex | SD | ||
| QRFPR | insertion | Frame_Shift_Ins | novel | c.29_30insAT | p.Phe11CysfsTer11 | p.F11Cfs*11 | Q96P65 | protein_coding | TCGA-BH-A0HX-01 | Breast | breast invasive carcinoma | Female | <65 | I/II | Chemotherapy | adrimycin | SD | ||
| QRFPR | SNV | Missense_Mutation | rs781644429 | c.89G>A | p.Arg30Gln | p.R30Q | Q96P65 | protein_coding | tolerated(0.24) | benign(0) | TCGA-Q1-A5R2-01 | Cervix | cervical & endocervical cancer | Female | <65 | I/II | Chemotherapy | cisplatin | PR |
| QRFPR | SNV | Missense_Mutation | c.47N>A | p.Arg16Gln | p.R16Q | Q96P65 | protein_coding | tolerated(0.43) | benign(0.003) | TCGA-A6-5661-01 | Colorectum | colon adenocarcinoma | Female | >=65 | I/II | Unknown | Unknown | SD | |
| QRFPR | SNV | Missense_Mutation | c.127C>T | p.Arg43Cys | p.R43C | Q96P65 | protein_coding | tolerated(0.18) | benign(0.431) | TCGA-A6-5665-01 | Colorectum | colon adenocarcinoma | Female | >=65 | I/II | Unknown | Unknown | PD | |
| QRFPR | SNV | Missense_Mutation | novel | c.215G>A | p.Arg72His | p.R72H | Q96P65 | protein_coding | deleterious(0.01) | probably_damaging(0.987) | TCGA-A6-6781-01 | Colorectum | colon adenocarcinoma | Male | <65 | III/IV | Chemotherapy | oxaliplatin | SD |
| QRFPR | SNV | Missense_Mutation | novel | c.841C>A | p.Leu281Ile | p.L281I | Q96P65 | protein_coding | deleterious(0.01) | probably_damaging(0.97) | TCGA-AA-3710-01 | Colorectum | colon adenocarcinoma | Female | >=65 | I/II | Unknown | Unknown | SD |
| QRFPR | SNV | Missense_Mutation | c.364N>T | p.Pro122Ser | p.P122S | Q96P65 | protein_coding | tolerated(0.11) | benign(0.099) | TCGA-AA-A010-01 | Colorectum | colon adenocarcinoma | Female | <65 | I/II | Chemotherapy | folinic | CR |
| Page: 1 2 3 4 5 6 7 8 9 |
Top |
Related drugs of malignant transformation related genes |
| Identification of chemicals and drugs interact with genes involved in malignant transfromation |
| (DGIdb 4.0) |
| Entrez ID | Symbol | Category | Interaction Types | Drug Claim Name | Drug Name | PMIDs |
| 84109 | QRFPR | G PROTEIN COUPLED RECEPTOR, DRUGGABLE GENOME | agonist | 178102518 | ||
| 84109 | QRFPR | G PROTEIN COUPLED RECEPTOR, DRUGGABLE GENOME | agonist | 329968382 | ||
| 84109 | QRFPR | G PROTEIN COUPLED RECEPTOR, DRUGGABLE GENOME | agonist | 135651878 | ||
| 84109 | QRFPR | G PROTEIN COUPLED RECEPTOR, DRUGGABLE GENOME | antagonist | 329968383 | ||
| 84109 | QRFPR | G PROTEIN COUPLED RECEPTOR, DRUGGABLE GENOME | agonist | 135651879 | ||
| 84109 | QRFPR | G PROTEIN COUPLED RECEPTOR, DRUGGABLE GENOME | agonist | 381744935 | ||
| 84109 | QRFPR | G PROTEIN COUPLED RECEPTOR, DRUGGABLE GENOME | agonist | 381744934 | ||
| 84109 | QRFPR | G PROTEIN COUPLED RECEPTOR, DRUGGABLE GENOME | agonist | 178100650 |
| Page: 1 |

Copyright 2023-Present -The University of Texas Health Science Center at Houston |