
|
|||||
|
 | |
| |
| |
| |
| |
| |
|
Gene: QPRT |
Gene summary for QPRT |
| Gene information | Species | Human | Gene symbol | QPRT | Gene ID | 23475 |
| Gene name | quinolinate phosphoribosyltransferase | |
| Gene Alias | HEL-S-90n | |
| Cytomap | 16p11.2 | |
| Gene Type | protein-coding | GO ID | GO:0006082 | UniProtAcc | B4DDH4 |
Top |
Malignant transformation analysis |
| Identification of the aberrant gene expression in precancerous and cancerous lesions by comparing the gene expression of stem-like cells in diseased tissues with normal stem cells |
| Entrez ID | Symbol | Replicates | Species | Organ | Tissue | Adj P-value | Log2FC | Malignancy |
| 23475 | QPRT | GSM4909281 | Human | Breast | IDC | 1.17e-11 | 2.97e-01 | 0.21 |
| 23475 | QPRT | GSM4909285 | Human | Breast | IDC | 6.76e-18 | 3.02e-01 | 0.21 |
| 23475 | QPRT | GSM4909290 | Human | Breast | IDC | 7.58e-21 | 5.90e-01 | 0.2096 |
| 23475 | QPRT | GSM4909291 | Human | Breast | IDC | 5.46e-11 | 5.21e-01 | 0.1753 |
| 23475 | QPRT | GSM4909293 | Human | Breast | IDC | 9.97e-08 | 2.01e-01 | 0.1581 |
| 23475 | QPRT | GSM4909298 | Human | Breast | IDC | 3.98e-02 | 8.97e-02 | 0.1551 |
| 23475 | QPRT | GSM4909306 | Human | Breast | IDC | 8.48e-20 | 4.28e-01 | 0.1564 |
| 23475 | QPRT | GSM4909307 | Human | Breast | IDC | 2.13e-06 | 2.30e-01 | 0.1569 |
| 23475 | QPRT | GSM4909308 | Human | Breast | IDC | 9.51e-15 | 3.99e-01 | 0.158 |
| 23475 | QPRT | GSM4909315 | Human | Breast | IDC | 1.72e-12 | 3.18e-01 | 0.21 |
| 23475 | QPRT | GSM4909317 | Human | Breast | IDC | 3.35e-05 | 2.86e-01 | 0.1355 |
| 23475 | QPRT | GSM4909321 | Human | Breast | IDC | 1.03e-03 | 2.72e-01 | 0.1559 |
| 23475 | QPRT | P2 | Human | Breast | IDC | 1.59e-05 | 4.51e-01 | 0.21 |
| 23475 | QPRT | HTA11_3410_2000001011 | Human | Colorectum | AD | 6.46e-04 | 2.30e-01 | 0.0155 |
| 23475 | QPRT | HTA11_347_2000001011 | Human | Colorectum | AD | 1.54e-16 | 5.35e-01 | -0.1954 |
| 23475 | QPRT | HTA11_696_2000001011 | Human | Colorectum | AD | 3.99e-10 | 4.51e-01 | -0.1464 |
| 23475 | QPRT | HTA11_1391_2000001011 | Human | Colorectum | AD | 3.22e-02 | 3.48e-01 | -0.059 |
| 23475 | QPRT | HTA11_2992_2000001011 | Human | Colorectum | SER | 4.27e-02 | 2.92e-01 | -0.1706 |
| 23475 | QPRT | HTA11_5212_2000001011 | Human | Colorectum | AD | 3.66e-03 | 4.38e-01 | -0.2061 |
| 23475 | QPRT | HTA11_866_3004761011 | Human | Colorectum | AD | 5.76e-17 | 6.79e-01 | 0.096 |
| Page: 1 2 3 4 |
| Tissue | Expression Dynamics | Abbreviation |
| Breast | 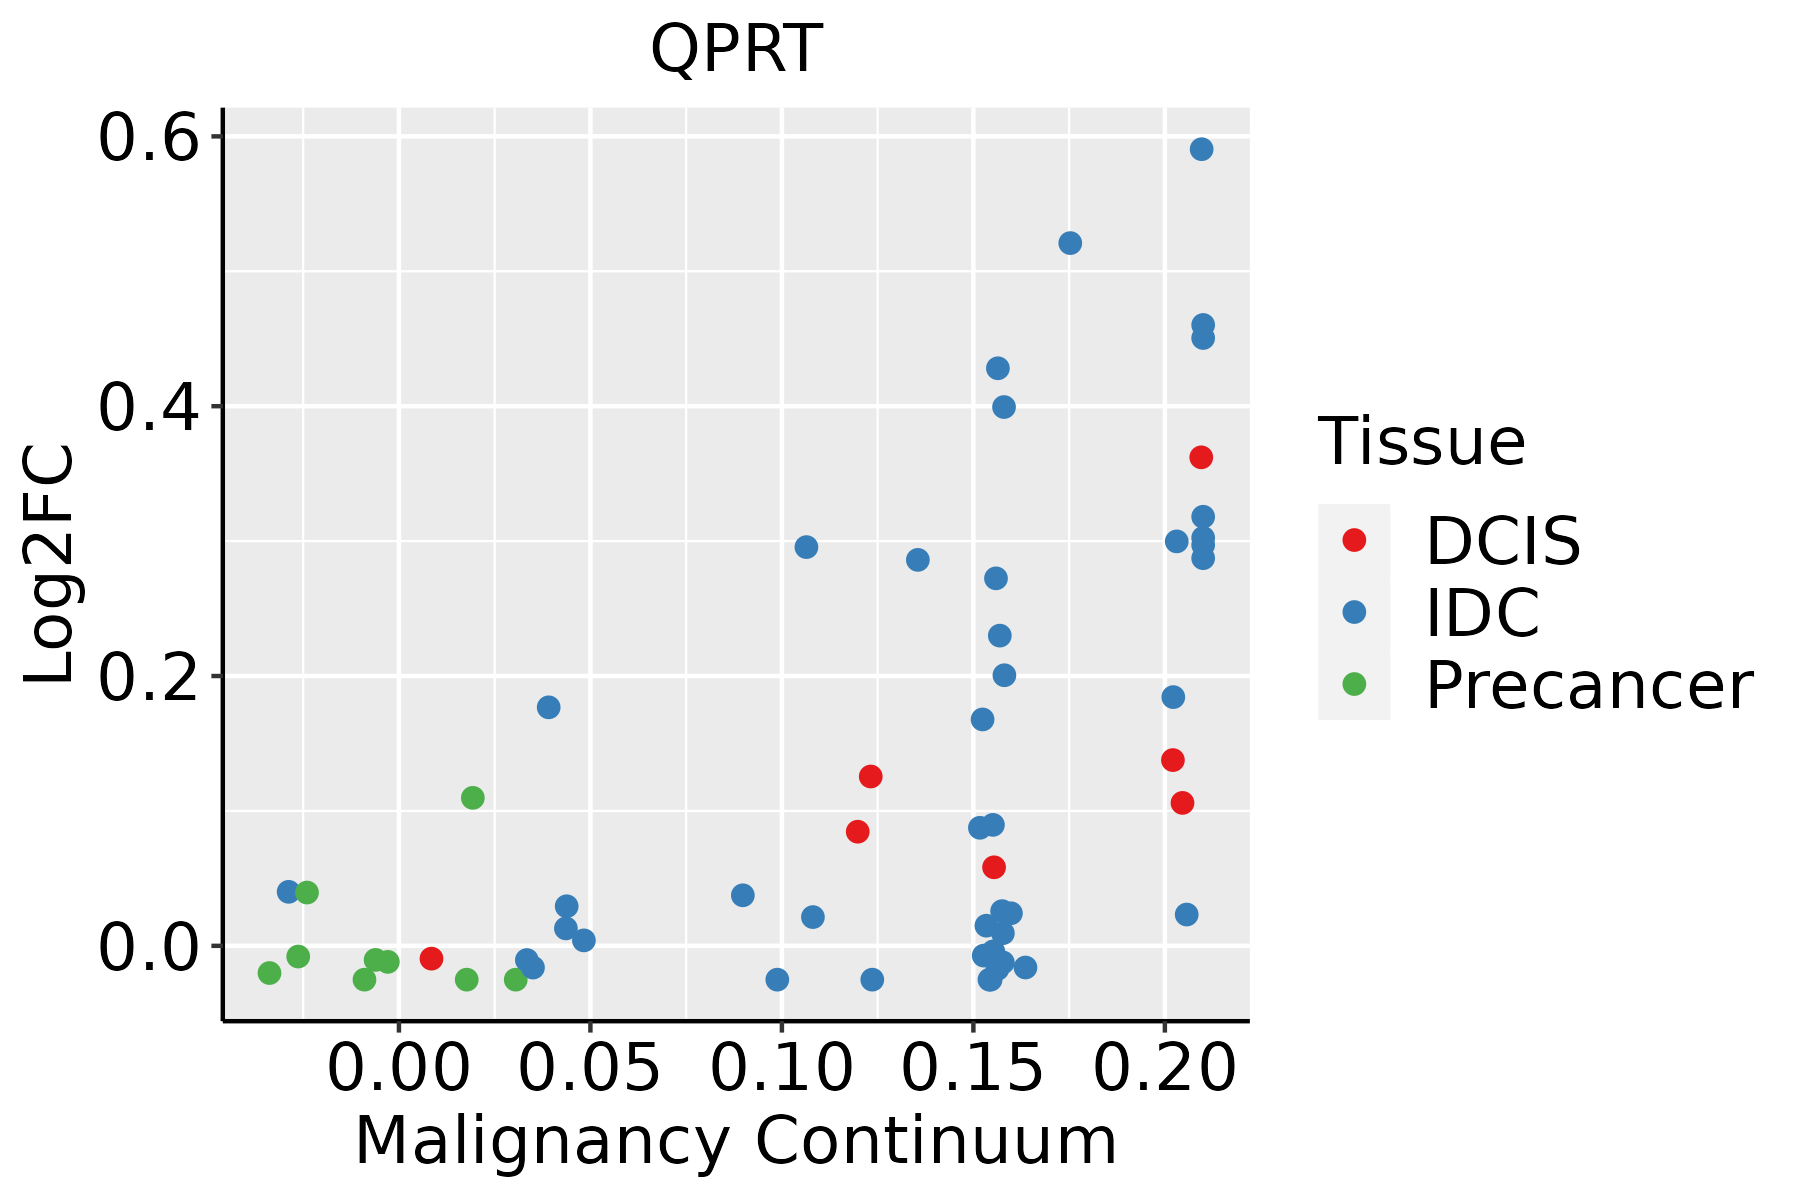 | IDC: Invasive ductal carcinoma |
| DCIS: Ductal carcinoma in situ | ||
| Precancer(BRCA1-mut): Precancerous lesion from BRCA1 mutation carriers | ||
| Colorectum (GSE201348) |  | FAP: Familial adenomatous polyposis |
| CRC: Colorectal cancer | ||
| Colorectum (HTA11) |  | AD: Adenomas |
| SER: Sessile serrated lesions | ||
| MSI-H: Microsatellite-high colorectal cancer | ||
| MSS: Microsatellite stable colorectal cancer | ||
| Endometrium | 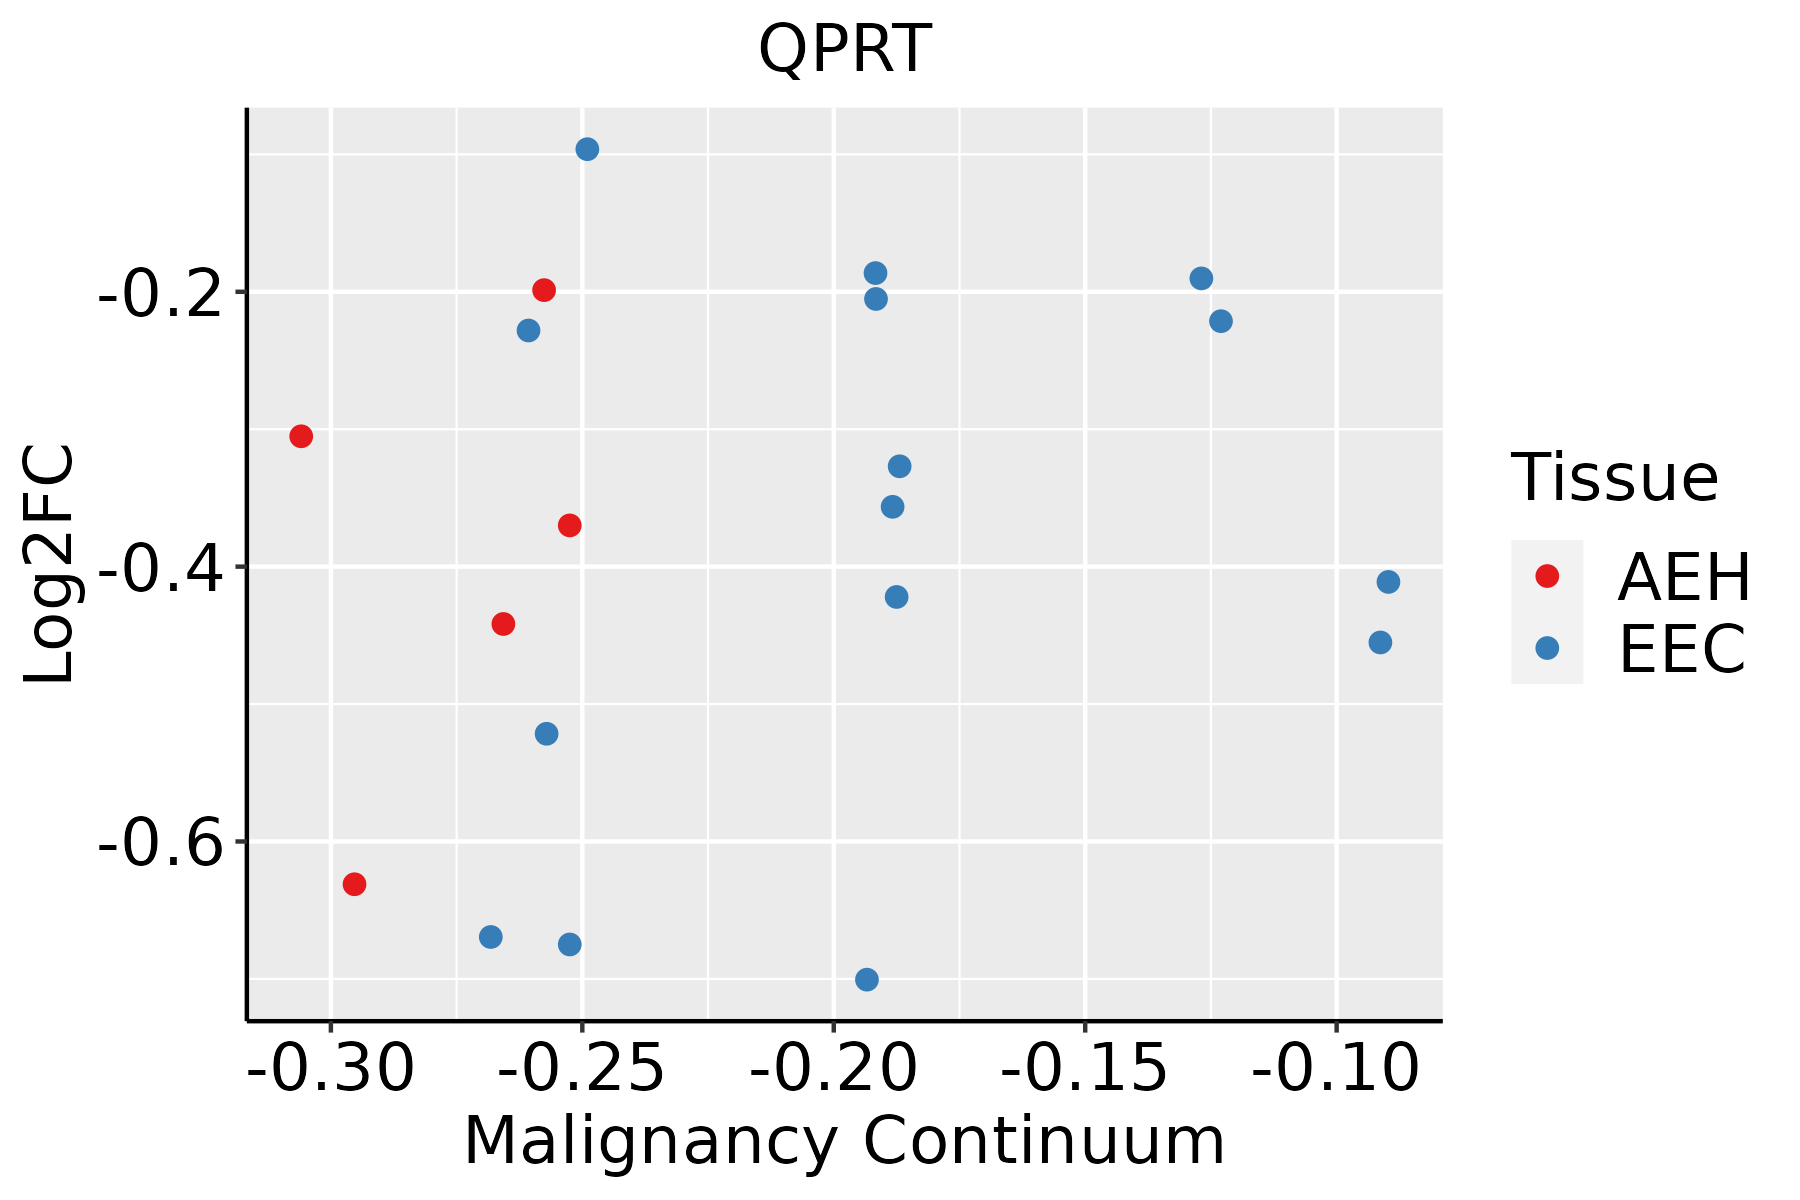 | AEH: Atypical endometrial hyperplasia |
| EEC: Endometrioid Cancer | ||
| Liver | 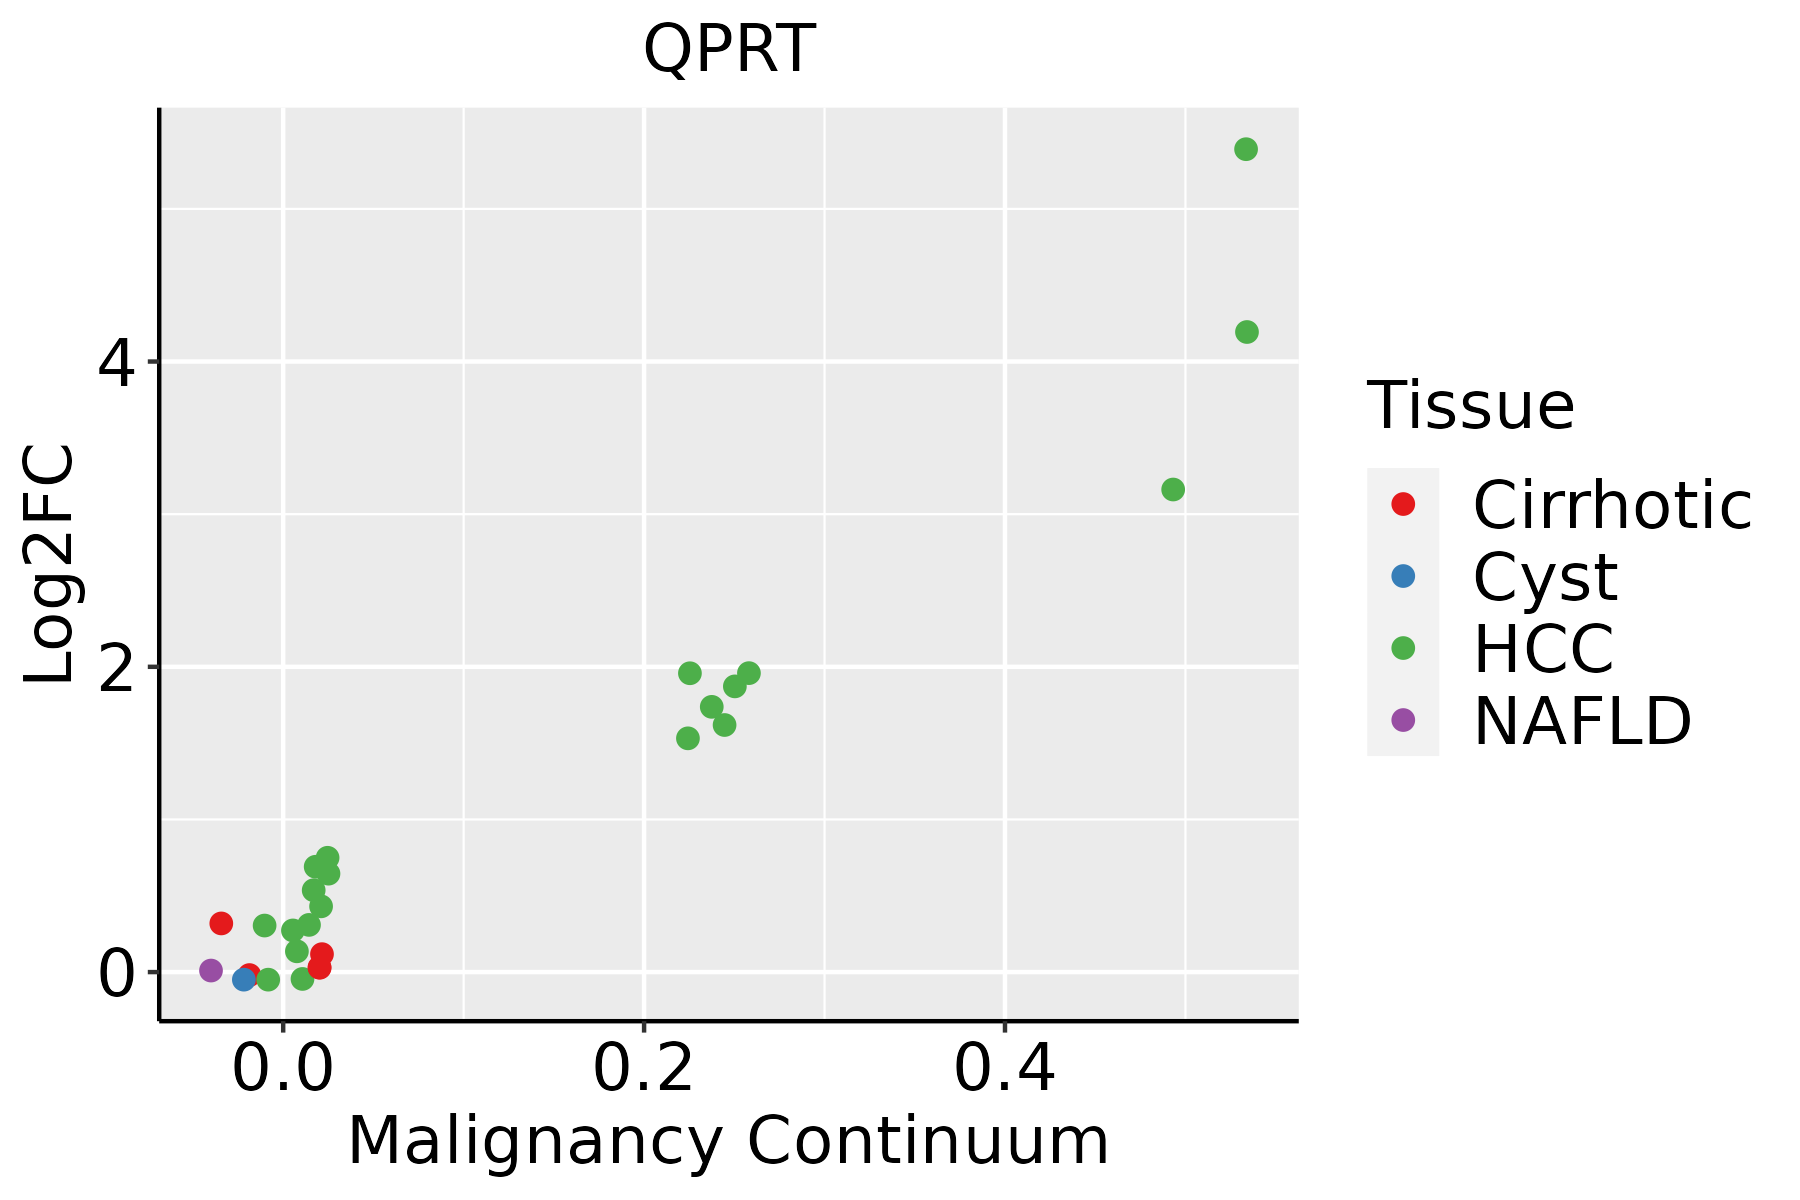 | HCC: Hepatocellular carcinoma |
| NAFLD: Non-alcoholic fatty liver disease | ||
| Thyroid |  | ATC: Anaplastic thyroid cancer |
| HT: Hashimoto's thyroiditis | ||
| PTC: Papillary thyroid cancer |
| ∗log2FC in expression of this searched gene in stem-like cells from each diseased tissue sample relative to stem-like cells in normal samples in each tissue plotted against the malignancy continuum. Samples are colored based on if they are from different disease stage. |
Top |
Malignant transformation related pathway analysis |
| Find out the enriched GO biological processes and KEGG pathways involved in transition from healthy to precancer to cancer |
| Tissue | Disease Stage | Enriched GO biological Processes |
| Colorectum | AD |  |
| Colorectum | SER |  |
| Colorectum | MSS |  |
| Colorectum | MSI-H |  |
| Colorectum | FAP |  |
| ∗Top 15 enriched GO BP terms are showed in the bar plot of each disease state in each tissue. Each row represents a significant GO biological process which is colored according to the -log10(p.adjust). |
| Page: 1 2 3 4 5 6 7 8 9 |
| GO ID | Tissue | Disease Stage | Description | Gene Ratio | Bg Ratio | pvalue | p.adjust | Count |
| GO:000675313 | Breast | IDC | nucleoside phosphate metabolic process | 68/1434 | 497/18723 | 2.01e-06 | 8.23e-05 | 68 |
| GO:000911713 | Breast | IDC | nucleotide metabolic process | 67/1434 | 489/18723 | 2.28e-06 | 9.05e-05 | 67 |
| GO:190129313 | Breast | IDC | nucleoside phosphate biosynthetic process | 41/1434 | 256/18723 | 5.15e-06 | 1.73e-04 | 41 |
| GO:000916513 | Breast | IDC | nucleotide biosynthetic process | 40/1434 | 254/18723 | 1.01e-05 | 2.81e-04 | 40 |
| GO:190136112 | Breast | IDC | organic cyclic compound catabolic process | 56/1434 | 495/18723 | 2.12e-03 | 1.99e-02 | 56 |
| GO:004670012 | Breast | IDC | heterocycle catabolic process | 51/1434 | 445/18723 | 2.51e-03 | 2.25e-02 | 51 |
| GO:004427012 | Breast | IDC | cellular nitrogen compound catabolic process | 50/1434 | 451/18723 | 5.29e-03 | 3.93e-02 | 50 |
| GO:0009117 | Colorectum | AD | nucleotide metabolic process | 168/3918 | 489/18723 | 2.20e-12 | 3.36e-10 | 168 |
| GO:0006753 | Colorectum | AD | nucleoside phosphate metabolic process | 169/3918 | 497/18723 | 4.99e-12 | 6.98e-10 | 169 |
| GO:0044270 | Colorectum | AD | cellular nitrogen compound catabolic process | 147/3918 | 451/18723 | 3.35e-09 | 2.23e-07 | 147 |
| GO:0046700 | Colorectum | AD | heterocycle catabolic process | 145/3918 | 445/18723 | 4.37e-09 | 2.84e-07 | 145 |
| GO:1901361 | Colorectum | AD | organic cyclic compound catabolic process | 153/3918 | 495/18723 | 8.23e-08 | 4.18e-06 | 153 |
| GO:0044282 | Colorectum | AD | small molecule catabolic process | 118/3918 | 376/18723 | 1.05e-06 | 3.55e-05 | 118 |
| GO:1901293 | Colorectum | AD | nucleoside phosphate biosynthetic process | 80/3918 | 256/18723 | 6.31e-05 | 1.05e-03 | 80 |
| GO:0009165 | Colorectum | AD | nucleotide biosynthetic process | 79/3918 | 254/18723 | 8.33e-05 | 1.30e-03 | 79 |
| GO:0016054 | Colorectum | AD | organic acid catabolic process | 73/3918 | 240/18723 | 3.20e-04 | 3.81e-03 | 73 |
| GO:0019674 | Colorectum | AD | NAD metabolic process | 15/3918 | 30/18723 | 3.85e-04 | 4.39e-03 | 15 |
| GO:0043648 | Colorectum | AD | dicarboxylic acid metabolic process | 34/3918 | 96/18723 | 7.22e-04 | 7.28e-03 | 34 |
| GO:0046395 | Colorectum | AD | carboxylic acid catabolic process | 70/3918 | 236/18723 | 9.06e-04 | 8.71e-03 | 70 |
| GO:00091171 | Colorectum | SER | nucleotide metabolic process | 122/2897 | 489/18723 | 2.50e-08 | 1.76e-06 | 122 |
| Page: 1 2 3 4 |
| Pathway ID | Tissue | Disease Stage | Description | Gene Ratio | Bg Ratio | pvalue | p.adjust | qvalue | Count |
| hsa012402 | Liver | HCC | Biosynthesis of cofactors | 103/4020 | 153/8465 | 4.67e-07 | 5.05e-06 | 2.81e-06 | 103 |
| hsa012403 | Liver | HCC | Biosynthesis of cofactors | 103/4020 | 153/8465 | 4.67e-07 | 5.05e-06 | 2.81e-06 | 103 |
| Page: 1 |
Top |
Cell-cell communication analysis |
| Identification of potential cell-cell interactions between two cell types and their ligand-receptor pairs for different disease states |
| Ligand | Receptor | LRpair | Pathway | Tissue | Disease Stage |
| Page: 1 |
Top |
Single-cell gene regulatory network inference analysis |
| Find out the significant the regulons (TFs) and the target genes of each regulon across cell types for different disease states |
| TF | Cell Type | Tissue | Disease Stage | Target Gene | RSS | Regulon Activity |
| ∗The dot plots of a searched regulon are shown for all cell subpopulations in each disease state of each tissue based on the regulon specific score inferred using pySCENIC and by calculating the average expression. |
| Page: 1 |
Top |
Somatic mutation of malignant transformation related genes |
| Annotation of somatic variants for genes involved in malignant transformation |
| Hugo Symbol | Variant Class | Variant Classification | dbSNP RS | HGVSc | HGVSp | HGVSp Short | SWISSPROT | BIOTYPE | SIFT | PolyPhen | Tumor Sample Barcode | Tissue | Histology | Sex | Age | Stage | Therapy Types | Drugs | Outcome |
| QPRT | SNV | Missense_Mutation | novel | c.454N>A | p.Leu152Ile | p.L152I | Q15274 | protein_coding | tolerated(0.07) | probably_damaging(0.99) | TCGA-DS-A1OC-01 | Cervix | cervical & endocervical cancer | Female | <65 | I/II | Chemotherapy | gemcitabine | SD |
| QPRT | SNV | Missense_Mutation | c.215N>G | p.Ser72Cys | p.S72C | Q15274 | protein_coding | deleterious(0) | possibly_damaging(0.646) | TCGA-JW-A5VL-01 | Cervix | cervical & endocervical cancer | Female | <65 | I/II | Unknown | Unknown | SD | |
| QPRT | SNV | Missense_Mutation | c.532N>A | p.Ala178Thr | p.A178T | Q15274 | protein_coding | tolerated(0.48) | benign(0.413) | TCGA-A6-6141-01 | Colorectum | colon adenocarcinoma | Male | <65 | I/II | Chemotherapy | 5-fu | SD | |
| QPRT | SNV | Missense_Mutation | novel | c.131C>T | p.Ala44Val | p.A44V | Q15274 | protein_coding | deleterious(0) | probably_damaging(0.995) | TCGA-AA-3862-01 | Colorectum | colon adenocarcinoma | Male | >=65 | I/II | Unknown | Unknown | SD |
| QPRT | SNV | Missense_Mutation | rs370631780 | c.7N>A | p.Ala3Thr | p.A3T | Q15274 | protein_coding | tolerated(0.46) | benign(0) | TCGA-AA-3877-01 | Colorectum | colon adenocarcinoma | Female | >=65 | I/II | Unknown | Unknown | SD |
| QPRT | insertion | Frame_Shift_Ins | rs757852504 | c.376_377insG | p.Ala128GlyfsTer46 | p.A128Gfs*46 | Q15274 | protein_coding | TCGA-AD-6964-01 | Colorectum | colon adenocarcinoma | Male | <65 | III/IV | Chemotherapy | folfox | PD | ||
| QPRT | SNV | Missense_Mutation | rs761729022 | c.248N>T | p.Pro83Leu | p.P83L | Q15274 | protein_coding | deleterious(0.03) | probably_damaging(0.999) | TCGA-AJ-A3BH-01 | Endometrium | uterine corpus endometrioid carcinoma | Female | Unknown | I/II | Unknown | Unknown | SD |
| QPRT | SNV | Missense_Mutation | c.871N>A | p.Ala291Thr | p.A291T | Q15274 | protein_coding | tolerated(1) | benign(0) | TCGA-AP-A056-01 | Endometrium | uterine corpus endometrioid carcinoma | Female | <65 | I/II | Unknown | Unknown | SD | |
| QPRT | SNV | Missense_Mutation | rs769151674 | c.766C>A | p.Leu256Ile | p.L256I | Q15274 | protein_coding | tolerated(0.57) | probably_damaging(0.993) | TCGA-AP-A1DK-01 | Endometrium | uterine corpus endometrioid carcinoma | Female | <65 | I/II | Unknown | Unknown | SD |
| QPRT | SNV | Missense_Mutation | novel | c.236C>T | p.Ser79Leu | p.S79L | Q15274 | protein_coding | deleterious(0.04) | benign(0.278) | TCGA-AP-A1DV-01 | Endometrium | uterine corpus endometrioid carcinoma | Female | <65 | I/II | Unknown | Unknown | SD |
| Page: 1 2 |
Top |
Related drugs of malignant transformation related genes |
| Identification of chemicals and drugs interact with genes involved in malignant transfromation |
| (DGIdb 4.0) |
| Entrez ID | Symbol | Category | Interaction Types | Drug Claim Name | Drug Name | PMIDs |
| 23475 | QPRT | ENZYME | ARI-3037MO | |||
| 23475 | QPRT | ENZYME | NIACIN | NIACIN |
| Page: 1 |

Copyright 2023-Present -The University of Texas Health Science Center at Houston |