
|
|||||
|
 | |
| |
| |
| |
| |
| |
|
Gene: QPCTL |
Gene summary for QPCTL |
| Gene information | Species | Human | Gene symbol | QPCTL | Gene ID | 54814 |
| Gene name | glutaminyl-peptide cyclotransferase like | |
| Gene Alias | gQC | |
| Cytomap | 19q13.32 | |
| Gene Type | protein-coding | GO ID | GO:0006464 | UniProtAcc | Q9NXS2 |
Top |
Malignant transformation analysis |
| Identification of the aberrant gene expression in precancerous and cancerous lesions by comparing the gene expression of stem-like cells in diseased tissues with normal stem cells |
| Entrez ID | Symbol | Replicates | Species | Organ | Tissue | Adj P-value | Log2FC | Malignancy |
| 54814 | QPCTL | HCC1 | Human | Liver | HCC | 2.79e-04 | 7.57e-01 | 0.5336 |
| 54814 | QPCTL | HCC2 | Human | Liver | HCC | 2.48e-14 | 1.23e+00 | 0.5341 |
| 54814 | QPCTL | HCC5 | Human | Liver | HCC | 5.96e-11 | 6.90e-01 | 0.4932 |
| Page: 1 |
| Tissue | Expression Dynamics | Abbreviation |
| Liver | 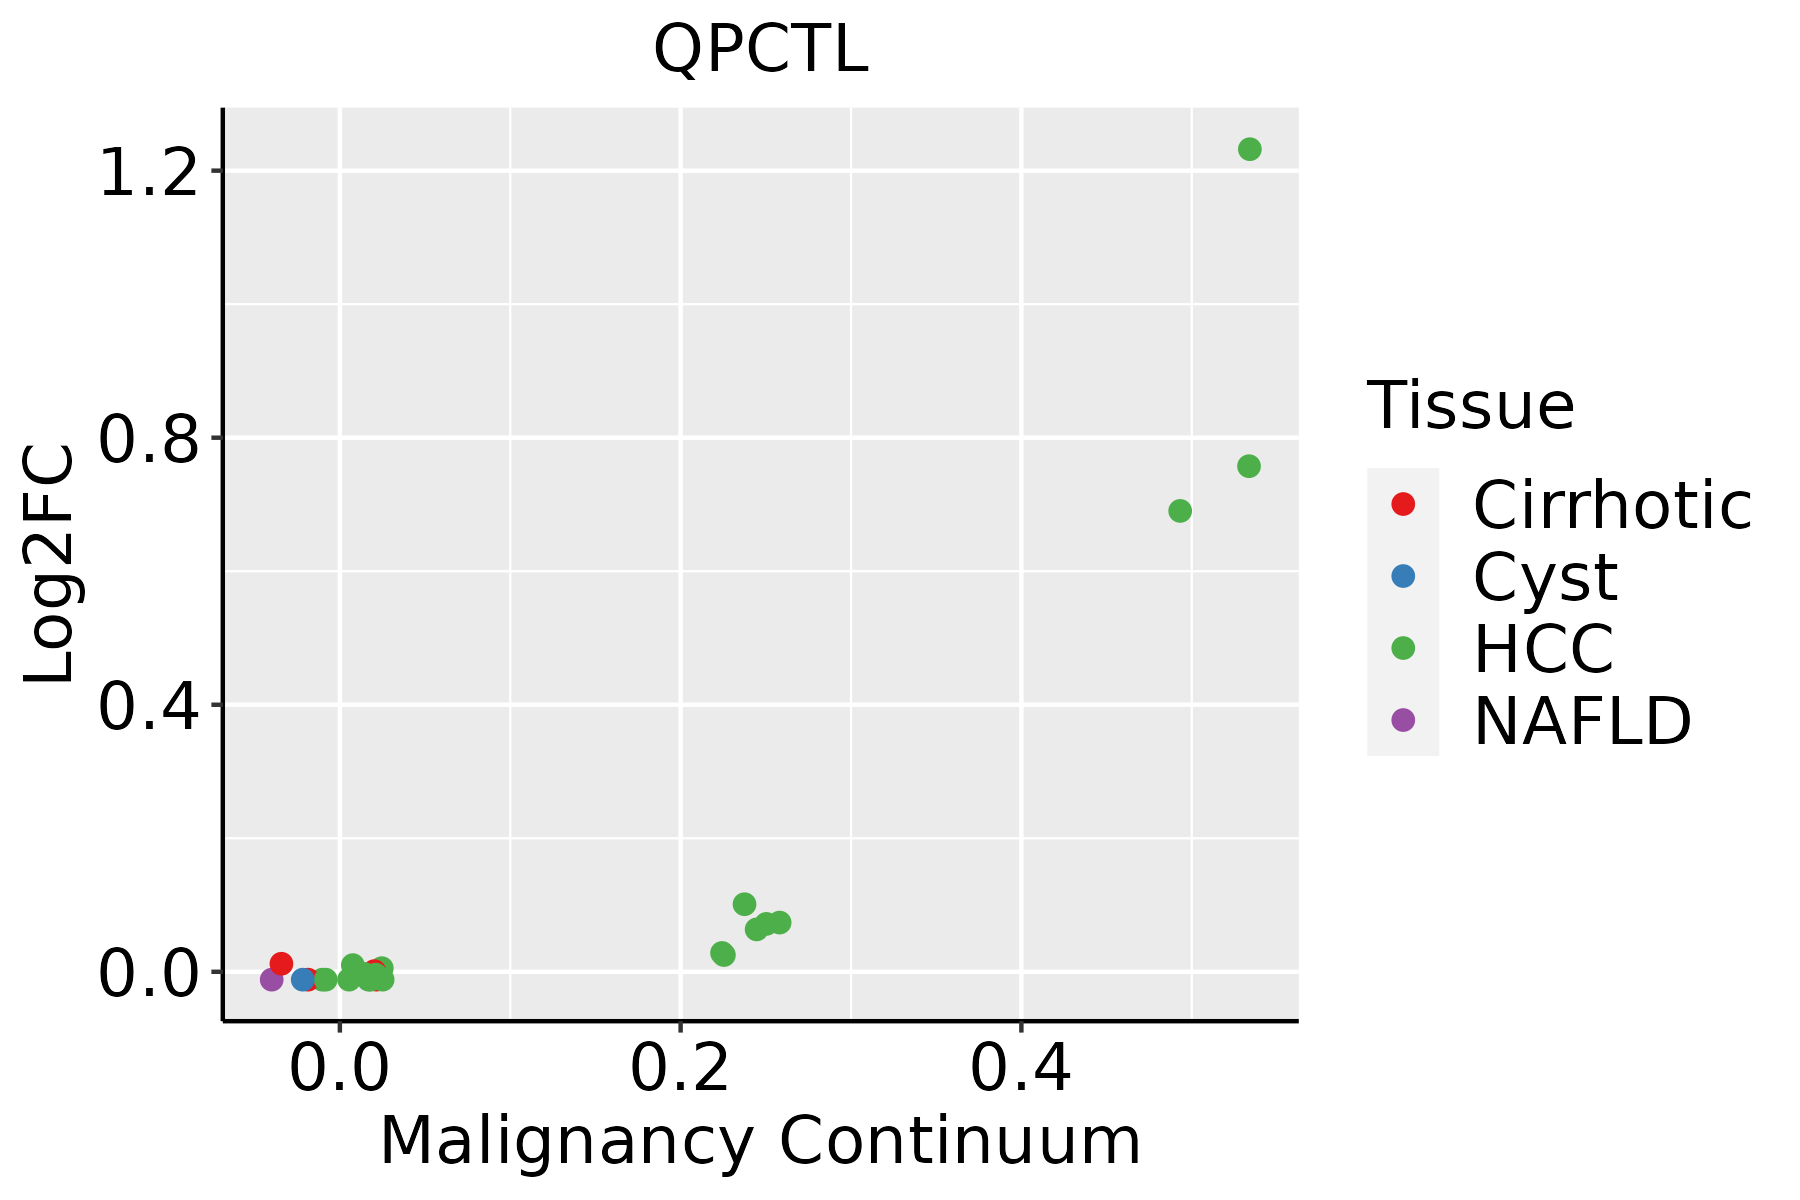 | HCC: Hepatocellular carcinoma |
| NAFLD: Non-alcoholic fatty liver disease |
| ∗log2FC in expression of this searched gene in stem-like cells from each diseased tissue sample relative to stem-like cells in normal samples in each tissue plotted against the malignancy continuum. Samples are colored based on if they are from different disease stage. |
Top |
Malignant transformation related pathway analysis |
| Find out the enriched GO biological processes and KEGG pathways involved in transition from healthy to precancer to cancer |
| Tissue | Disease Stage | Enriched GO biological Processes |
| Colorectum | AD |  |
| Colorectum | SER |  |
| Colorectum | MSS |  |
| Colorectum | MSI-H |  |
| Colorectum | FAP |  |
| ∗Top 15 enriched GO BP terms are showed in the bar plot of each disease state in each tissue. Each row represents a significant GO biological process which is colored according to the -log10(p.adjust). |
| Page: 1 2 3 4 5 6 7 8 9 |
| GO ID | Tissue | Disease Stage | Description | Gene Ratio | Bg Ratio | pvalue | p.adjust | Count |
| Page: 1 |
| Pathway ID | Tissue | Disease Stage | Description | Gene Ratio | Bg Ratio | pvalue | p.adjust | qvalue | Count |
| Page: 1 |
Top |
Cell-cell communication analysis |
| Identification of potential cell-cell interactions between two cell types and their ligand-receptor pairs for different disease states |
| Ligand | Receptor | LRpair | Pathway | Tissue | Disease Stage |
| Page: 1 |
Top |
Single-cell gene regulatory network inference analysis |
| Find out the significant the regulons (TFs) and the target genes of each regulon across cell types for different disease states |
| TF | Cell Type | Tissue | Disease Stage | Target Gene | RSS | Regulon Activity |
| ∗The dot plots of a searched regulon are shown for all cell subpopulations in each disease state of each tissue based on the regulon specific score inferred using pySCENIC and by calculating the average expression. |
| Page: 1 |
Top |
Somatic mutation of malignant transformation related genes |
| Annotation of somatic variants for genes involved in malignant transformation |
| Hugo Symbol | Variant Class | Variant Classification | dbSNP RS | HGVSc | HGVSp | HGVSp Short | SWISSPROT | BIOTYPE | SIFT | PolyPhen | Tumor Sample Barcode | Tissue | Histology | Sex | Age | Stage | Therapy Types | Drugs | Outcome |
| QPCTL | SNV | Missense_Mutation | c.343N>C | p.Val115Leu | p.V115L | Q9NXS2 | protein_coding | deleterious(0.01) | benign(0.399) | TCGA-AN-A0AR-01 | Breast | breast invasive carcinoma | Female | <65 | I/II | Unknown | Unknown | SD | |
| QPCTL | SNV | Missense_Mutation | c.508N>A | p.Asp170Asn | p.D170N | Q9NXS2 | protein_coding | deleterious(0) | probably_damaging(0.989) | TCGA-E9-A1RF-01 | Breast | breast invasive carcinoma | Female | >=65 | III/IV | Hormone Therapy | tamoxiphen | SD | |
| QPCTL | insertion | Frame_Shift_Ins | novel | c.1055_1056insAGGTGTCGTGGTGCCTGCCTATAAT | p.Pro353GlyfsTer34 | p.P353Gfs*34 | Q9NXS2 | protein_coding | TCGA-A8-A07R-01 | Breast | breast invasive carcinoma | Female | >=65 | III/IV | Ancillary | zoledronic | SD | ||
| QPCTL | SNV | Missense_Mutation | rs375848663 | c.721N>T | p.Arg241Trp | p.R241W | Q9NXS2 | protein_coding | deleterious(0) | probably_damaging(0.998) | TCGA-DG-A2KK-01 | Cervix | cervical & endocervical cancer | Female | <65 | III/IV | Chemotherapy | cisplatin | SD |
| QPCTL | SNV | Missense_Mutation | rs376175267 | c.529N>A | p.Gly177Arg | p.G177R | Q9NXS2 | protein_coding | tolerated(0.48) | possibly_damaging(0.659) | TCGA-DR-A0ZM-01 | Cervix | cervical & endocervical cancer | Female | <65 | III/IV | Unspecific | Cisplatin | SD |
| QPCTL | SNV | Missense_Mutation | c.530N>T | p.Gly177Val | p.G177V | Q9NXS2 | protein_coding | tolerated(0.15) | possibly_damaging(0.779) | TCGA-DR-A0ZM-01 | Cervix | cervical & endocervical cancer | Female | <65 | III/IV | Unspecific | Cisplatin | SD | |
| QPCTL | SNV | Missense_Mutation | rs764876367 | c.1144C>T | p.Leu382Phe | p.L382F | Q9NXS2 | protein_coding | tolerated(0.05) | possibly_damaging(0.595) | TCGA-EA-A3HU-01 | Cervix | cervical & endocervical cancer | Female | <65 | I/II | Unknown | Unknown | SD |
| QPCTL | SNV | Missense_Mutation | rs151211223 | c.719N>T | p.Ser240Phe | p.S240F | Q9NXS2 | protein_coding | deleterious(0) | possibly_damaging(0.885) | TCGA-HM-A4S6-01 | Cervix | cervical & endocervical cancer | Female | <65 | III/IV | Chemotherapy | cisplatin | CR |
| QPCTL | SNV | Missense_Mutation | novel | c.50G>C | p.Gly17Ala | p.G17A | Q9NXS2 | protein_coding | deleterious_low_confidence(0.01) | benign(0.079) | TCGA-AA-A010-01 | Colorectum | colon adenocarcinoma | Female | <65 | I/II | Chemotherapy | folinic | CR |
| QPCTL | SNV | Missense_Mutation | rs750481449 | c.533C>T | p.Ser178Leu | p.S178L | Q9NXS2 | protein_coding | tolerated(0.23) | benign(0.003) | TCGA-AM-5820-01 | Colorectum | colon adenocarcinoma | Female | <65 | I/II | Unknown | Unknown | SD |
| Page: 1 2 3 4 |
Top |
Related drugs of malignant transformation related genes |
| Identification of chemicals and drugs interact with genes involved in malignant transfromation |
| (DGIdb 4.0) |
| Entrez ID | Symbol | Category | Interaction Types | Drug Claim Name | Drug Name | PMIDs |
| Page: 1 |

Copyright 2023-Present -The University of Texas Health Science Center at Houston |