
|
|||||
|
 | |
| |
| |
| |
| |
| |
|
Gene: QPCT |
Gene summary for QPCT |
| Gene information | Species | Human | Gene symbol | QPCT | Gene ID | 25797 |
| Gene name | glutaminyl-peptide cyclotransferase | |
| Gene Alias | GCT | |
| Cytomap | 2p22.2 | |
| Gene Type | protein-coding | GO ID | GO:0006464 | UniProtAcc | Q16769 |
Top |
Malignant transformation analysis |
| Identification of the aberrant gene expression in precancerous and cancerous lesions by comparing the gene expression of stem-like cells in diseased tissues with normal stem cells |
| Entrez ID | Symbol | Replicates | Species | Organ | Tissue | Adj P-value | Log2FC | Malignancy |
| 25797 | QPCT | LZE7T | Human | Esophagus | ESCC | 4.66e-03 | 4.21e-01 | 0.0667 |
| 25797 | QPCT | P2T-E | Human | Esophagus | ESCC | 7.66e-13 | 4.26e-01 | 0.1177 |
| 25797 | QPCT | P8T-E | Human | Esophagus | ESCC | 6.11e-04 | 2.91e-02 | 0.0889 |
| 25797 | QPCT | P11T-E | Human | Esophagus | ESCC | 3.02e-07 | 3.32e-01 | 0.1426 |
| 25797 | QPCT | P16T-E | Human | Esophagus | ESCC | 3.43e-18 | 6.01e-01 | 0.1153 |
| 25797 | QPCT | P24T-E | Human | Esophagus | ESCC | 7.71e-07 | 2.09e-01 | 0.1287 |
| 25797 | QPCT | P26T-E | Human | Esophagus | ESCC | 2.01e-08 | 2.29e-01 | 0.1276 |
| 25797 | QPCT | P37T-E | Human | Esophagus | ESCC | 1.33e-02 | 9.91e-02 | 0.1371 |
| 25797 | QPCT | P44T-E | Human | Esophagus | ESCC | 7.89e-03 | 2.11e-01 | 0.1096 |
| 25797 | QPCT | P56T-E | Human | Esophagus | ESCC | 5.12e-06 | 1.42e+00 | 0.1613 |
| 25797 | QPCT | P61T-E | Human | Esophagus | ESCC | 1.27e-04 | 1.41e-01 | 0.099 |
| 25797 | QPCT | P74T-E | Human | Esophagus | ESCC | 1.62e-10 | 4.30e-01 | 0.1479 |
| 25797 | QPCT | P76T-E | Human | Esophagus | ESCC | 2.52e-16 | 4.46e-01 | 0.1207 |
| 25797 | QPCT | P79T-E | Human | Esophagus | ESCC | 3.53e-04 | 3.63e-02 | 0.1154 |
| 25797 | QPCT | P82T-E | Human | Esophagus | ESCC | 5.38e-04 | 6.35e-01 | 0.1072 |
| 25797 | QPCT | P89T-E | Human | Esophagus | ESCC | 2.33e-04 | 8.04e-01 | 0.1752 |
| 25797 | QPCT | P126T-E | Human | Esophagus | ESCC | 1.87e-02 | 3.26e-01 | 0.1125 |
| 25797 | QPCT | P130T-E | Human | Esophagus | ESCC | 1.49e-40 | 1.15e+00 | 0.1676 |
| 25797 | QPCT | male-WTA | Human | Thyroid | PTC | 1.63e-35 | 4.36e-01 | 0.1037 |
| 25797 | QPCT | PTC01 | Human | Thyroid | PTC | 7.38e-47 | 1.11e+00 | 0.1899 |
| Page: 1 2 |
| Tissue | Expression Dynamics | Abbreviation |
| Esophagus | 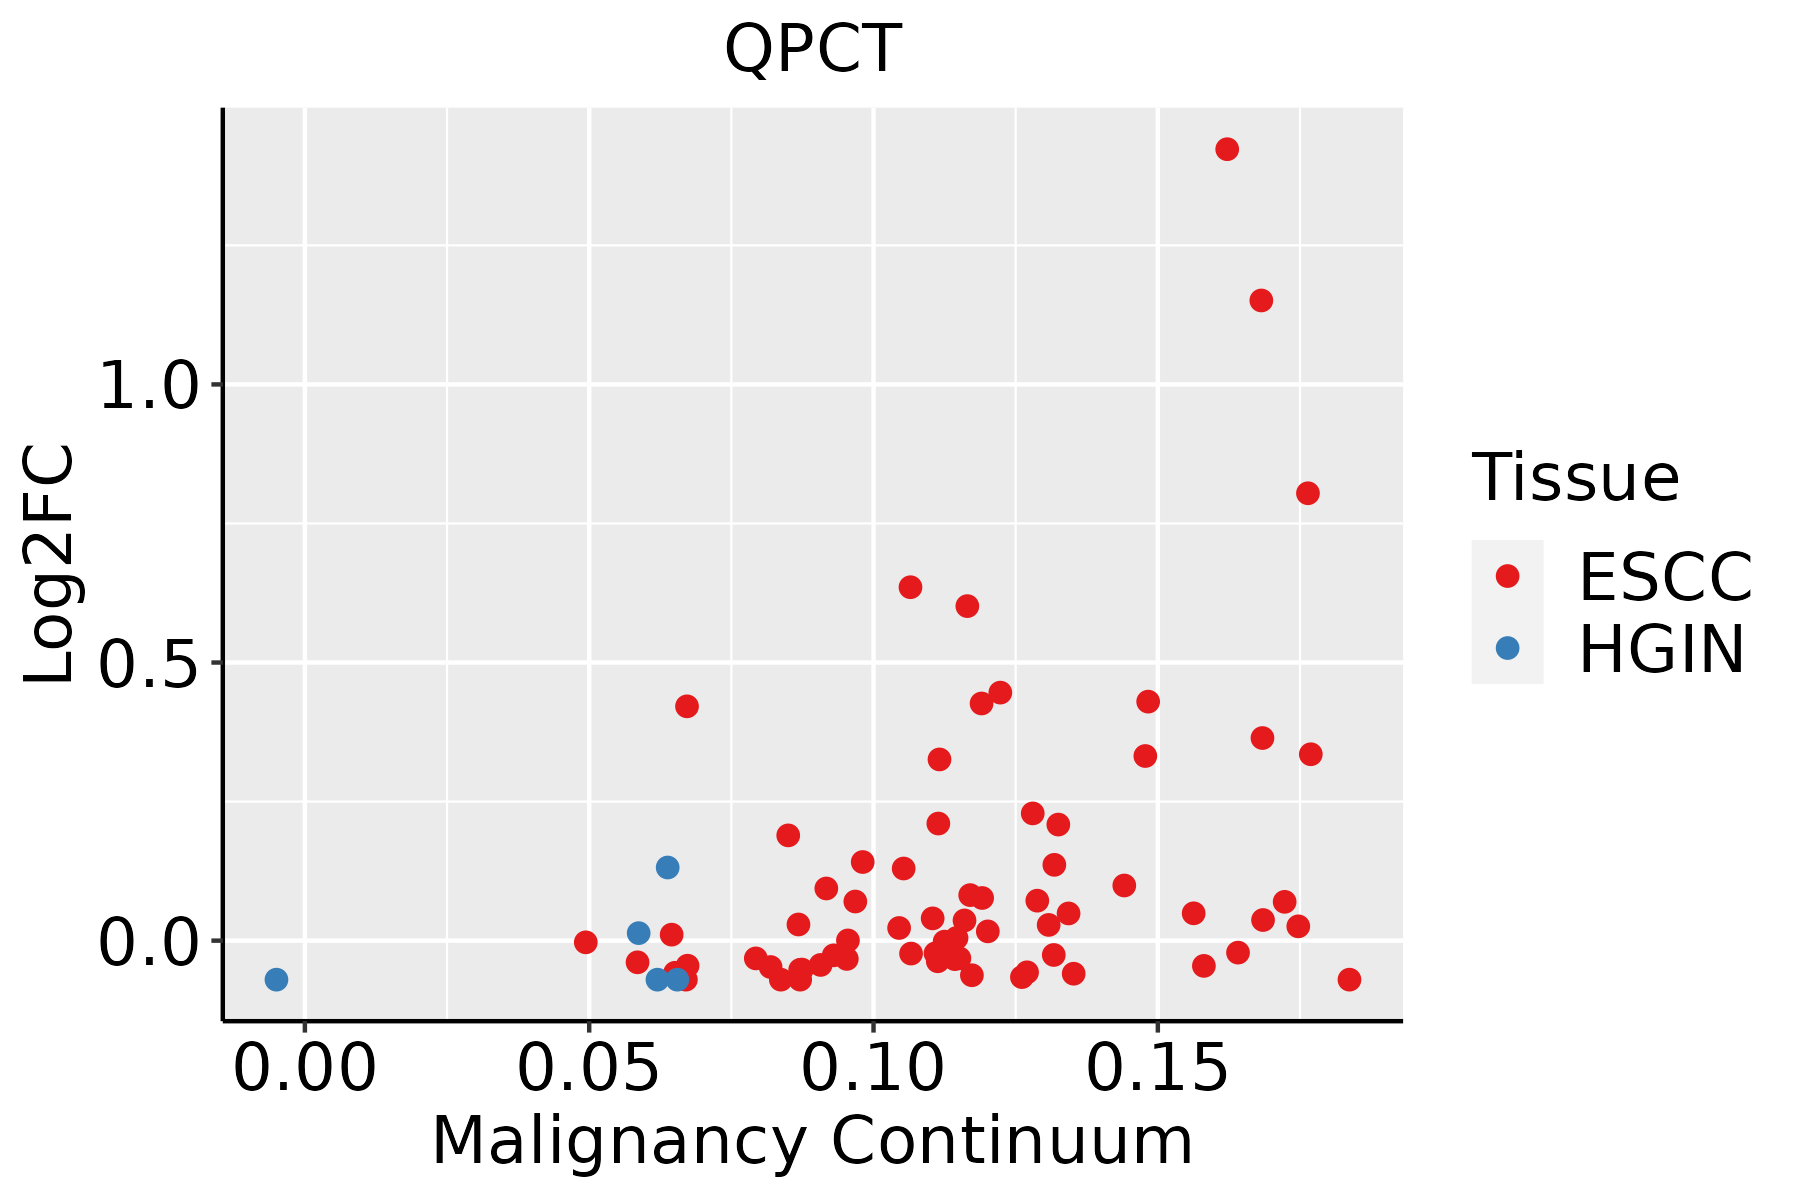 | ESCC: Esophageal squamous cell carcinoma |
| HGIN: High-grade intraepithelial neoplasias | ||
| LGIN: Low-grade intraepithelial neoplasias | ||
| Thyroid | 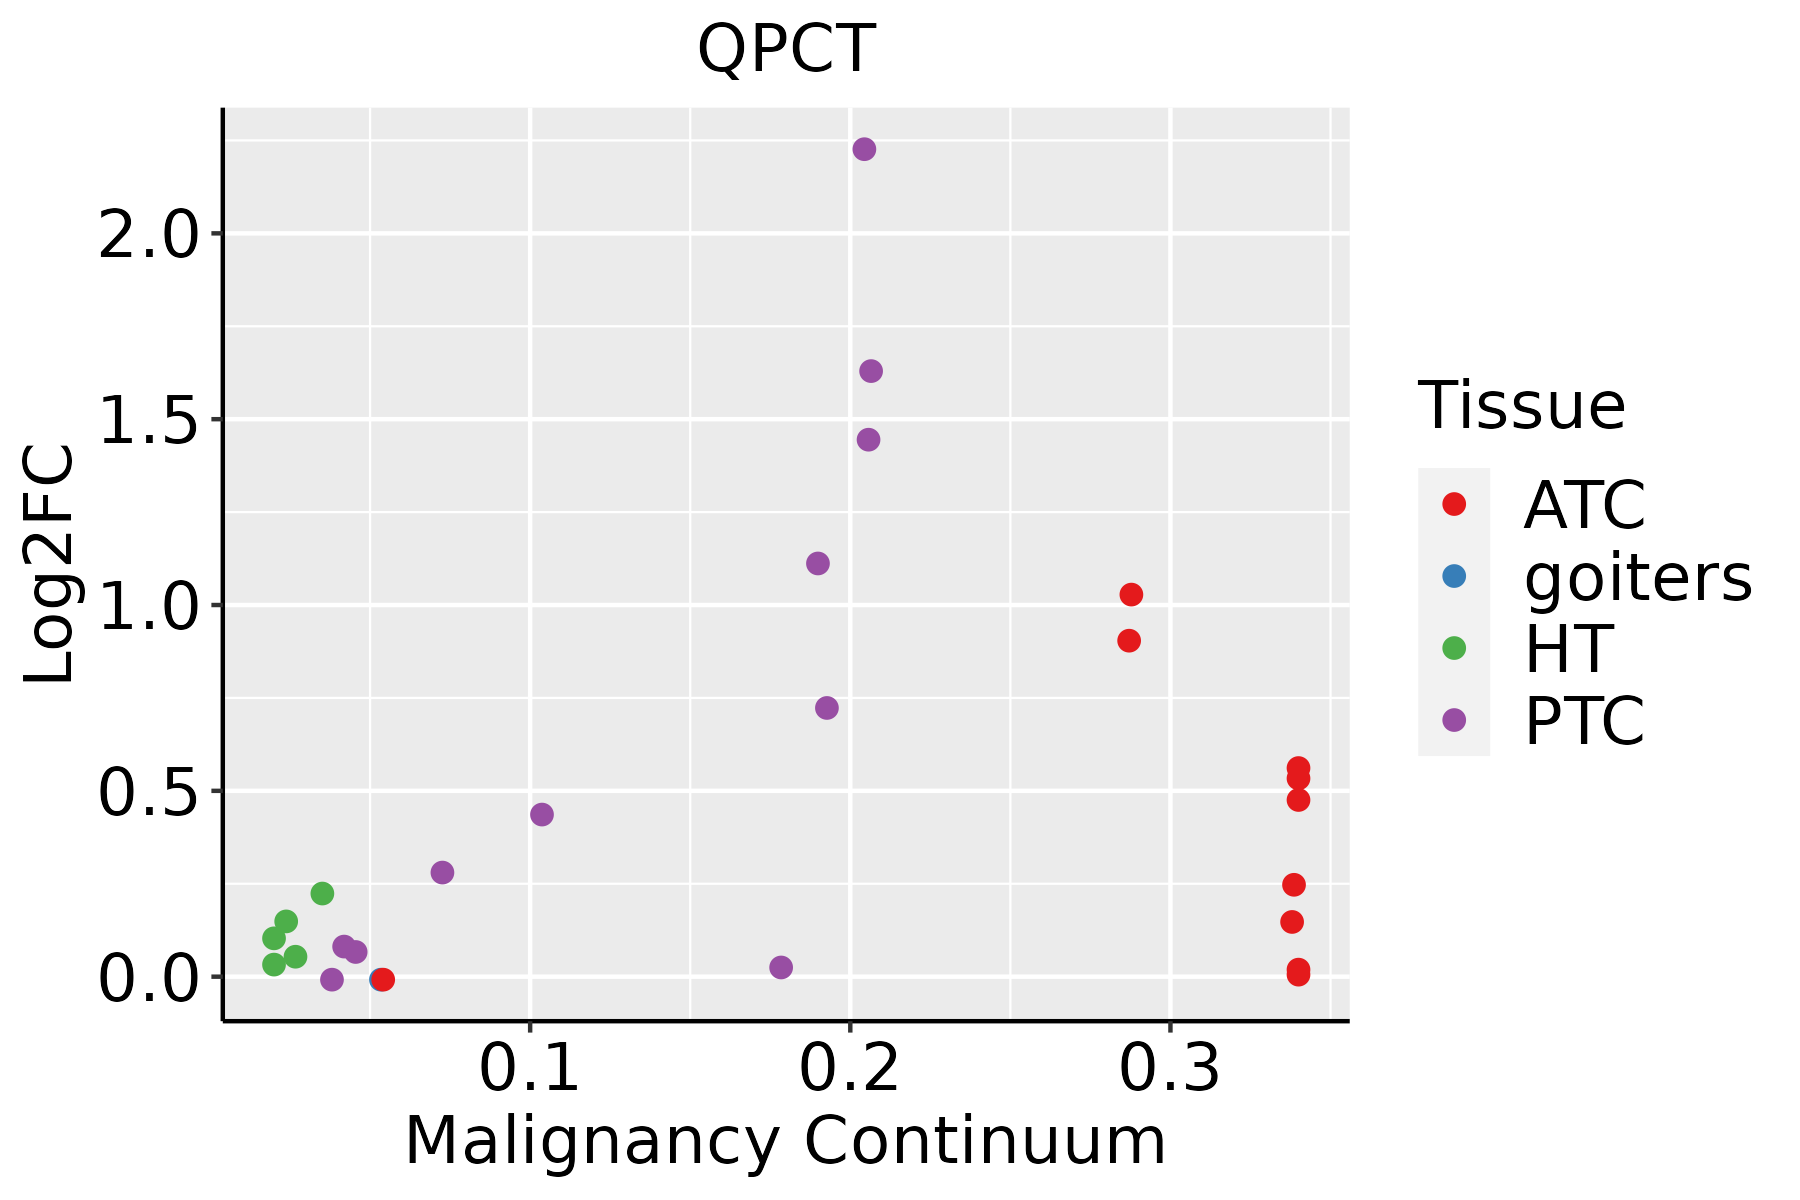 | ATC: Anaplastic thyroid cancer |
| HT: Hashimoto's thyroiditis | ||
| PTC: Papillary thyroid cancer |
| ∗log2FC in expression of this searched gene in stem-like cells from each diseased tissue sample relative to stem-like cells in normal samples in each tissue plotted against the malignancy continuum. Samples are colored based on if they are from different disease stage. |
Top |
Malignant transformation related pathway analysis |
| Find out the enriched GO biological processes and KEGG pathways involved in transition from healthy to precancer to cancer |
| Tissue | Disease Stage | Enriched GO biological Processes |
| Colorectum | AD |  |
| Colorectum | SER |  |
| Colorectum | MSS |  |
| Colorectum | MSI-H |  |
| Colorectum | FAP |  |
| ∗Top 15 enriched GO BP terms are showed in the bar plot of each disease state in each tissue. Each row represents a significant GO biological process which is colored according to the -log10(p.adjust). |
| Page: 1 2 3 4 5 6 7 8 9 |
| GO ID | Tissue | Disease Stage | Description | Gene Ratio | Bg Ratio | pvalue | p.adjust | Count |
| Page: 1 |
| Pathway ID | Tissue | Disease Stage | Description | Gene Ratio | Bg Ratio | pvalue | p.adjust | qvalue | Count |
| Page: 1 |
Top |
Cell-cell communication analysis |
| Identification of potential cell-cell interactions between two cell types and their ligand-receptor pairs for different disease states |
| Ligand | Receptor | LRpair | Pathway | Tissue | Disease Stage |
| Page: 1 |
Top |
Single-cell gene regulatory network inference analysis |
| Find out the significant the regulons (TFs) and the target genes of each regulon across cell types for different disease states |
| TF | Cell Type | Tissue | Disease Stage | Target Gene | RSS | Regulon Activity |
| ∗The dot plots of a searched regulon are shown for all cell subpopulations in each disease state of each tissue based on the regulon specific score inferred using pySCENIC and by calculating the average expression. |
| Page: 1 |
Top |
Somatic mutation of malignant transformation related genes |
| Annotation of somatic variants for genes involved in malignant transformation |
| Hugo Symbol | Variant Class | Variant Classification | dbSNP RS | HGVSc | HGVSp | HGVSp Short | SWISSPROT | BIOTYPE | SIFT | PolyPhen | Tumor Sample Barcode | Tissue | Histology | Sex | Age | Stage | Therapy Types | Drugs | Outcome |
| QPCT | SNV | Missense_Mutation | novel | c.938G>T | p.Arg313Ile | p.R313I | Q16769 | protein_coding | deleterious(0.01) | possibly_damaging(0.807) | TCGA-E2-A1LE-01 | Breast | breast invasive carcinoma | Female | >=65 | III/IV | Chemotherapy | herceptin | PD |
| QPCT | insertion | Frame_Shift_Ins | novel | c.510_511insG | p.Ala171GlyfsTer29 | p.A171Gfs*29 | Q16769 | protein_coding | TCGA-A2-A0T2-01 | Breast | breast invasive carcinoma | Female | >=65 | III/IV | Chemotherapy | xeloda | PD | ||
| QPCT | SNV | Missense_Mutation | rs762938073 | c.826N>T | p.His276Tyr | p.H276Y | Q16769 | protein_coding | deleterious(0.04) | benign(0.191) | TCGA-C5-A8XJ-01 | Cervix | cervical & endocervical cancer | Female | >=65 | I/II | Chemotherapy | cisplatin | SD |
| QPCT | SNV | Missense_Mutation | novel | c.700N>A | p.Gly234Ser | p.G234S | Q16769 | protein_coding | tolerated(0.27) | benign(0.125) | TCGA-C5-A905-01 | Cervix | cervical & endocervical cancer | Female | <65 | I/II | Unknown | Unknown | SD |
| QPCT | SNV | Missense_Mutation | c.805G>A | p.Glu269Lys | p.E269K | Q16769 | protein_coding | tolerated(0.64) | benign(0.001) | TCGA-DS-A0VK-01 | Cervix | cervical & endocervical cancer | Female | <65 | I/II | Chemotherapy | carboplatin | PD | |
| QPCT | SNV | Missense_Mutation | novel | c.524N>G | p.Asp175Gly | p.D175G | Q16769 | protein_coding | deleterious(0) | probably_damaging(1) | TCGA-CA-6717-01 | Colorectum | colon adenocarcinoma | Male | <65 | I/II | Chemotherapy | oxaliplatin | CR |
| QPCT | SNV | Missense_Mutation | rs779100301 | c.964N>T | p.Pro322Ser | p.P322S | Q16769 | protein_coding | tolerated(0.42) | benign(0.22) | TCGA-CA-6717-01 | Colorectum | colon adenocarcinoma | Male | <65 | I/II | Chemotherapy | oxaliplatin | CR |
| QPCT | SNV | Missense_Mutation | novel | c.432N>T | p.Lys144Asn | p.K144N | Q16769 | protein_coding | deleterious(0) | probably_damaging(0.97) | TCGA-AG-A002-01 | Colorectum | rectum adenocarcinoma | Male | <65 | I/II | Unknown | Unknown | SD |
| QPCT | SNV | Missense_Mutation | novel | c.809N>T | p.Arg270Ile | p.R270I | Q16769 | protein_coding | deleterious(0) | probably_damaging(0.992) | TCGA-AG-A002-01 | Colorectum | rectum adenocarcinoma | Male | <65 | I/II | Unknown | Unknown | SD |
| QPCT | insertion | Frame_Shift_Ins | novel | c.783dupT | p.Pro262SerfsTer14 | p.P262Sfs*14 | Q16769 | protein_coding | TCGA-AD-6964-01 | Colorectum | colon adenocarcinoma | Male | <65 | III/IV | Chemotherapy | folfox | PD |
| Page: 1 2 3 4 |
Top |
Related drugs of malignant transformation related genes |
| Identification of chemicals and drugs interact with genes involved in malignant transfromation |
| (DGIdb 4.0) |
| Entrez ID | Symbol | Category | Interaction Types | Drug Claim Name | Drug Name | PMIDs |
| 25797 | QPCT | ENZYME, PROTEASE, DRUGGABLE GENOME | PQ-912 | 24403873 | ||
| 25797 | QPCT | ENZYME, PROTEASE, DRUGGABLE GENOME | inhibitor | 252166568 |
| Page: 1 |

Copyright 2023-Present -The University of Texas Health Science Center at Houston |