
|
|||||
|
 | |
| |
| |
| |
| |
| |
|
Gene: QDPR |
Gene summary for QDPR |
| Gene information | Species | Human | Gene symbol | QDPR | Gene ID | 5860 |
| Gene name | quinoid dihydropteridine reductase | |
| Gene Alias | DHPR | |
| Cytomap | 4p15.32 | |
| Gene Type | protein-coding | GO ID | GO:0001889 | UniProtAcc | A0A140VKA9 |
Top |
Malignant transformation analysis |
| Identification of the aberrant gene expression in precancerous and cancerous lesions by comparing the gene expression of stem-like cells in diseased tissues with normal stem cells |
| Entrez ID | Symbol | Replicates | Species | Organ | Tissue | Adj P-value | Log2FC | Malignancy |
| 5860 | QDPR | GSM4909293 | Human | Breast | IDC | 4.02e-06 | 2.82e-01 | 0.1581 |
| 5860 | QDPR | GSM4909297 | Human | Breast | IDC | 6.20e-05 | -9.48e-02 | 0.1517 |
| 5860 | QDPR | GSM4909307 | Human | Breast | IDC | 1.44e-02 | 2.64e-01 | 0.1569 |
| 5860 | QDPR | GSM4909308 | Human | Breast | IDC | 4.26e-11 | 4.12e-01 | 0.158 |
| 5860 | QDPR | GSM4909311 | Human | Breast | IDC | 3.63e-08 | -1.01e-01 | 0.1534 |
| 5860 | QDPR | GSM4909312 | Human | Breast | IDC | 6.94e-05 | 1.51e-01 | 0.1552 |
| 5860 | QDPR | GSM4909319 | Human | Breast | IDC | 2.69e-13 | -1.37e-01 | 0.1563 |
| 5860 | QDPR | GSM4909321 | Human | Breast | IDC | 1.33e-02 | -1.12e-01 | 0.1559 |
| 5860 | QDPR | M5 | Human | Breast | IDC | 1.41e-06 | 6.82e-01 | 0.1598 |
| 5860 | QDPR | NCCBC14 | Human | Breast | DCIS | 1.31e-03 | 4.18e-02 | 0.2021 |
| 5860 | QDPR | NCCBC5 | Human | Breast | DCIS | 3.31e-05 | 1.58e-01 | 0.2046 |
| 5860 | QDPR | P1 | Human | Breast | IDC | 1.42e-07 | -1.68e-01 | 0.1527 |
| 5860 | QDPR | DCIS2 | Human | Breast | DCIS | 1.58e-32 | -2.46e-02 | 0.0085 |
| 5860 | QDPR | LZE4T | Human | Esophagus | ESCC | 4.32e-03 | 2.65e-02 | 0.0811 |
| 5860 | QDPR | LZE7T | Human | Esophagus | ESCC | 1.04e-03 | 2.62e-01 | 0.0667 |
| 5860 | QDPR | LZE8T | Human | Esophagus | ESCC | 5.90e-05 | 9.58e-02 | 0.067 |
| 5860 | QDPR | LZE24T | Human | Esophagus | ESCC | 3.78e-10 | 1.48e-01 | 0.0596 |
| 5860 | QDPR | P2T-E | Human | Esophagus | ESCC | 5.81e-33 | 7.34e-01 | 0.1177 |
| 5860 | QDPR | P4T-E | Human | Esophagus | ESCC | 1.04e-16 | 4.55e-01 | 0.1323 |
| 5860 | QDPR | P5T-E | Human | Esophagus | ESCC | 2.48e-10 | 2.85e-01 | 0.1327 |
| Page: 1 2 3 4 5 6 |
| Tissue | Expression Dynamics | Abbreviation |
| Breast | 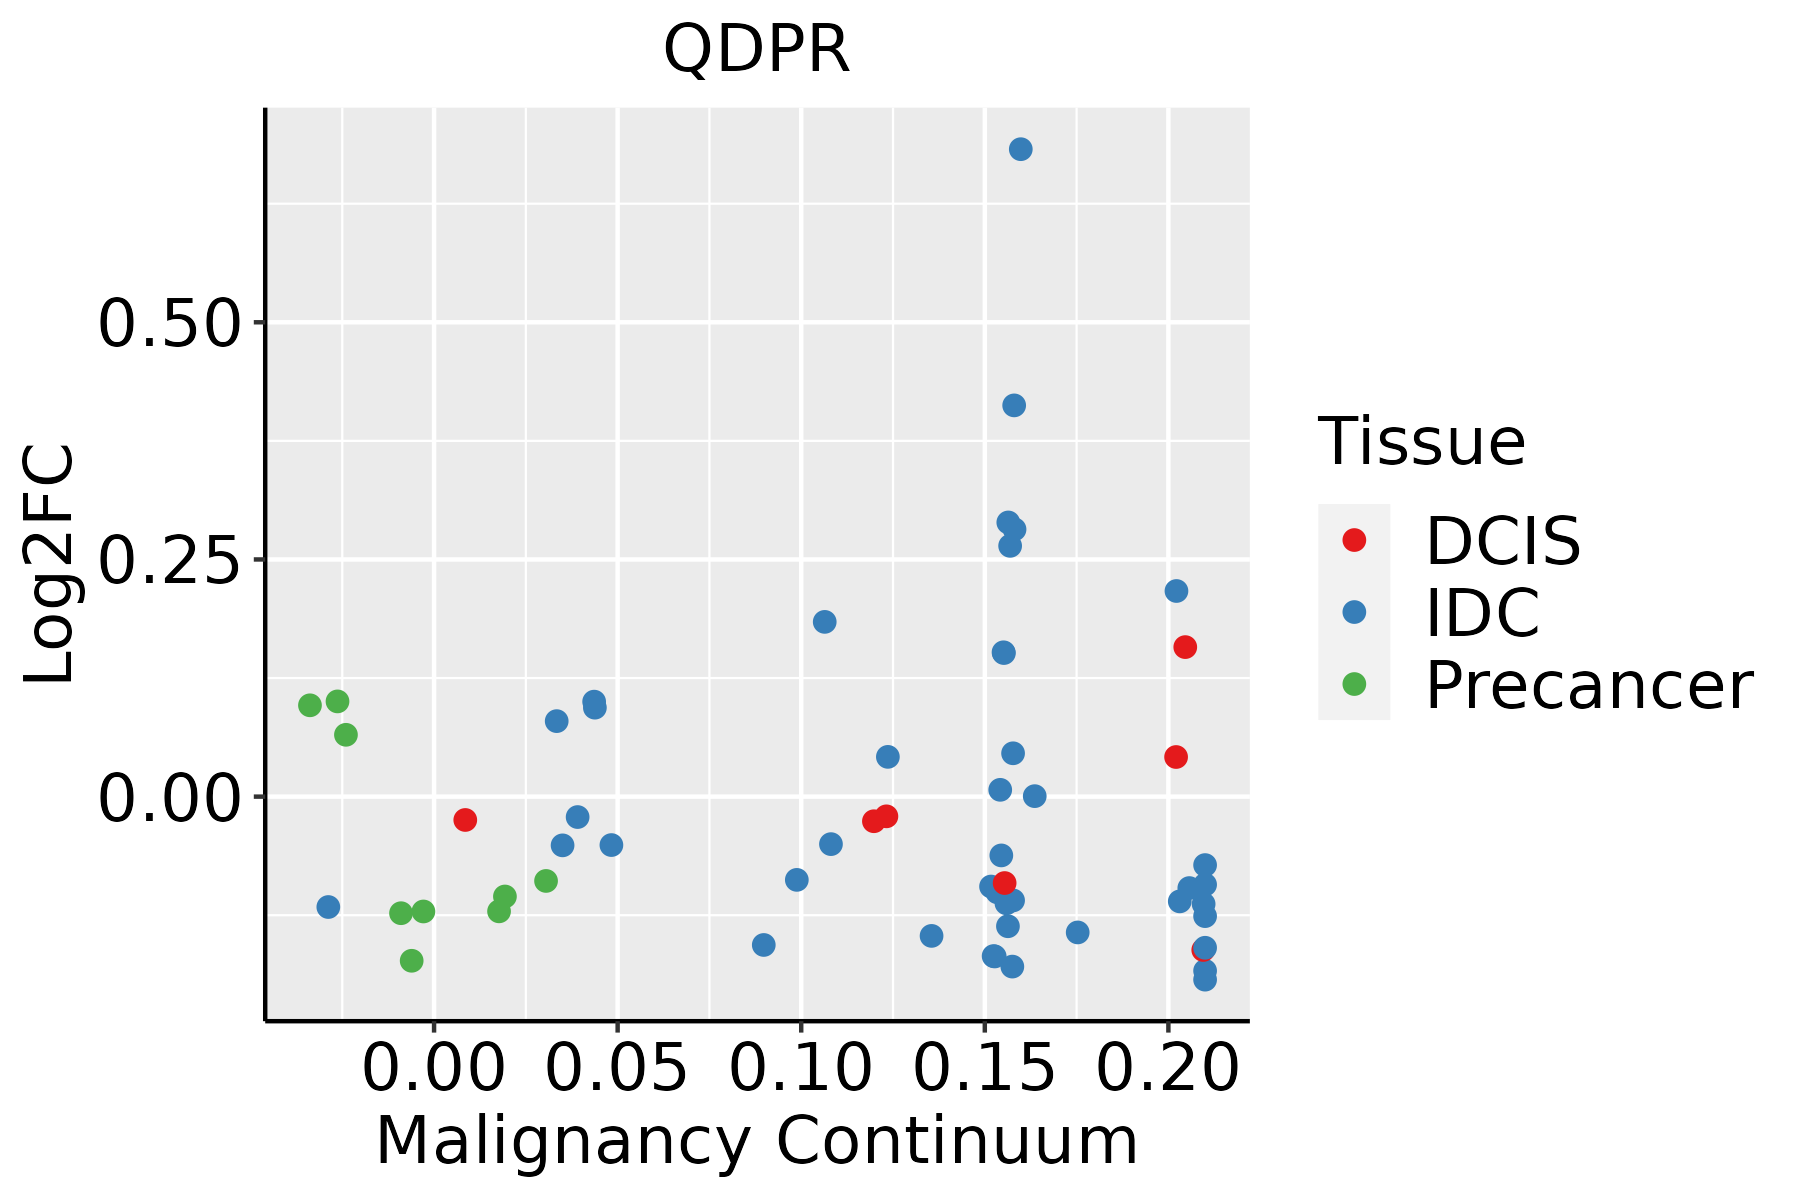 | IDC: Invasive ductal carcinoma |
| DCIS: Ductal carcinoma in situ | ||
| Precancer(BRCA1-mut): Precancerous lesion from BRCA1 mutation carriers | ||
| Esophagus |  | ESCC: Esophageal squamous cell carcinoma |
| HGIN: High-grade intraepithelial neoplasias | ||
| LGIN: Low-grade intraepithelial neoplasias | ||
| Liver | 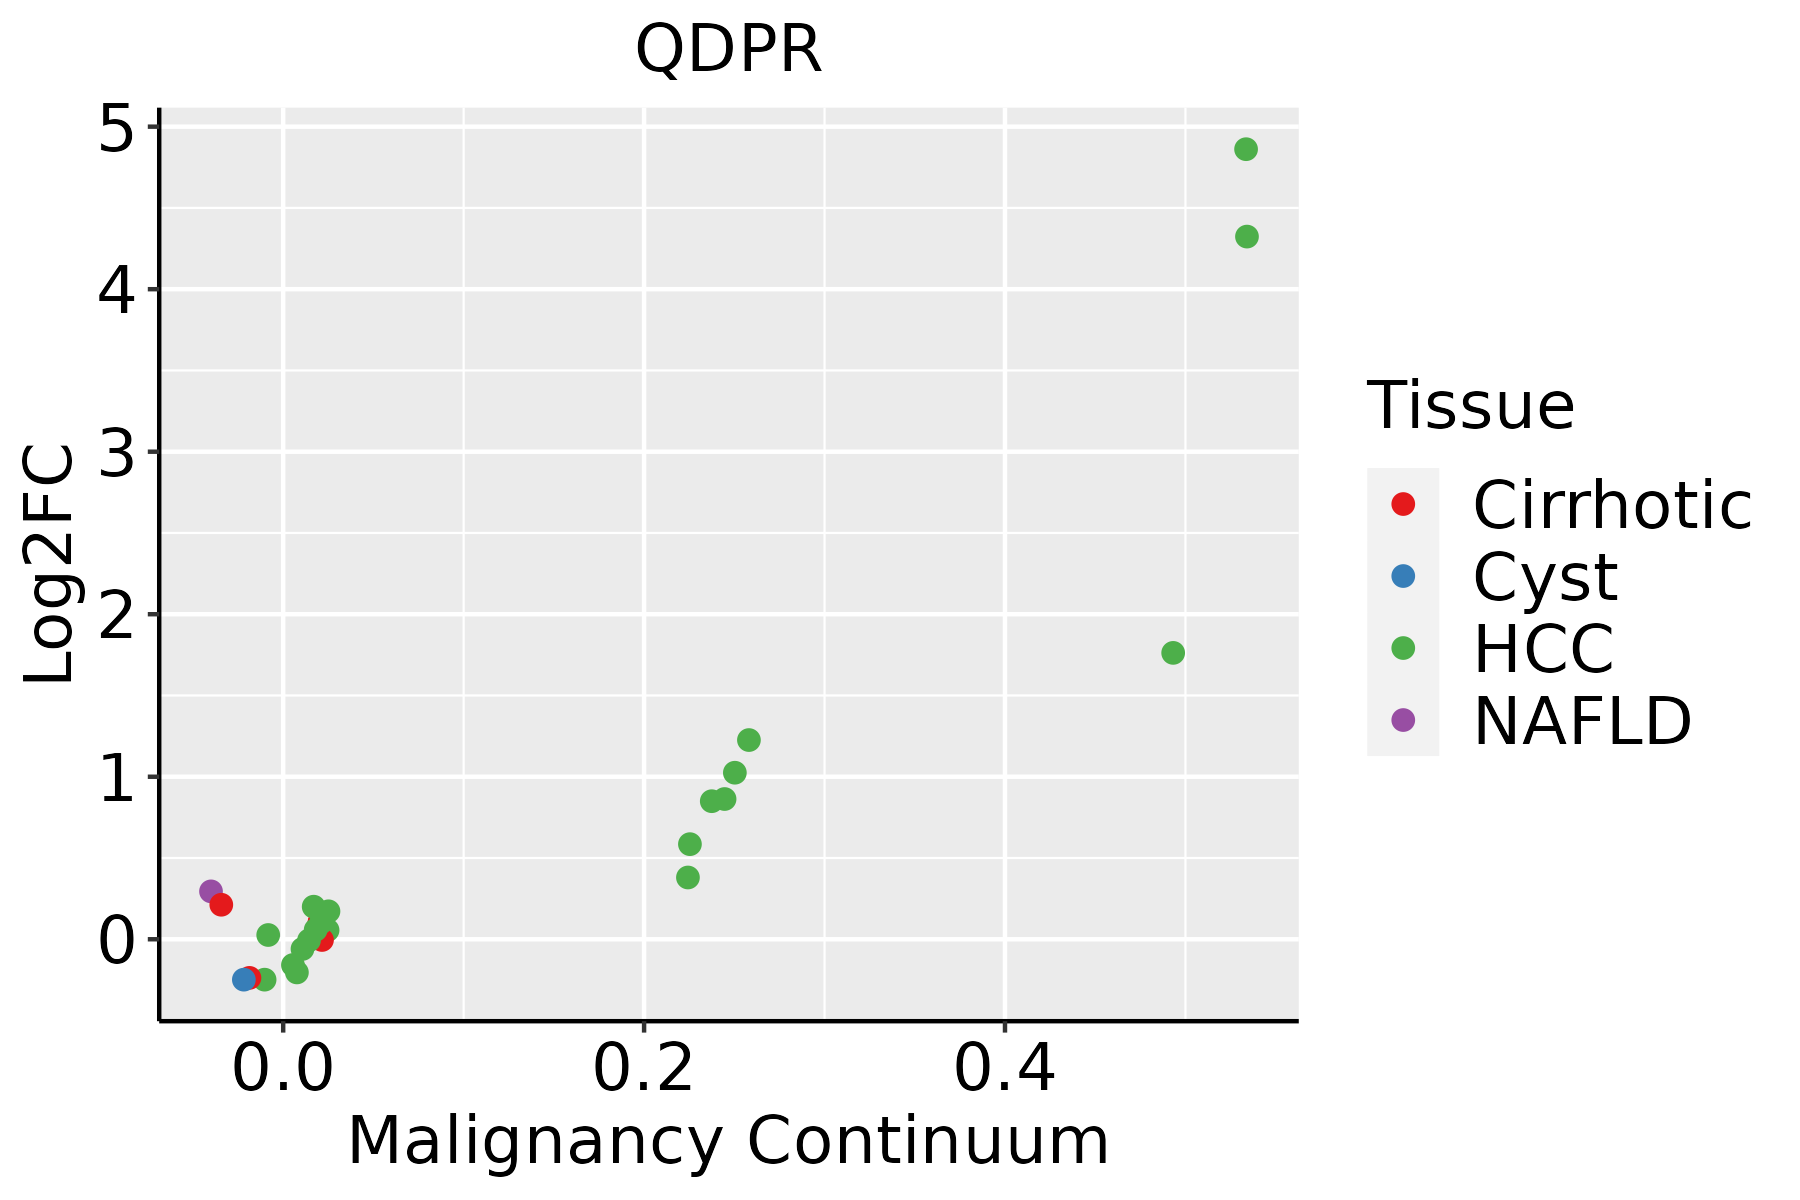 | HCC: Hepatocellular carcinoma |
| NAFLD: Non-alcoholic fatty liver disease | ||
| Oral Cavity |  | EOLP: Erosive Oral lichen planus |
| LP: leukoplakia | ||
| NEOLP: Non-erosive oral lichen planus | ||
| OSCC: Oral squamous cell carcinoma | ||
| Skin | 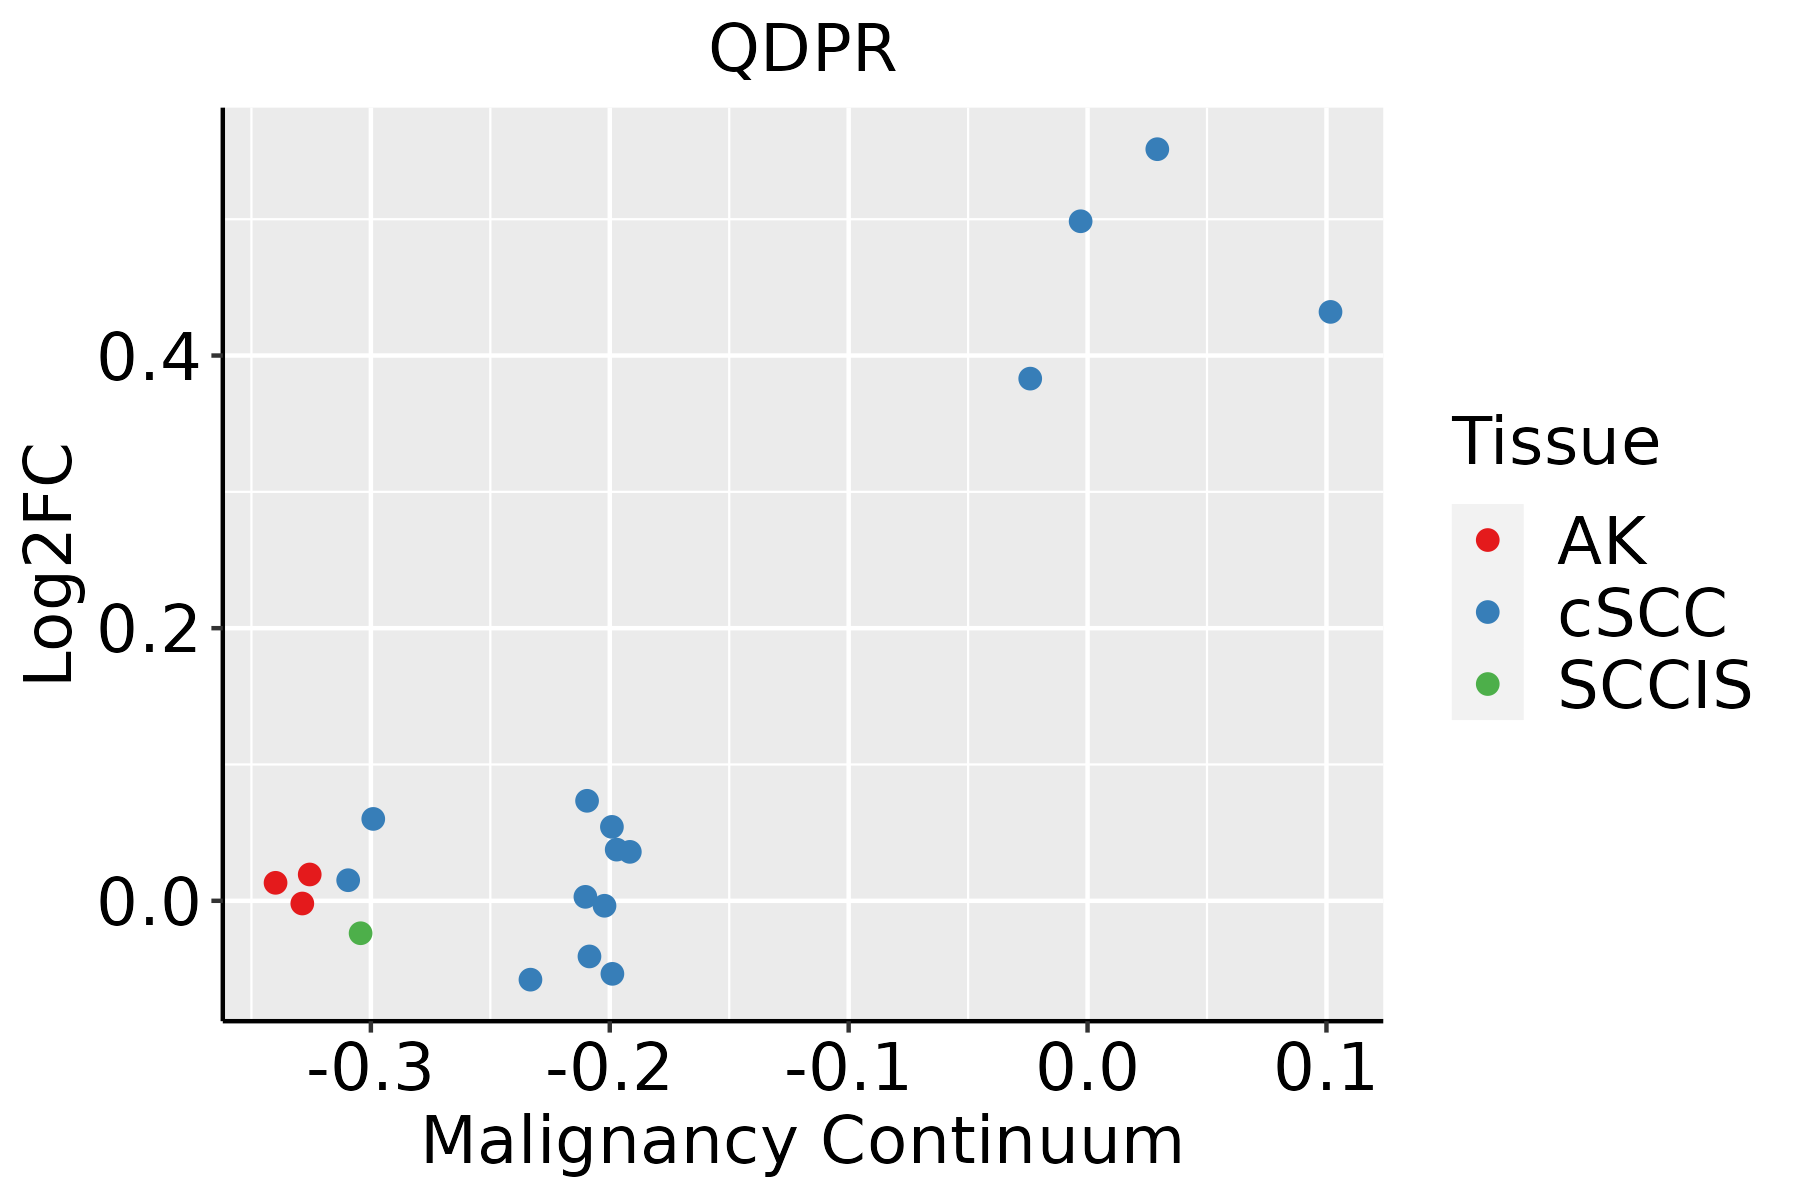 | AK: Actinic keratosis |
| cSCC: Cutaneous squamous cell carcinoma | ||
| SCCIS:squamous cell carcinoma in situ |
| ∗log2FC in expression of this searched gene in stem-like cells from each diseased tissue sample relative to stem-like cells in normal samples in each tissue plotted against the malignancy continuum. Samples are colored based on if they are from different disease stage. |
Top |
Malignant transformation related pathway analysis |
| Find out the enriched GO biological processes and KEGG pathways involved in transition from healthy to precancer to cancer |
| Tissue | Disease Stage | Enriched GO biological Processes |
| Colorectum | AD |  |
| Colorectum | SER |  |
| Colorectum | MSS |  |
| Colorectum | MSI-H |  |
| Colorectum | FAP |  |
| ∗Top 15 enriched GO BP terms are showed in the bar plot of each disease state in each tissue. Each row represents a significant GO biological process which is colored according to the -log10(p.adjust). |
| Page: 1 2 3 4 5 6 7 8 9 |
| GO ID | Tissue | Disease Stage | Description | Gene Ratio | Bg Ratio | pvalue | p.adjust | Count |
| GO:000609113 | Breast | IDC | generation of precursor metabolites and energy | 103/1434 | 490/18723 | 1.53e-21 | 1.74e-18 | 103 |
| GO:002290013 | Breast | IDC | electron transport chain | 51/1434 | 175/18723 | 2.23e-17 | 8.43e-15 | 51 |
| GO:001003814 | Breast | IDC | response to metal ion | 65/1434 | 373/18723 | 2.95e-10 | 3.42e-08 | 65 |
| GO:004873214 | Breast | IDC | gland development | 64/1434 | 436/18723 | 3.47e-07 | 1.74e-05 | 64 |
| GO:000941013 | Breast | IDC | response to xenobiotic stimulus | 62/1434 | 462/18723 | 1.05e-05 | 2.88e-04 | 62 |
| GO:00434348 | Breast | IDC | response to peptide hormone | 54/1434 | 414/18723 | 8.25e-05 | 1.61e-03 | 54 |
| GO:000188913 | Breast | IDC | liver development | 24/1434 | 147/18723 | 3.29e-04 | 4.92e-03 | 24 |
| GO:006100813 | Breast | IDC | hepaticobiliary system development | 24/1434 | 150/18723 | 4.46e-04 | 6.04e-03 | 24 |
| GO:190136112 | Breast | IDC | organic cyclic compound catabolic process | 56/1434 | 495/18723 | 2.12e-03 | 1.99e-02 | 56 |
| GO:001943912 | Breast | IDC | aromatic compound catabolic process | 51/1434 | 467/18723 | 6.54e-03 | 4.59e-02 | 51 |
| GO:000609123 | Breast | DCIS | generation of precursor metabolites and energy | 103/1390 | 490/18723 | 1.46e-22 | 1.65e-19 | 103 |
| GO:002290023 | Breast | DCIS | electron transport chain | 51/1390 | 175/18723 | 6.01e-18 | 2.62e-15 | 51 |
| GO:001003824 | Breast | DCIS | response to metal ion | 65/1390 | 373/18723 | 8.03e-11 | 9.88e-09 | 65 |
| GO:004873223 | Breast | DCIS | gland development | 60/1390 | 436/18723 | 2.50e-06 | 8.74e-05 | 60 |
| GO:000941023 | Breast | DCIS | response to xenobiotic stimulus | 59/1390 | 462/18723 | 3.00e-05 | 6.61e-04 | 59 |
| GO:004343414 | Breast | DCIS | response to peptide hormone | 52/1390 | 414/18723 | 1.33e-04 | 2.28e-03 | 52 |
| GO:000188923 | Breast | DCIS | liver development | 23/1390 | 147/18723 | 5.21e-04 | 6.76e-03 | 23 |
| GO:006100823 | Breast | DCIS | hepaticobiliary system development | 23/1390 | 150/18723 | 6.96e-04 | 8.47e-03 | 23 |
| GO:190136122 | Breast | DCIS | organic cyclic compound catabolic process | 55/1390 | 495/18723 | 1.75e-03 | 1.71e-02 | 55 |
| GO:001943922 | Breast | DCIS | aromatic compound catabolic process | 51/1390 | 467/18723 | 3.58e-03 | 2.92e-02 | 51 |
| Page: 1 2 3 4 5 6 7 8 |
| Pathway ID | Tissue | Disease Stage | Description | Gene Ratio | Bg Ratio | pvalue | p.adjust | qvalue | Count |
| Page: 1 |
Top |
Cell-cell communication analysis |
| Identification of potential cell-cell interactions between two cell types and their ligand-receptor pairs for different disease states |
| Ligand | Receptor | LRpair | Pathway | Tissue | Disease Stage |
| Page: 1 |
Top |
Single-cell gene regulatory network inference analysis |
| Find out the significant the regulons (TFs) and the target genes of each regulon across cell types for different disease states |
| TF | Cell Type | Tissue | Disease Stage | Target Gene | RSS | Regulon Activity |
| ∗The dot plots of a searched regulon are shown for all cell subpopulations in each disease state of each tissue based on the regulon specific score inferred using pySCENIC and by calculating the average expression. |
| Page: 1 |
Top |
Somatic mutation of malignant transformation related genes |
| Annotation of somatic variants for genes involved in malignant transformation |
| Hugo Symbol | Variant Class | Variant Classification | dbSNP RS | HGVSc | HGVSp | HGVSp Short | SWISSPROT | BIOTYPE | SIFT | PolyPhen | Tumor Sample Barcode | Tissue | Histology | Sex | Age | Stage | Therapy Types | Drugs | Outcome |
| QDPR | SNV | Missense_Mutation | c.457N>A | p.Ala153Thr | p.A153T | P09417 | protein_coding | tolerated(0.1) | possibly_damaging(0.486) | TCGA-D8-A1XQ-01 | Breast | breast invasive carcinoma | Female | >=65 | I/II | Unknown | Unknown | SD | |
| QDPR | insertion | Frame_Shift_Ins | novel | c.671_672insCTGTGTCCTCTGGCCTAGGGTTAAGTGTGCA | p.Gly225CysfsTer68 | p.G225Cfs*68 | P09417 | protein_coding | TCGA-AN-A03X-01 | Breast | breast invasive carcinoma | Female | >=65 | I/II | Unknown | Unknown | SD | ||
| QDPR | SNV | Missense_Mutation | c.616G>A | p.Glu206Lys | p.E206K | P09417 | protein_coding | tolerated(0.06) | possibly_damaging(0.527) | TCGA-F5-6814-01 | Colorectum | rectum adenocarcinoma | Male | <65 | I/II | Unknown | Unknown | SD | |
| QDPR | deletion | In_Frame_Del | novel | c.484_498delNNNNNNNNNNNNNNN | p.Gln162_Gly166del | p.Q162_G166del | P09417 | protein_coding | TCGA-AG-3999-01 | Colorectum | rectum adenocarcinoma | Female | <65 | III/IV | Unspecific | PD | |||
| QDPR | SNV | Missense_Mutation | novel | c.700G>A | p.Glu234Lys | p.E234K | P09417 | protein_coding | tolerated(0.47) | benign(0) | TCGA-A5-A0G1-01 | Endometrium | uterine corpus endometrioid carcinoma | Female | >=65 | I/II | Unknown | Unknown | SD |
| QDPR | SNV | Missense_Mutation | rs865953344 | c.283N>A | p.Ala95Thr | p.A95T | P09417 | protein_coding | deleterious(0.02) | possibly_damaging(0.785) | TCGA-BG-A220-01 | Endometrium | uterine corpus endometrioid carcinoma | Female | >=65 | I/II | Unknown | Unknown | SD |
| QDPR | SNV | Missense_Mutation | rs778631854 | c.409N>A | p.Ala137Thr | p.A137T | P09417 | protein_coding | deleterious(0) | probably_damaging(0.998) | TCGA-FI-A2D5-01 | Endometrium | uterine corpus endometrioid carcinoma | Female | <65 | III/IV | Chemotherapy | carboplatinum | PD |
| QDPR | SNV | Missense_Mutation | novel | c.142N>A | p.Ala48Thr | p.A48T | P09417 | protein_coding | deleterious(0.02) | probably_damaging(0.972) | TCGA-SJ-A6ZI-01 | Endometrium | uterine corpus endometrioid carcinoma | Female | <65 | I/II | Unknown | Unknown | SD |
| QDPR | SNV | Missense_Mutation | c.662N>T | p.Arg221Leu | p.R221L | P09417 | protein_coding | deleterious(0) | benign(0.344) | TCGA-44-7670-01 | Lung | lung adenocarcinoma | Female | <65 | I/II | Chemotherapy | docetaxel | SD | |
| QDPR | SNV | Missense_Mutation | c.209N>T | p.Glu70Val | p.E70V | P09417 | protein_coding | tolerated(0.1) | benign(0.011) | TCGA-49-4507-01 | Lung | lung adenocarcinoma | Female | >=65 | III/IV | Chemotherapy | taxol | PD |
| Page: 1 2 3 |
Top |
Related drugs of malignant transformation related genes |
| Identification of chemicals and drugs interact with genes involved in malignant transfromation |
| (DGIdb 4.0) |
| Entrez ID | Symbol | Category | Interaction Types | Drug Claim Name | Drug Name | PMIDs |
| Page: 1 |

Copyright 2023-Present -The University of Texas Health Science Center at Houston |