| Tissue | Expression Dynamics | Abbreviation |
| Colorectum (GSE201348) |  | FAP: Familial adenomatous polyposis |
| CRC: Colorectal cancer |
| Colorectum (HTA11) | 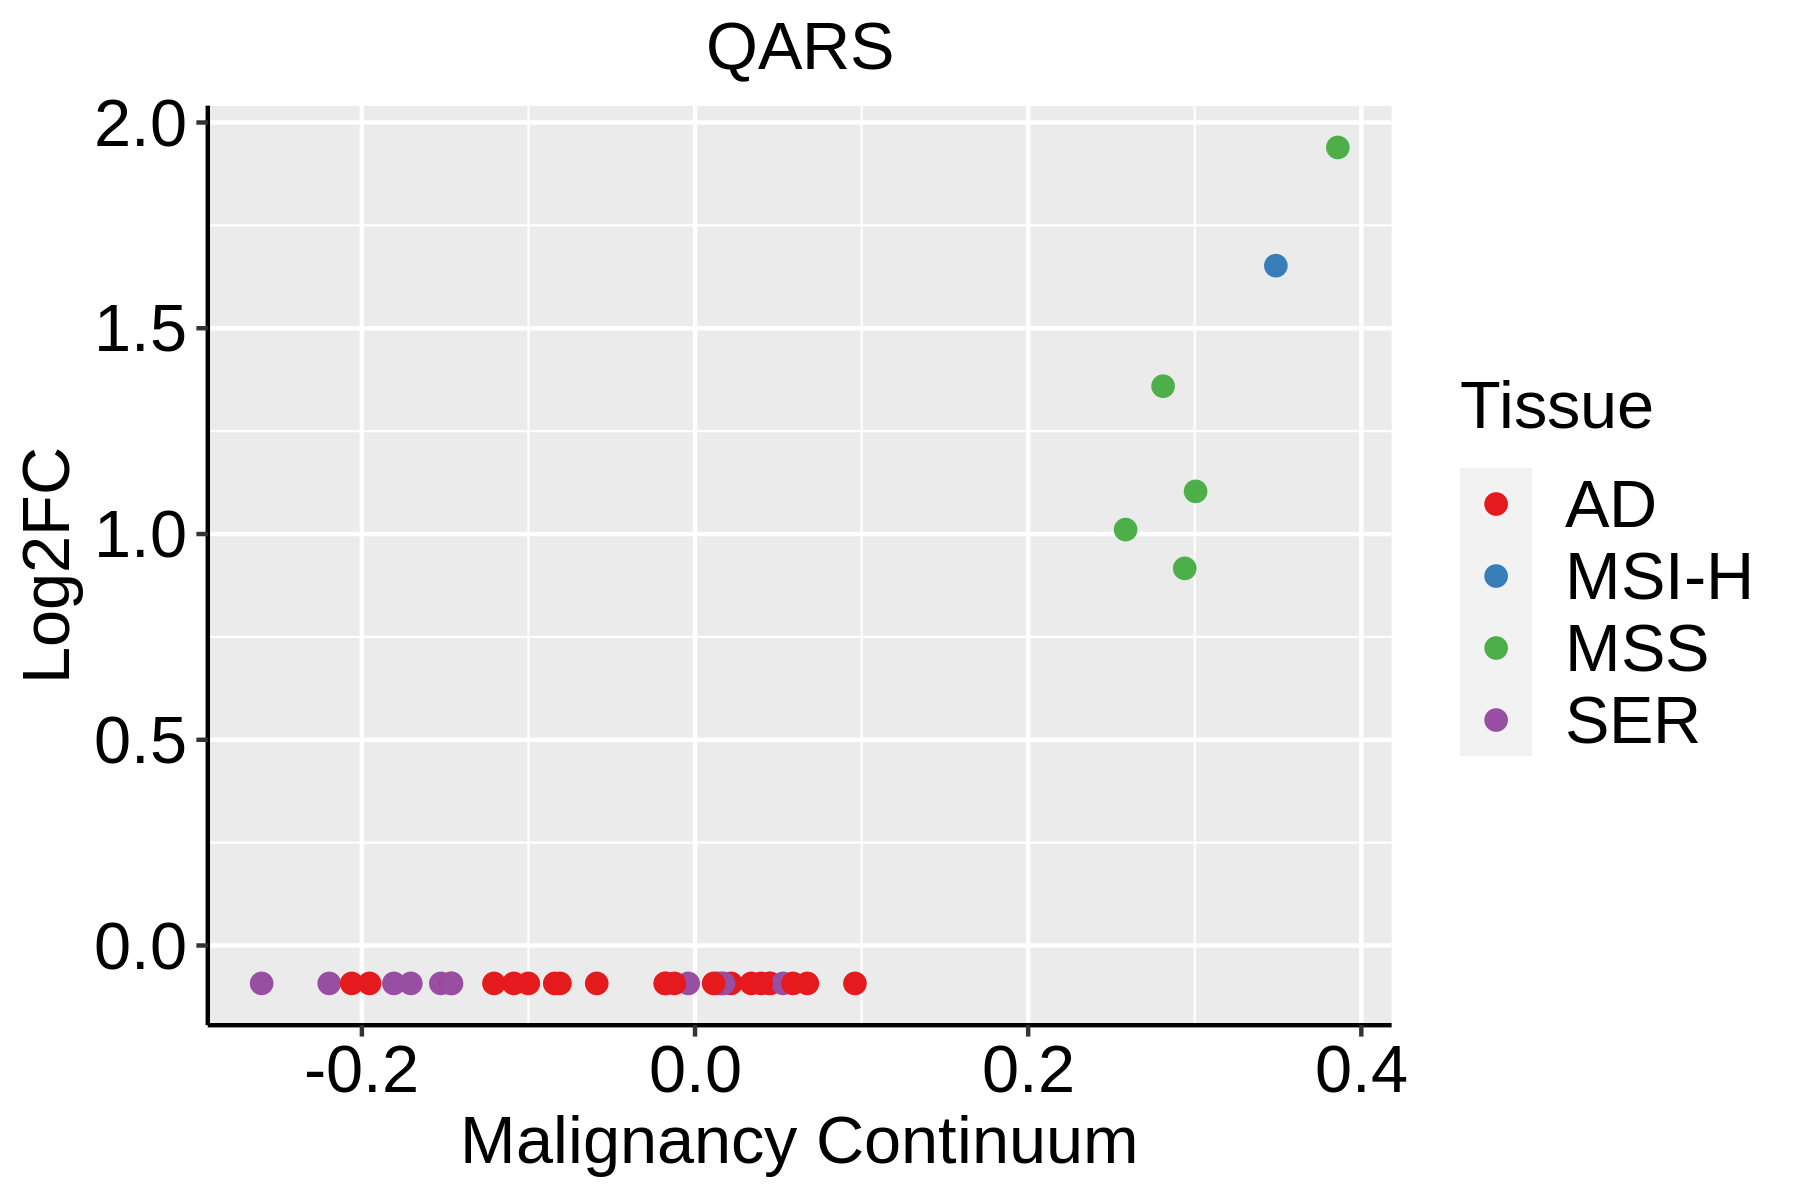 | AD: Adenomas |
| SER: Sessile serrated lesions |
| MSI-H: Microsatellite-high colorectal cancer |
| MSS: Microsatellite stable colorectal cancer |
| Esophagus | 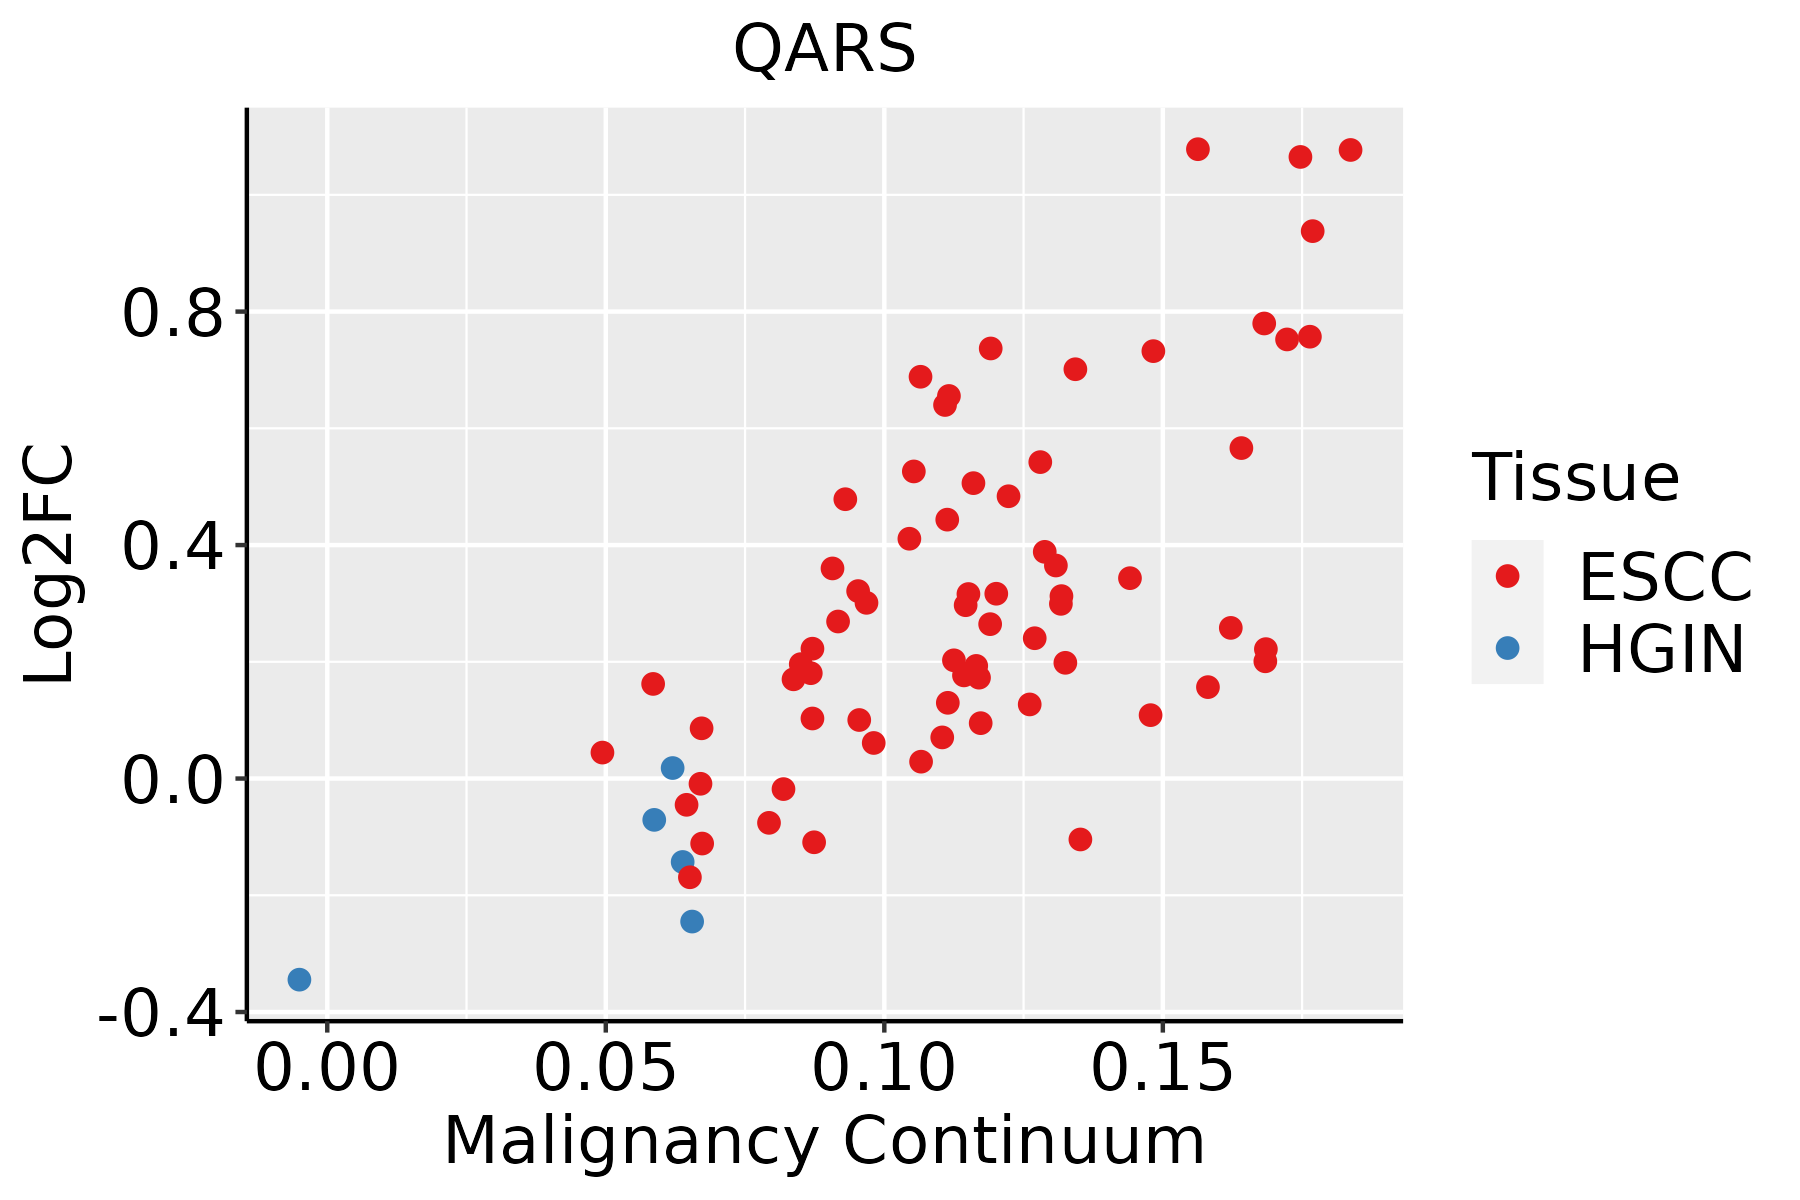 | ESCC: Esophageal squamous cell carcinoma |
| HGIN: High-grade intraepithelial neoplasias |
| LGIN: Low-grade intraepithelial neoplasias |
| Liver | 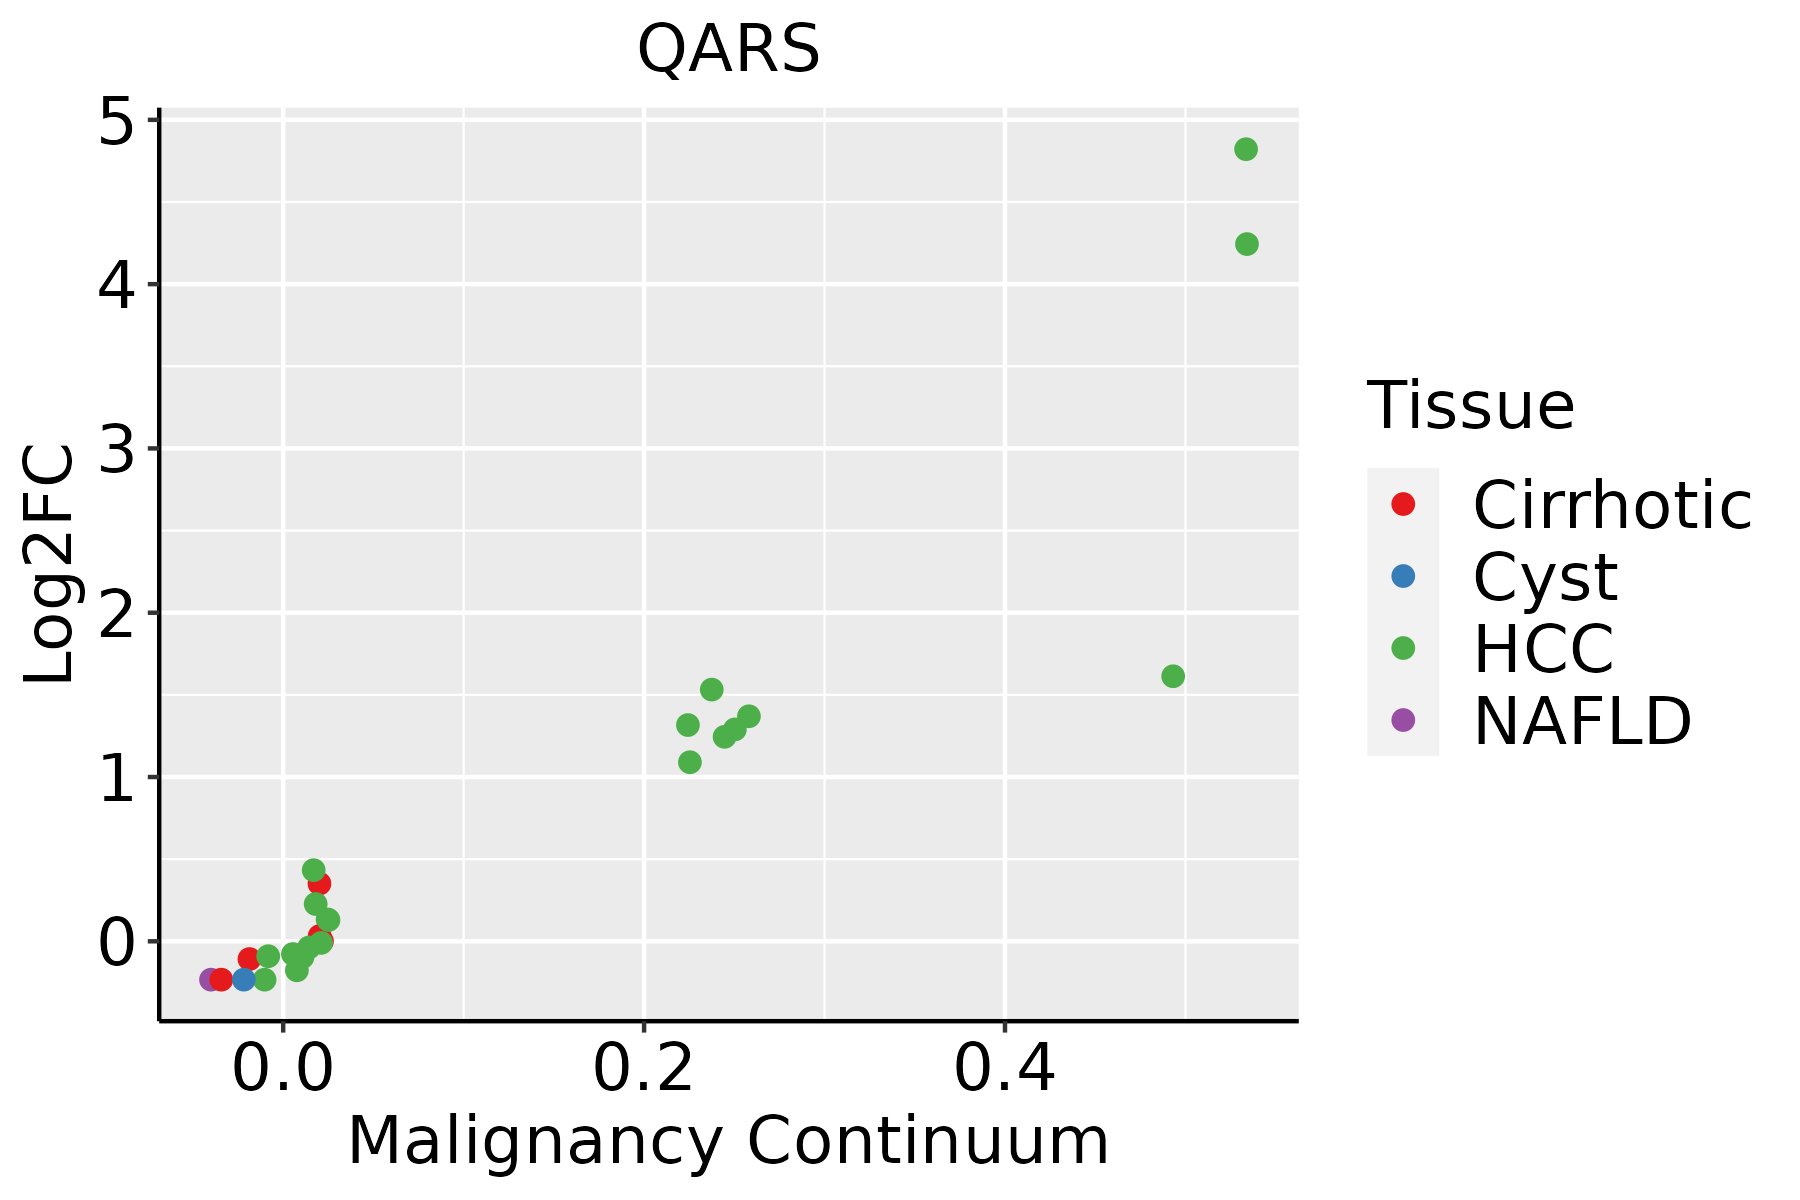 | HCC: Hepatocellular carcinoma |
| NAFLD: Non-alcoholic fatty liver disease |
| Oral Cavity |  | EOLP: Erosive Oral lichen planus |
| LP: leukoplakia |
| NEOLP: Non-erosive oral lichen planus |
| OSCC: Oral squamous cell carcinoma |
| Prostate | 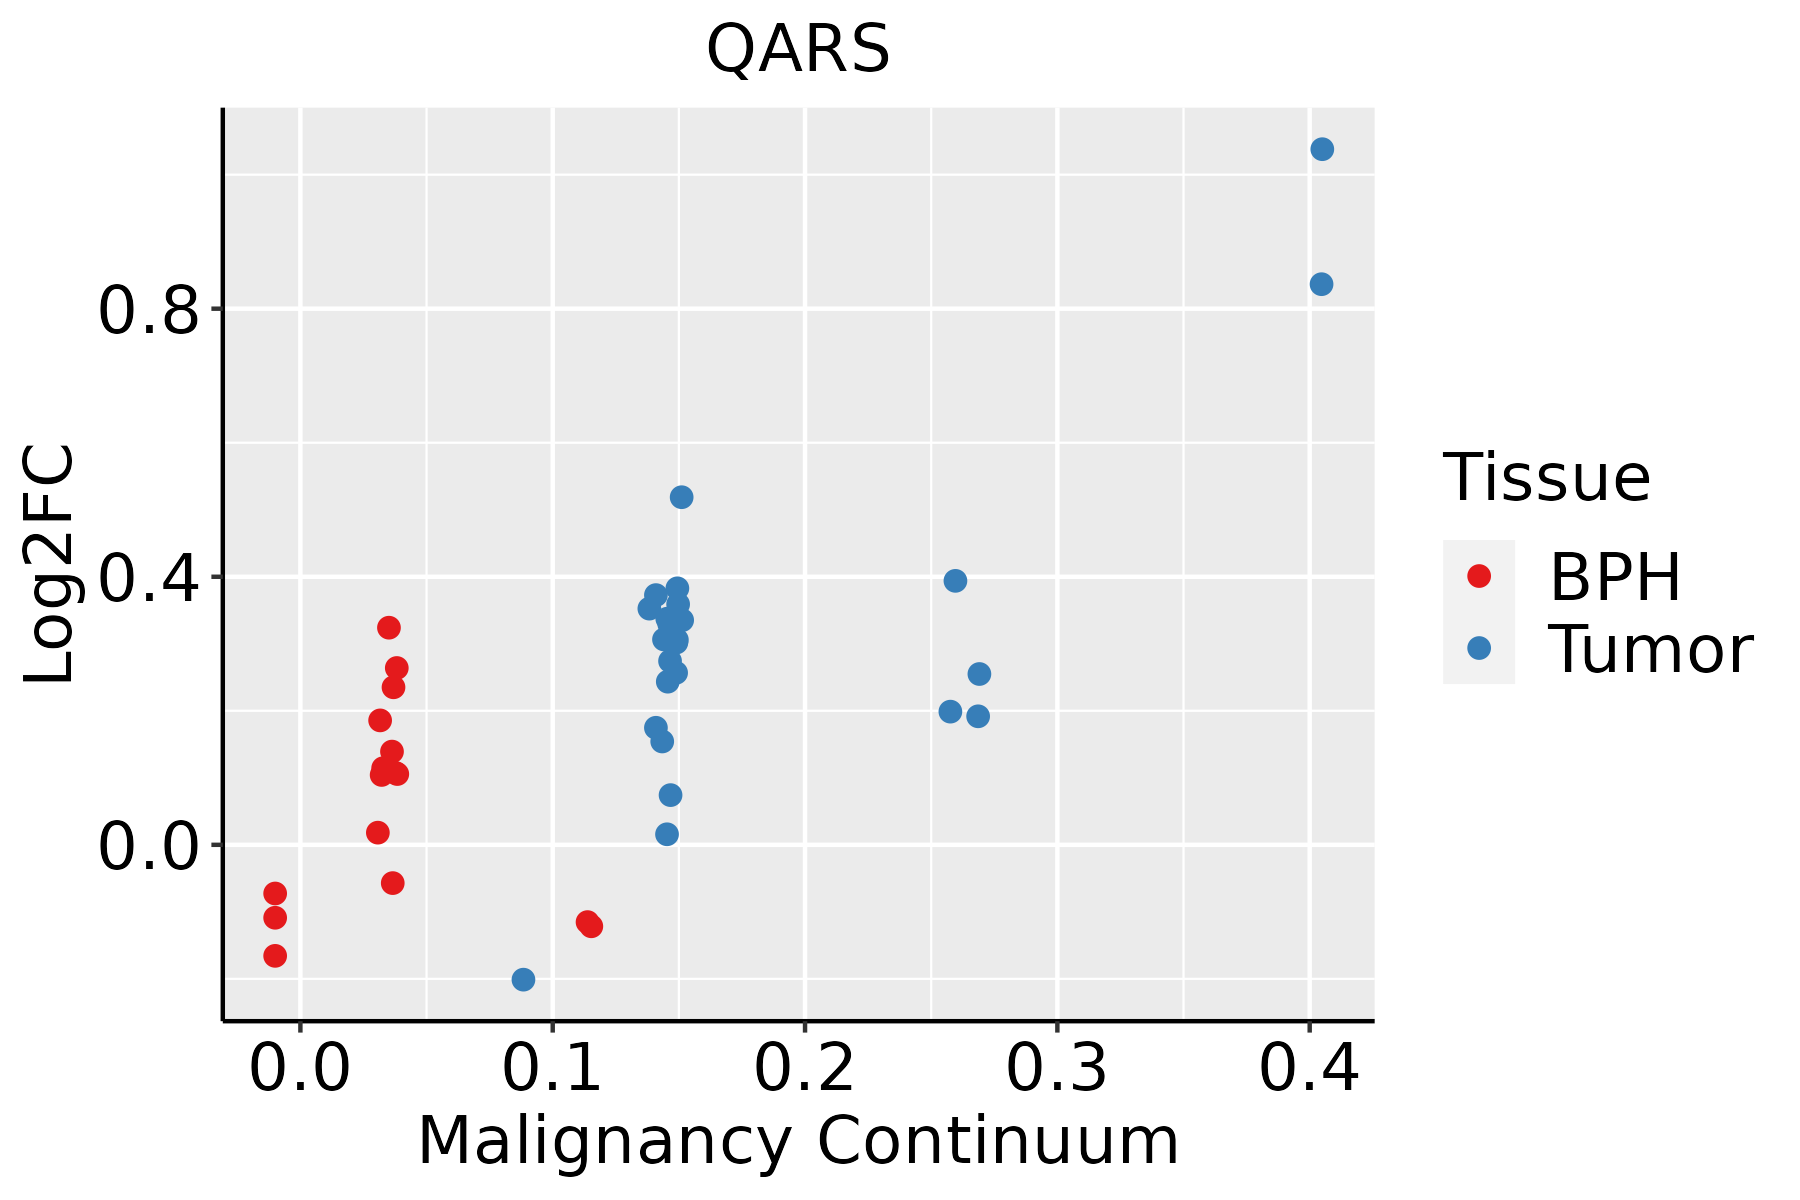 | BPH: Benign Prostatic Hyperplasia |
| Skin | 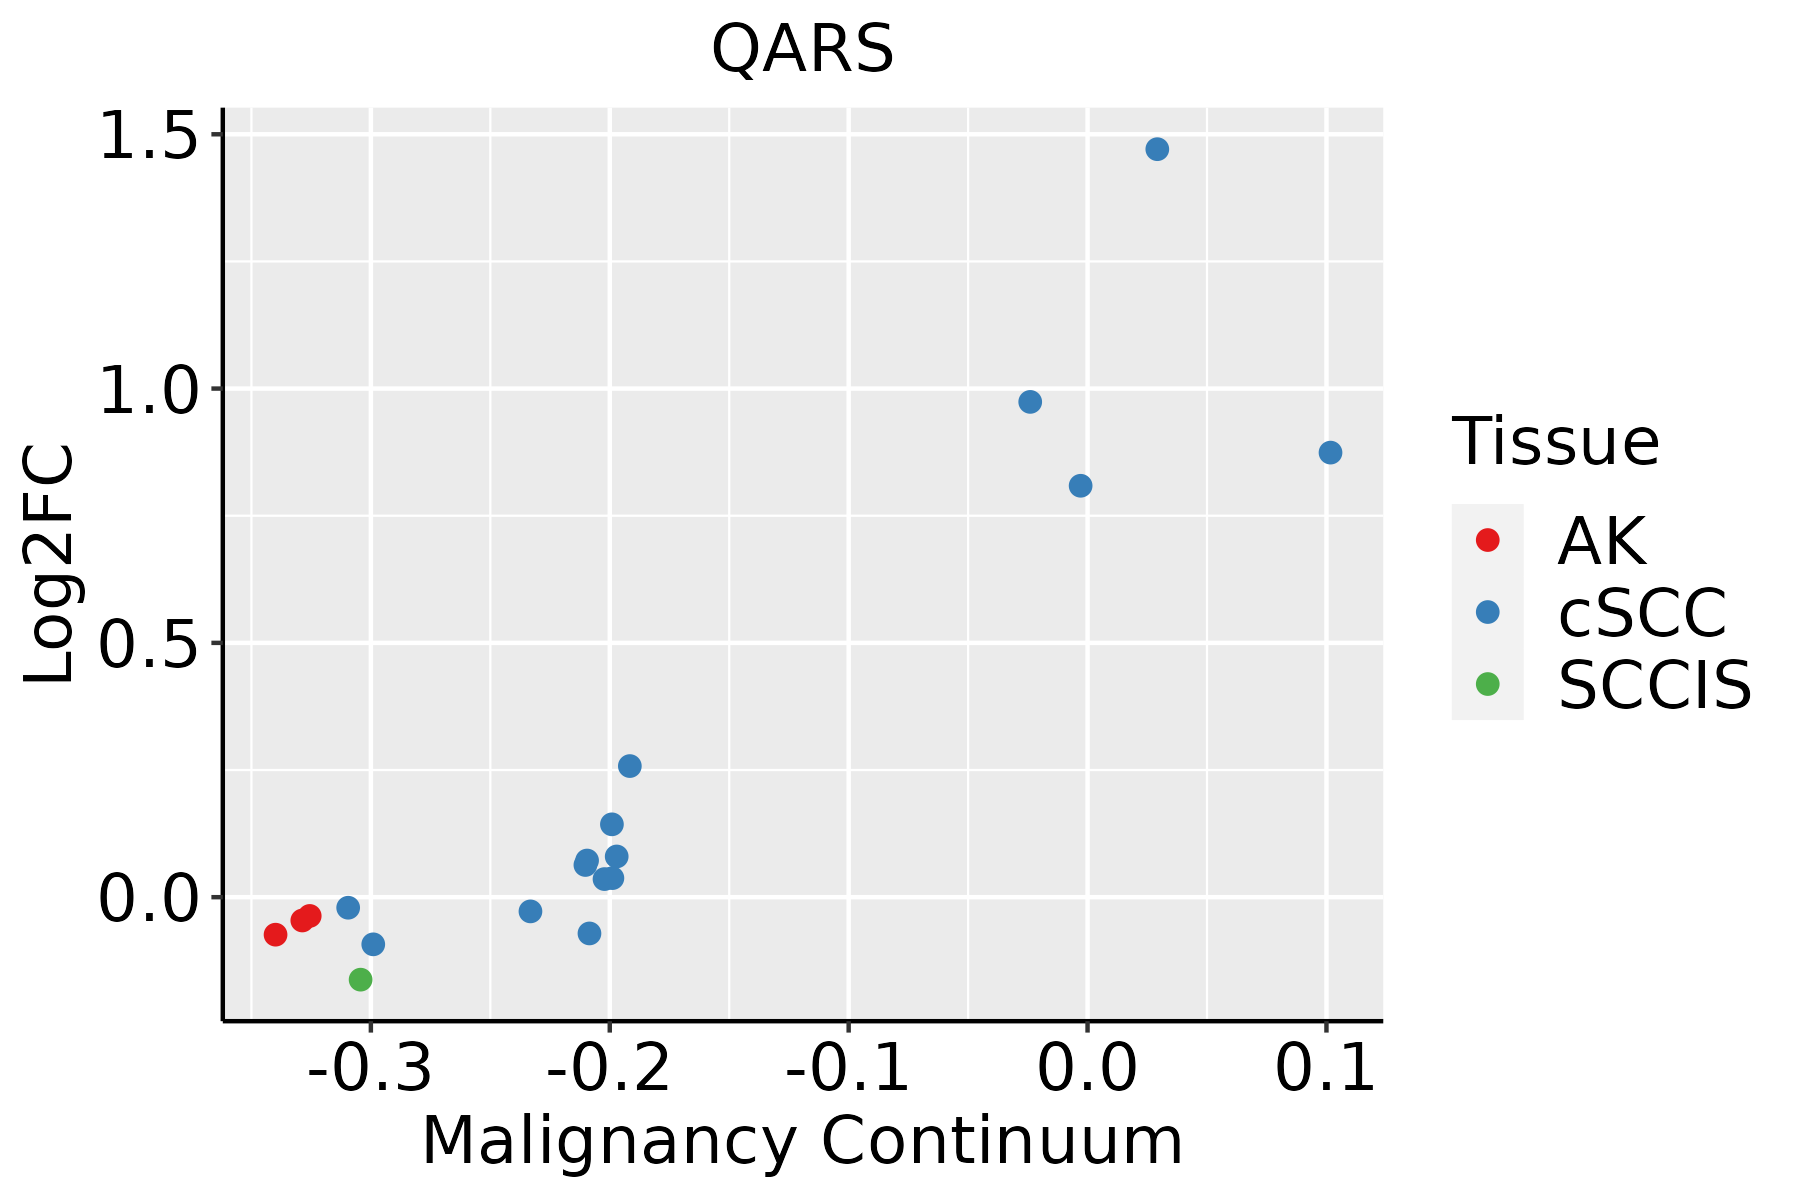 | AK: Actinic keratosis |
| cSCC: Cutaneous squamous cell carcinoma |
| SCCIS:squamous cell carcinoma in situ |
| Thyroid |  | ATC: Anaplastic thyroid cancer |
| HT: Hashimoto's thyroiditis |
| PTC: Papillary thyroid cancer |
| GO ID | Tissue | Disease Stage | Description | Gene Ratio | Bg Ratio | pvalue | p.adjust | Count |
| GO:2001233 | Colorectum | AD | regulation of apoptotic signaling pathway | 119/3918 | 356/18723 | 2.14e-08 | 1.21e-06 | 119 |
| GO:0010563 | Colorectum | AD | negative regulation of phosphorus metabolic process | 130/3918 | 442/18723 | 1.26e-05 | 2.76e-04 | 130 |
| GO:2001234 | Colorectum | AD | negative regulation of apoptotic signaling pathway | 74/3918 | 224/18723 | 1.49e-05 | 3.18e-04 | 74 |
| GO:0045936 | Colorectum | AD | negative regulation of phosphate metabolic process | 129/3918 | 441/18723 | 1.81e-05 | 3.76e-04 | 129 |
| GO:0051348 | Colorectum | AD | negative regulation of transferase activity | 85/3918 | 268/18723 | 2.07e-05 | 4.19e-04 | 85 |
| GO:0042326 | Colorectum | AD | negative regulation of phosphorylation | 112/3918 | 385/18723 | 8.02e-05 | 1.27e-03 | 112 |
| GO:0001933 | Colorectum | AD | negative regulation of protein phosphorylation | 101/3918 | 342/18723 | 9.39e-05 | 1.42e-03 | 101 |
| GO:0006418 | Colorectum | AD | tRNA aminoacylation for protein translation | 19/3918 | 41/18723 | 2.37e-04 | 3.03e-03 | 19 |
| GO:0043409 | Colorectum | AD | negative regulation of MAPK cascade | 57/3918 | 180/18723 | 4.61e-04 | 5.14e-03 | 57 |
| GO:0051403 | Colorectum | AD | stress-activated MAPK cascade | 72/3918 | 239/18723 | 4.77e-04 | 5.25e-03 | 72 |
| GO:0031098 | Colorectum | AD | stress-activated protein kinase signaling cascade | 74/3918 | 247/18723 | 4.80e-04 | 5.27e-03 | 74 |
| GO:0006469 | Colorectum | AD | negative regulation of protein kinase activity | 65/3918 | 212/18723 | 5.21e-04 | 5.62e-03 | 65 |
| GO:0033673 | Colorectum | AD | negative regulation of kinase activity | 71/3918 | 237/18723 | 6.18e-04 | 6.47e-03 | 71 |
| GO:0043039 | Colorectum | AD | tRNA aminoacylation | 19/3918 | 44/18723 | 7.13e-04 | 7.21e-03 | 19 |
| GO:0043038 | Colorectum | AD | amino acid activation | 19/3918 | 45/18723 | 9.94e-04 | 9.28e-03 | 19 |
| GO:0006520 | Colorectum | AD | cellular amino acid metabolic process | 81/3918 | 284/18723 | 1.37e-03 | 1.19e-02 | 81 |
| GO:0070302 | Colorectum | AD | regulation of stress-activated protein kinase signaling cascade | 58/3918 | 195/18723 | 2.21e-03 | 1.74e-02 | 58 |
| GO:0032872 | Colorectum | AD | regulation of stress-activated MAPK cascade | 57/3918 | 192/18723 | 2.51e-03 | 1.92e-02 | 57 |
| GO:0032873 | Colorectum | AD | negative regulation of stress-activated MAPK cascade | 19/3918 | 51/18723 | 5.44e-03 | 3.55e-02 | 19 |
| GO:0070303 | Colorectum | AD | negative regulation of stress-activated protein kinase signaling cascade | 19/3918 | 51/18723 | 5.44e-03 | 3.55e-02 | 19 |
| Hugo Symbol | Variant Class | Variant Classification | dbSNP RS | HGVSc | HGVSp | HGVSp Short | SWISSPROT | BIOTYPE | SIFT | PolyPhen | Tumor Sample Barcode | Tissue | Histology | Sex | Age | Stage | Therapy Types | Drugs | Outcome |
| QARS | SNV | Missense_Mutation | | c.2311N>C | p.Asp771His | p.D771H | P47897 | protein_coding | deleterious(0) | probably_damaging(1) | TCGA-AC-A23H-01 | Breast | breast invasive carcinoma | Female | >=65 | I/II | Unknown | Unknown | PD |
| QARS | SNV | Missense_Mutation | | c.2236N>G | p.Leu746Val | p.L746V | P47897 | protein_coding | tolerated(0.56) | benign(0.006) | TCGA-AC-A23H-01 | Breast | breast invasive carcinoma | Female | >=65 | I/II | Unknown | Unknown | PD |
| QARS | SNV | Missense_Mutation | | c.852N>G | p.Ile284Met | p.I284M | P47897 | protein_coding | tolerated(0.31) | probably_damaging(1) | TCGA-AC-A23H-01 | Breast | breast invasive carcinoma | Female | >=65 | I/II | Unknown | Unknown | PD |
| QARS | SNV | Missense_Mutation | | c.494T>G | p.Ile165Ser | p.I165S | P47897 | protein_coding | deleterious(0) | possibly_damaging(0.841) | TCGA-AO-A03P-01 | Breast | breast invasive carcinoma | Female | <65 | I/II | Hormone Therapy | letrozole | PD |
| QARS | SNV | Missense_Mutation | | c.1885N>T | p.Arg629Cys | p.R629C | P47897 | protein_coding | deleterious(0.01) | probably_damaging(1) | TCGA-AR-A24H-01 | Breast | breast invasive carcinoma | Female | >=65 | I/II | Hormone Therapy | tamoxiphen | SD |
| QARS | SNV | Missense_Mutation | rs201359259 | c.321N>A | p.Phe107Leu | p.F107L | P47897 | protein_coding | tolerated(0.08) | possibly_damaging(0.674) | TCGA-GM-A4E0-01 | Breast | breast invasive carcinoma | Female | >=65 | III/IV | Chemotherapy | xeloda | CR |
| QARS | insertion | Frame_Shift_Ins | rs772343264 | c.679_680insG | p.Glu227GlyfsTer4 | p.E227Gfs*4 | P47897 | protein_coding | | | TCGA-A8-A06X-01 | Breast | breast invasive carcinoma | Female | >=65 | I/II | Unknown | Unknown | SD |
| QARS | insertion | Frame_Shift_Ins | novel | c.1696_1697insGAAAGATATTATTTTTAATATCTTTCGTTAAG | p.Pro566ArgfsTer84 | p.P566Rfs*84 | P47897 | protein_coding | | | TCGA-AO-A0JE-01 | Breast | breast invasive carcinoma | Female | <65 | III/IV | Chemotherapy | doxorubicin | SD |
| QARS | SNV | Missense_Mutation | rs370681625 | c.1208N>A | p.Arg403Gln | p.R403Q | P47897 | protein_coding | deleterious(0) | probably_damaging(1) | TCGA-A6-2686-01 | Colorectum | colon adenocarcinoma | Female | >=65 | I/II | Unknown | Unknown | SD |
| QARS | SNV | Missense_Mutation | rs766000850 | c.460C>T | p.Arg154Trp | p.R154W | P47897 | protein_coding | deleterious(0) | probably_damaging(0.998) | TCGA-AA-3672-01 | Colorectum | colon adenocarcinoma | Female | >=65 | III/IV | Unknown | Unknown | SD |


