
|
|||||
|
 | |
| |
| |
| |
| |
| |
|
Gene: PYURF |
Gene summary for PYURF |
| Gene information | Species | Human | Gene symbol | PYURF | Gene ID | 100996939 |
| Gene name | PIGY upstream open reading frame | |
| Gene Alias | PREY | |
| Cytomap | 4q22.1 | |
| Gene Type | protein-coding | GO ID | GO:0006464 | UniProtAcc | Q96I23 |
Top |
Malignant transformation analysis |
| Identification of the aberrant gene expression in precancerous and cancerous lesions by comparing the gene expression of stem-like cells in diseased tissues with normal stem cells |
| Entrez ID | Symbol | Replicates | Species | Organ | Tissue | Adj P-value | Log2FC | Malignancy |
| 100996939 | PYURF | GSM4909286 | Human | Breast | IDC | 7.16e-05 | 1.18e-01 | 0.1081 |
| 100996939 | PYURF | GSM4909290 | Human | Breast | IDC | 2.00e-04 | 3.69e-01 | 0.2096 |
| 100996939 | PYURF | GSM4909293 | Human | Breast | IDC | 1.10e-02 | -2.34e-01 | 0.1581 |
| 100996939 | PYURF | GSM4909294 | Human | Breast | IDC | 1.49e-04 | -2.23e-01 | 0.2022 |
| 100996939 | PYURF | GSM4909296 | Human | Breast | IDC | 1.15e-12 | -2.12e-01 | 0.1524 |
| 100996939 | PYURF | GSM4909297 | Human | Breast | IDC | 7.66e-12 | -2.47e-01 | 0.1517 |
| 100996939 | PYURF | GSM4909301 | Human | Breast | IDC | 2.69e-17 | -4.83e-01 | 0.1577 |
| 100996939 | PYURF | GSM4909306 | Human | Breast | IDC | 8.04e-04 | 2.96e-01 | 0.1564 |
| 100996939 | PYURF | GSM4909311 | Human | Breast | IDC | 1.07e-37 | -5.23e-01 | 0.1534 |
| 100996939 | PYURF | GSM4909312 | Human | Breast | IDC | 2.34e-10 | -1.99e-01 | 0.1552 |
| 100996939 | PYURF | GSM4909313 | Human | Breast | IDC | 3.94e-03 | 1.28e-02 | 0.0391 |
| 100996939 | PYURF | GSM4909315 | Human | Breast | IDC | 2.47e-07 | -3.59e-01 | 0.21 |
| 100996939 | PYURF | GSM4909319 | Human | Breast | IDC | 7.45e-43 | -3.29e-01 | 0.1563 |
| 100996939 | PYURF | GSM4909320 | Human | Breast | IDC | 1.51e-13 | -5.09e-01 | 0.1575 |
| 100996939 | PYURF | GSM4909321 | Human | Breast | IDC | 2.39e-24 | -4.02e-01 | 0.1559 |
| 100996939 | PYURF | brca3 | Human | Breast | Precancer | 6.09e-04 | 2.01e-02 | -0.0263 |
| 100996939 | PYURF | brca10 | Human | Breast | Precancer | 2.58e-07 | -3.74e-01 | -0.0029 |
| 100996939 | PYURF | NCCBC14 | Human | Breast | DCIS | 1.29e-12 | -2.85e-01 | 0.2021 |
| 100996939 | PYURF | NCCBC2 | Human | Breast | DCIS | 1.11e-03 | -2.11e-01 | 0.1554 |
| 100996939 | PYURF | NCCBC3 | Human | Breast | DCIS | 1.22e-02 | -1.49e-01 | 0.1198 |
| Page: 1 2 3 4 5 6 7 8 9 |
| Tissue | Expression Dynamics | Abbreviation |
| Breast | 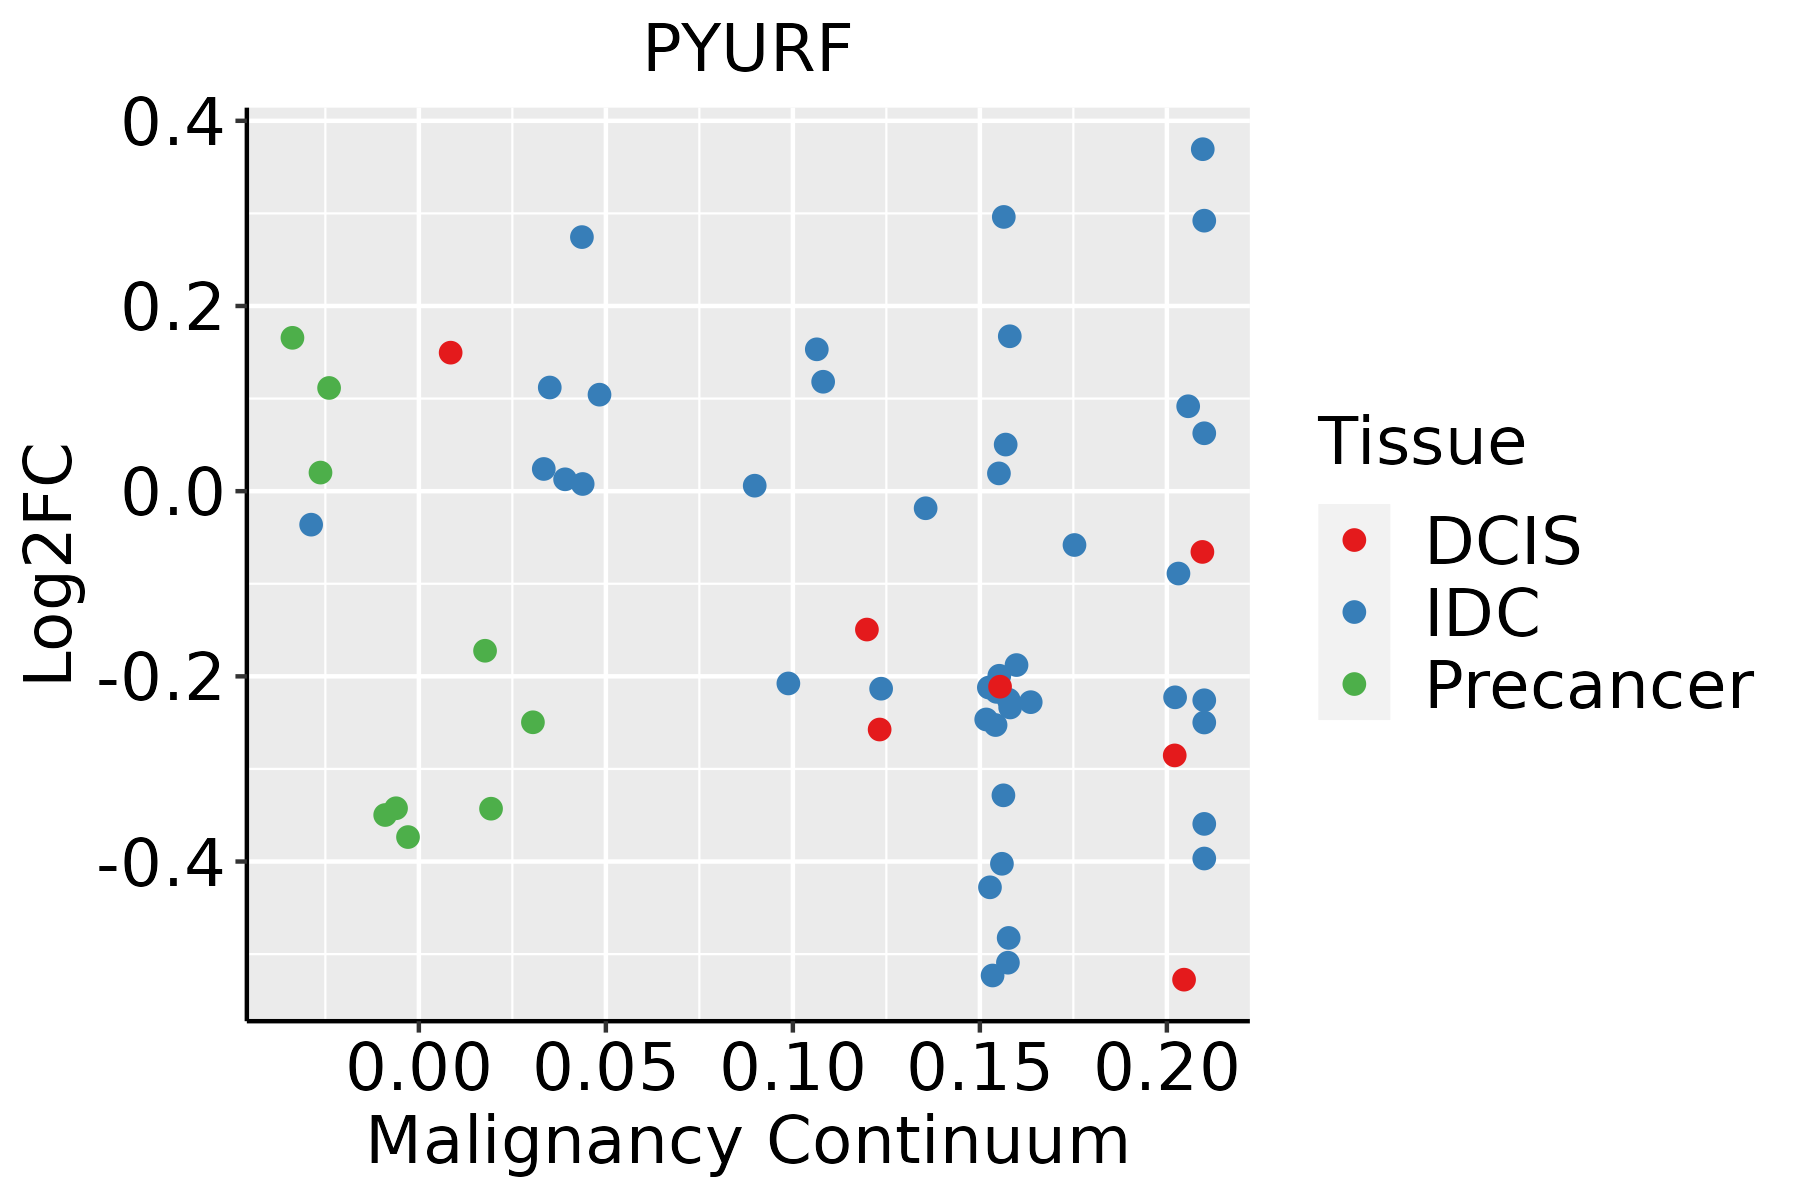 | IDC: Invasive ductal carcinoma |
| DCIS: Ductal carcinoma in situ | ||
| Precancer(BRCA1-mut): Precancerous lesion from BRCA1 mutation carriers | ||
| Endometrium | 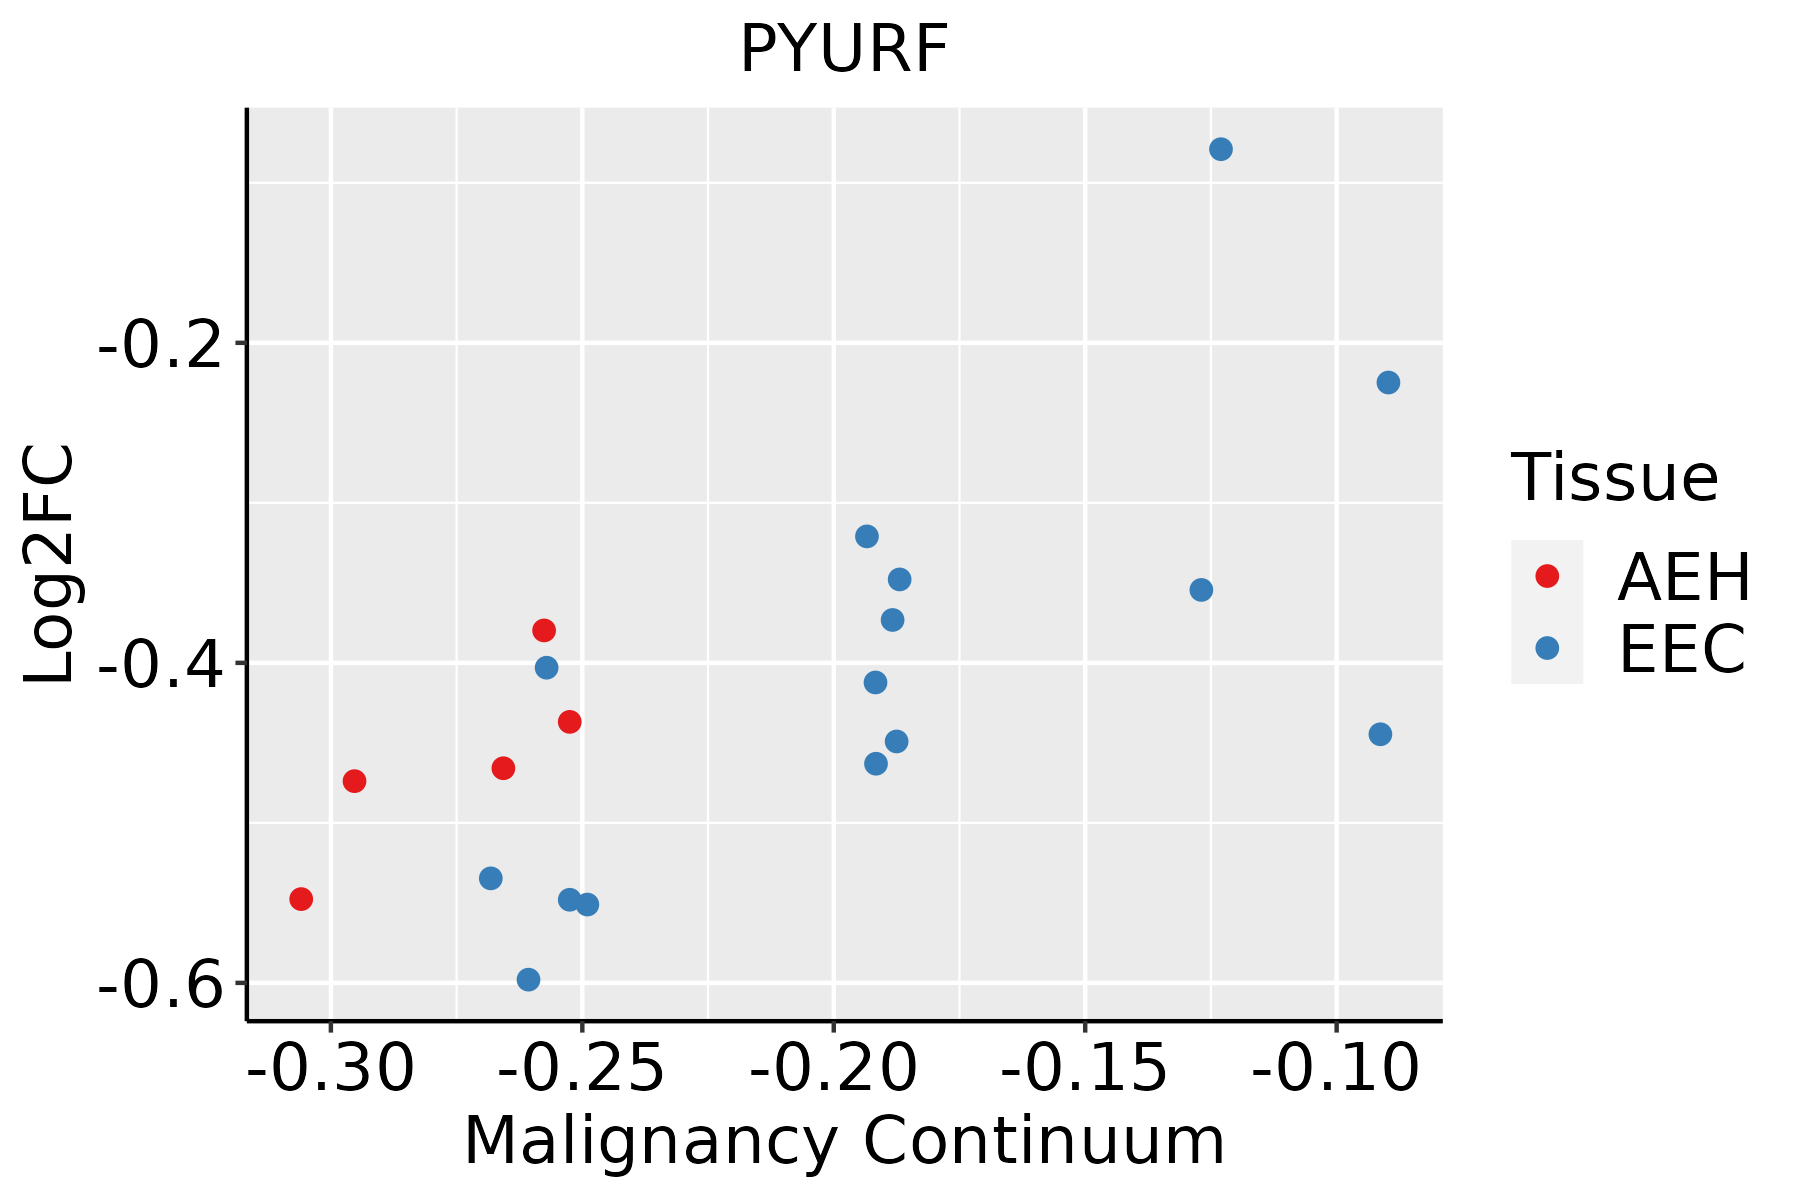 | AEH: Atypical endometrial hyperplasia |
| EEC: Endometrioid Cancer | ||
| Esophagus | 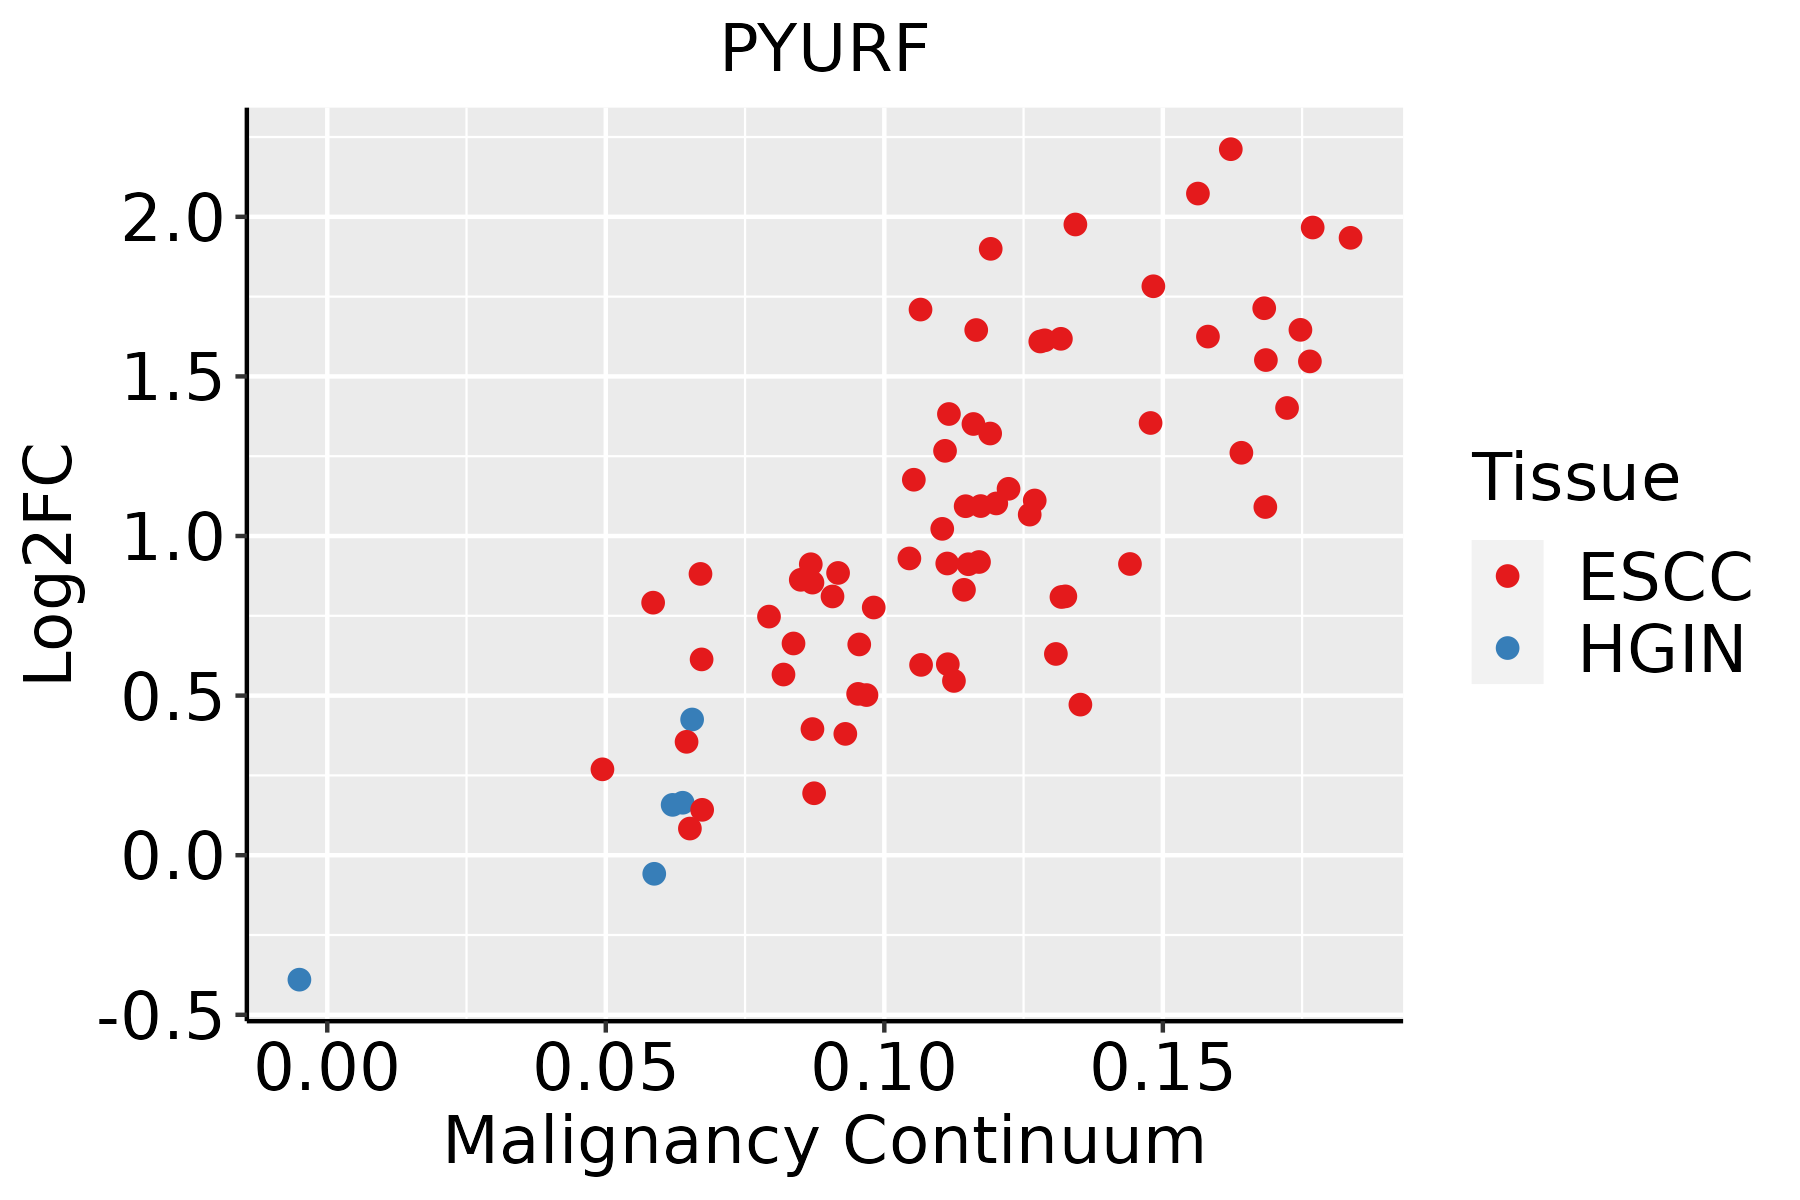 | ESCC: Esophageal squamous cell carcinoma |
| HGIN: High-grade intraepithelial neoplasias | ||
| LGIN: Low-grade intraepithelial neoplasias | ||
| Liver |  | HCC: Hepatocellular carcinoma |
| NAFLD: Non-alcoholic fatty liver disease | ||
| Oral Cavity |  | EOLP: Erosive Oral lichen planus |
| LP: leukoplakia | ||
| NEOLP: Non-erosive oral lichen planus | ||
| OSCC: Oral squamous cell carcinoma | ||
| Prostate | 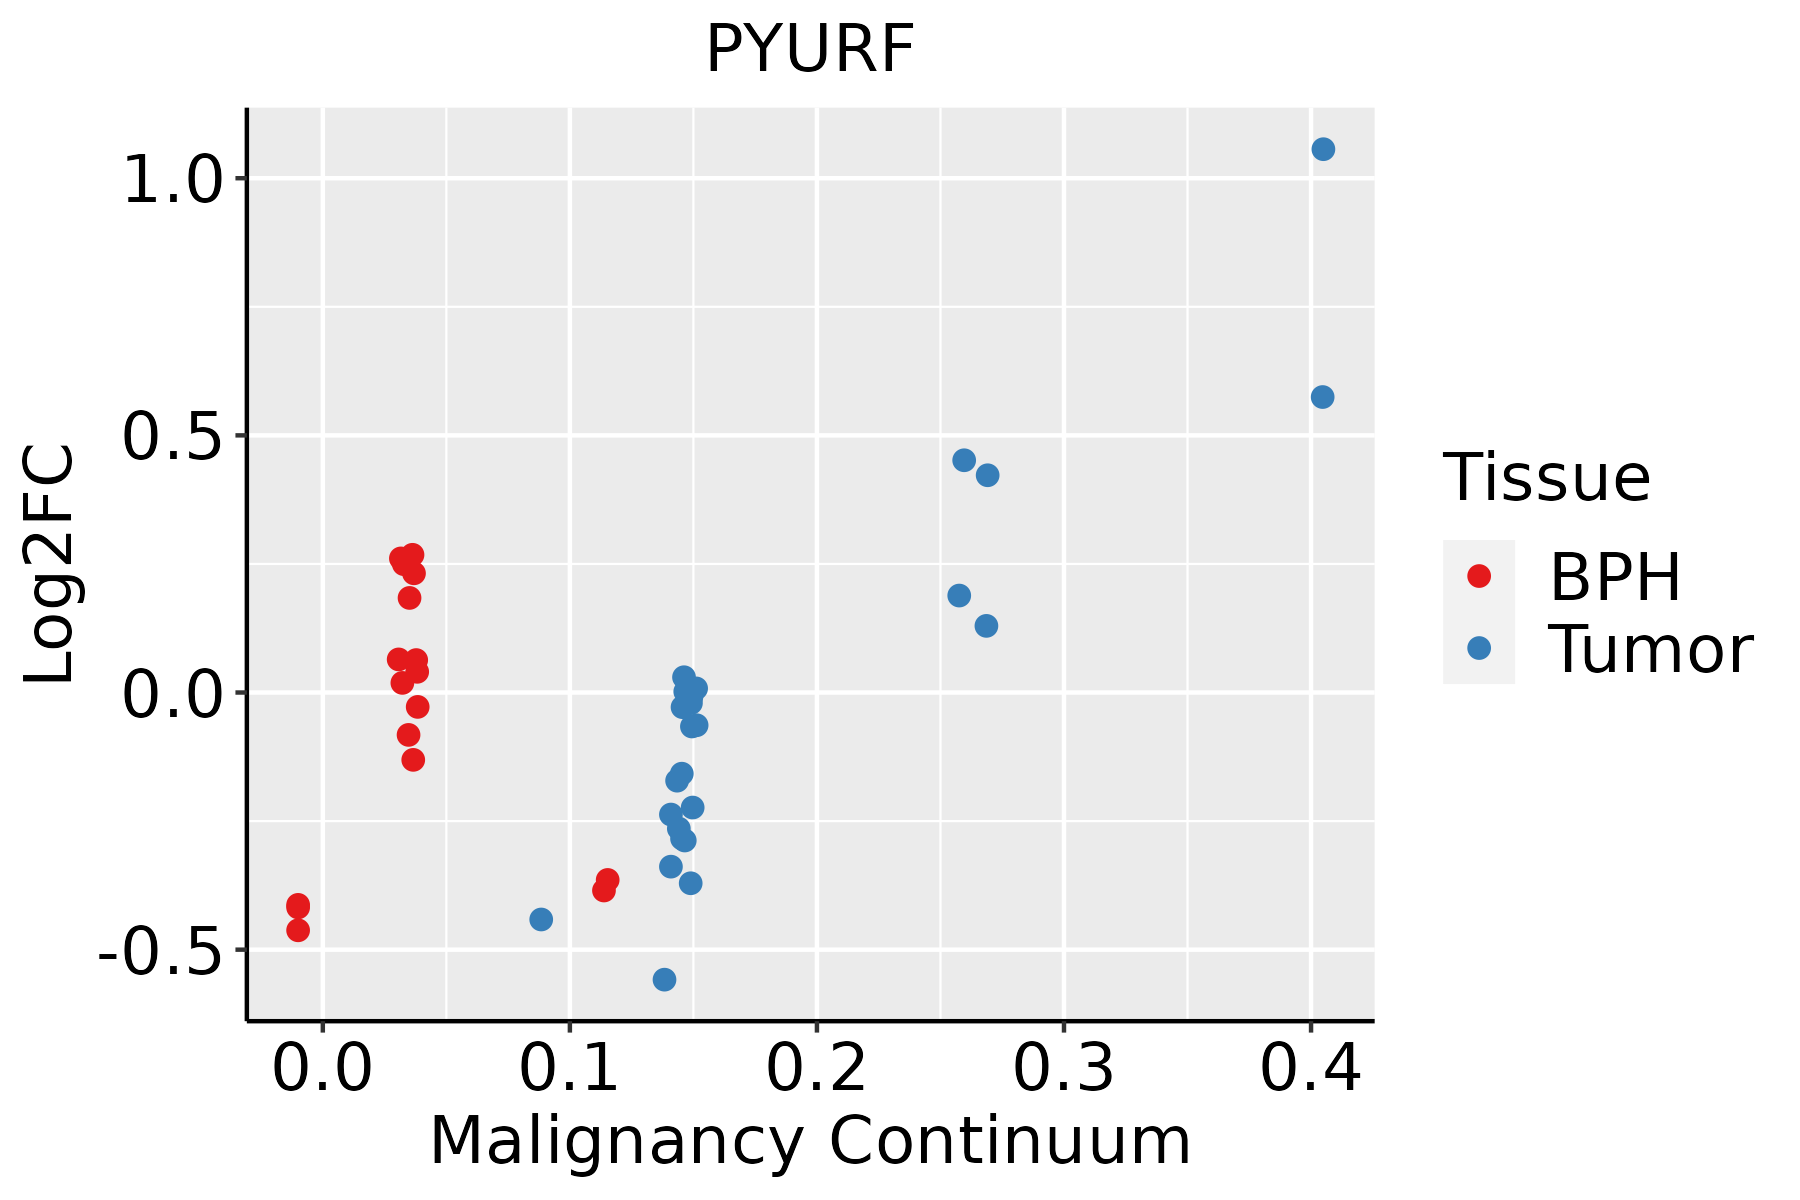 | BPH: Benign Prostatic Hyperplasia |
| Skin | 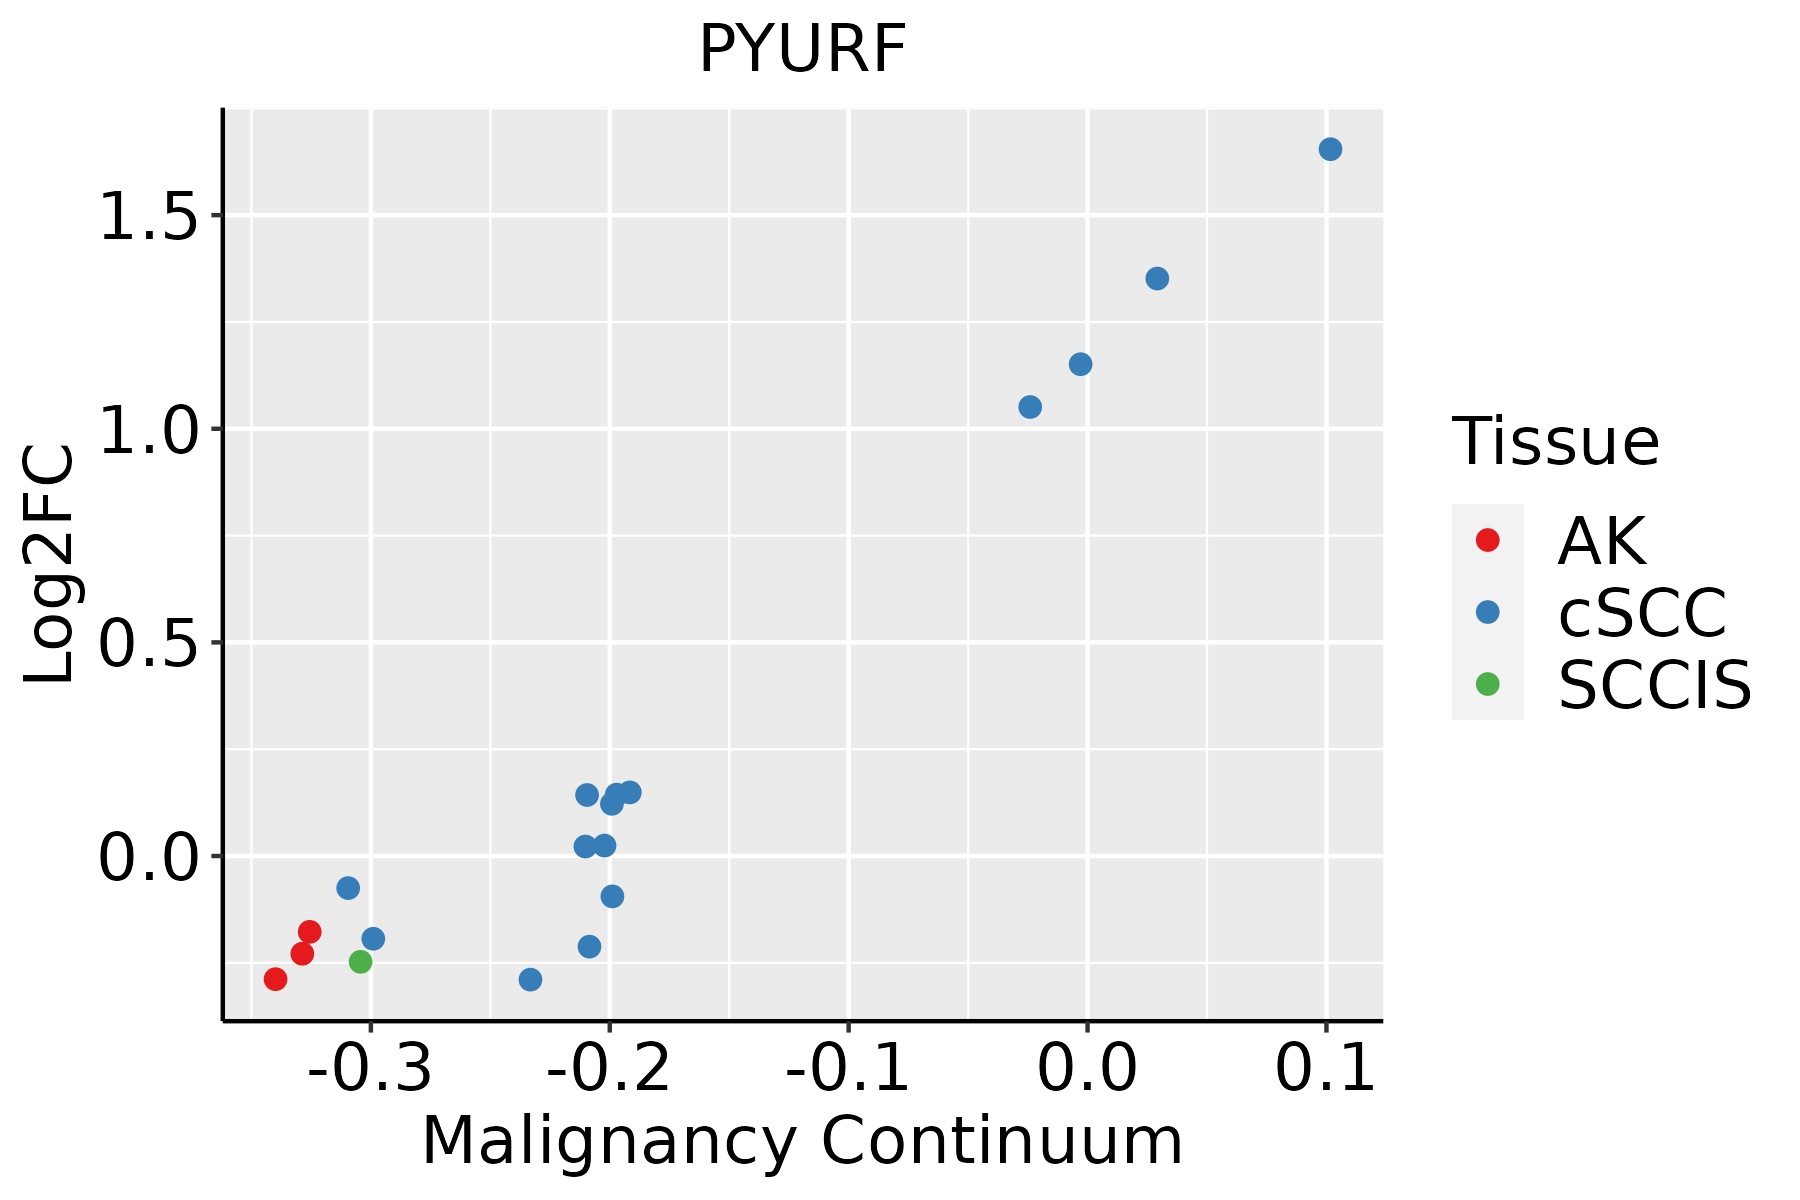 | AK: Actinic keratosis |
| cSCC: Cutaneous squamous cell carcinoma | ||
| SCCIS:squamous cell carcinoma in situ | ||
| Thyroid |  | ATC: Anaplastic thyroid cancer |
| HT: Hashimoto's thyroiditis | ||
| PTC: Papillary thyroid cancer |
| ∗log2FC in expression of this searched gene in stem-like cells from each diseased tissue sample relative to stem-like cells in normal samples in each tissue plotted against the malignancy continuum. Samples are colored based on if they are from different disease stage. |
Top |
Malignant transformation related pathway analysis |
| Find out the enriched GO biological processes and KEGG pathways involved in transition from healthy to precancer to cancer |
| Tissue | Disease Stage | Enriched GO biological Processes |
| Colorectum | AD |  |
| Colorectum | SER |  |
| Colorectum | MSS |  |
| Colorectum | MSI-H |  |
| Colorectum | FAP |  |
| ∗Top 15 enriched GO BP terms are showed in the bar plot of each disease state in each tissue. Each row represents a significant GO biological process which is colored according to the -log10(p.adjust). |
| Page: 1 2 3 4 5 6 7 8 9 |
| GO ID | Tissue | Disease Stage | Description | Gene Ratio | Bg Ratio | pvalue | p.adjust | Count |
| GO:00086544 | Esophagus | ESCC | phospholipid biosynthetic process | 162/8552 | 253/18723 | 2.59e-09 | 5.73e-08 | 162 |
| GO:00464744 | Esophagus | ESCC | glycerophospholipid biosynthetic process | 135/8552 | 211/18723 | 5.75e-08 | 1.02e-06 | 135 |
| GO:00066433 | Esophagus | ESCC | membrane lipid metabolic process | 130/8552 | 203/18723 | 9.29e-08 | 1.54e-06 | 130 |
| GO:00450175 | Esophagus | ESCC | glycerolipid biosynthetic process | 154/8552 | 252/18723 | 5.20e-07 | 6.96e-06 | 154 |
| GO:00066446 | Esophagus | ESCC | phospholipid metabolic process | 218/8552 | 383/18723 | 5.37e-06 | 5.59e-05 | 218 |
| GO:00464673 | Esophagus | ESCC | membrane lipid biosynthetic process | 91/8552 | 142/18723 | 7.19e-06 | 7.19e-05 | 91 |
| GO:00421573 | Esophagus | ESCC | lipoprotein metabolic process | 86/8552 | 135/18723 | 1.78e-05 | 1.57e-04 | 86 |
| GO:00064973 | Esophagus | ESCC | protein lipidation | 62/8552 | 92/18723 | 2.08e-05 | 1.80e-04 | 62 |
| GO:00421583 | Esophagus | ESCC | lipoprotein biosynthetic process | 64/8552 | 96/18723 | 2.61e-05 | 2.20e-04 | 64 |
| GO:00065063 | Esophagus | ESCC | GPI anchor biosynthetic process | 26/8552 | 32/18723 | 3.97e-05 | 3.21e-04 | 26 |
| GO:00066505 | Esophagus | ESCC | glycerophospholipid metabolic process | 174/8552 | 306/18723 | 4.92e-05 | 3.85e-04 | 174 |
| GO:00065053 | Esophagus | ESCC | GPI anchor metabolic process | 26/8552 | 33/18723 | 1.06e-04 | 7.43e-04 | 26 |
| GO:00066642 | Esophagus | ESCC | glycolipid metabolic process | 63/8552 | 100/18723 | 3.55e-04 | 2.06e-03 | 63 |
| GO:19035092 | Esophagus | ESCC | liposaccharide metabolic process | 63/8552 | 101/18723 | 5.25e-04 | 2.90e-03 | 63 |
| GO:00464864 | Esophagus | ESCC | glycerolipid metabolic process | 211/8552 | 392/18723 | 6.51e-04 | 3.46e-03 | 211 |
| GO:0009247 | Esophagus | ESCC | glycolipid biosynthetic process | 42/8552 | 68/18723 | 5.48e-03 | 2.05e-02 | 42 |
| GO:00066611 | Esophagus | ESCC | phosphatidylinositol biosynthetic process | 73/8552 | 131/18723 | 1.31e-02 | 4.28e-02 | 73 |
| GO:0042157 | Liver | Cirrhotic | lipoprotein metabolic process | 53/4634 | 135/18723 | 1.32e-04 | 1.29e-03 | 53 |
| GO:0006643 | Liver | Cirrhotic | membrane lipid metabolic process | 69/4634 | 203/18723 | 1.89e-03 | 1.19e-02 | 69 |
| GO:0042158 | Liver | Cirrhotic | lipoprotein biosynthetic process | 36/4634 | 96/18723 | 3.69e-03 | 2.03e-02 | 36 |
| Page: 1 2 3 |
| Pathway ID | Tissue | Disease Stage | Description | Gene Ratio | Bg Ratio | pvalue | p.adjust | qvalue | Count |
| Page: 1 |
Top |
Cell-cell communication analysis |
| Identification of potential cell-cell interactions between two cell types and their ligand-receptor pairs for different disease states |
| Ligand | Receptor | LRpair | Pathway | Tissue | Disease Stage |
| Page: 1 |
Top |
Single-cell gene regulatory network inference analysis |
| Find out the significant the regulons (TFs) and the target genes of each regulon across cell types for different disease states |
| TF | Cell Type | Tissue | Disease Stage | Target Gene | RSS | Regulon Activity |
| ∗The dot plots of a searched regulon are shown for all cell subpopulations in each disease state of each tissue based on the regulon specific score inferred using pySCENIC and by calculating the average expression. |
| Page: 1 |
Top |
Somatic mutation of malignant transformation related genes |
| Annotation of somatic variants for genes involved in malignant transformation |
| Hugo Symbol | Variant Class | Variant Classification | dbSNP RS | HGVSc | HGVSp | HGVSp Short | SWISSPROT | BIOTYPE | SIFT | PolyPhen | Tumor Sample Barcode | Tissue | Histology | Sex | Age | Stage | Therapy Types | Drugs | Outcome |
| PYURF | SNV | Missense_Mutation | rs746596393 | c.233A>T | p.Asn78Ile | p.N78I | Q96I23 | protein_coding | deleterious(0) | probably_damaging(1) | TCGA-A8-A07F-01 | Breast | breast invasive carcinoma | Female | >=65 | I/II | Hormone Therapy | tamoxiphen | SD |
| PYURF | insertion | In_Frame_Ins | rs751566417 | c.233_234insGCC | p.Asn78delinsLysPro | p.N78delinsKP | Q96I23 | protein_coding | TCGA-A8-A07F-01 | Breast | breast invasive carcinoma | Female | >=65 | I/II | Hormone Therapy | tamoxiphen | SD | ||
| PYURF | SNV | Missense_Mutation | novel | c.304A>G | p.Thr102Ala | p.T102A | Q96I23 | protein_coding | tolerated(0.11) | benign(0.009) | TCGA-A5-A0VP-01 | Endometrium | uterine corpus endometrioid carcinoma | Female | >=65 | I/II | Unknown | Unknown | SD |
| PYURF | SNV | Missense_Mutation | c.223N>A | p.Glu75Lys | p.E75K | Q96I23 | protein_coding | tolerated(0.05) | possibly_damaging(0.68) | TCGA-B5-A0JY-01 | Endometrium | uterine corpus endometrioid carcinoma | Female | <65 | III/IV | Chemotherapy | doxorubicin | SD | |
| PYURF | SNV | Missense_Mutation | novel | c.336N>T | p.Glu112Asp | p.E112D | Q96I23 | protein_coding | deleterious(0.01) | benign(0.433) | TCGA-DF-A2KU-01 | Endometrium | uterine corpus endometrioid carcinoma | Female | Unknown | I/II | Unknown | Unknown | SD |
| PYURF | SNV | Missense_Mutation | novel | c.341G>A | p.Arg114His | p.R114H | Q96I23 | protein_coding | tolerated_low_confidence(1) | benign(0) | TCGA-EO-A22U-01 | Endometrium | uterine corpus endometrioid carcinoma | Female | >=65 | I/II | Unknown | Unknown | SD |
| PYURF | SNV | Missense_Mutation | c.206A>G | p.Tyr69Cys | p.Y69C | Q96I23 | protein_coding | deleterious(0.01) | probably_damaging(0.994) | TCGA-NI-A4U2-01 | Liver | liver hepatocellular carcinoma | Male | >=65 | III/IV | Unknown | Unknown | PD |
| Page: 1 |
Top |
Related drugs of malignant transformation related genes |
| Identification of chemicals and drugs interact with genes involved in malignant transfromation |
| (DGIdb 4.0) |
| Entrez ID | Symbol | Category | Interaction Types | Drug Claim Name | Drug Name | PMIDs |
| Page: 1 |

Copyright 2023-Present -The University of Texas Health Science Center at Houston |