
|
|||||
|
 | |
| |
| |
| |
| |
| |
|
Gene: PYM1 |
Gene summary for PYM1 |
| Gene information | Species | Human | Gene symbol | PYM1 | Gene ID | 84305 |
| Gene name | PYM homolog 1, exon junction complex associated factor | |
| Gene Alias | PYM | |
| Cytomap | 12q13.2 | |
| Gene Type | protein-coding | GO ID | GO:0000184 | UniProtAcc | Q9BRP8 |
Top |
Malignant transformation analysis |
| Identification of the aberrant gene expression in precancerous and cancerous lesions by comparing the gene expression of stem-like cells in diseased tissues with normal stem cells |
| Entrez ID | Symbol | Replicates | Species | Organ | Tissue | Adj P-value | Log2FC | Malignancy |
| 84305 | PYM1 | LZE4T | Human | Esophagus | ESCC | 7.58e-05 | 1.55e-01 | 0.0811 |
| 84305 | PYM1 | LZE5T | Human | Esophagus | ESCC | 2.76e-04 | 4.28e-01 | 0.0514 |
| 84305 | PYM1 | LZE7T | Human | Esophagus | ESCC | 8.42e-09 | 5.06e-01 | 0.0667 |
| 84305 | PYM1 | LZE8T | Human | Esophagus | ESCC | 1.31e-03 | 2.30e-01 | 0.067 |
| 84305 | PYM1 | LZE20T | Human | Esophagus | ESCC | 3.56e-10 | 2.65e-01 | 0.0662 |
| 84305 | PYM1 | LZE22D1 | Human | Esophagus | HGIN | 2.52e-02 | 1.33e-01 | 0.0595 |
| 84305 | PYM1 | LZE22T | Human | Esophagus | ESCC | 9.17e-04 | 3.29e-01 | 0.068 |
| 84305 | PYM1 | LZE24T | Human | Esophagus | ESCC | 5.03e-16 | 5.12e-01 | 0.0596 |
| 84305 | PYM1 | P1T-E | Human | Esophagus | ESCC | 5.96e-11 | 5.97e-01 | 0.0875 |
| 84305 | PYM1 | P2T-E | Human | Esophagus | ESCC | 2.27e-22 | 3.92e-01 | 0.1177 |
| 84305 | PYM1 | P4T-E | Human | Esophagus | ESCC | 3.39e-21 | 6.42e-01 | 0.1323 |
| 84305 | PYM1 | P5T-E | Human | Esophagus | ESCC | 2.99e-16 | 3.46e-01 | 0.1327 |
| 84305 | PYM1 | P8T-E | Human | Esophagus | ESCC | 1.27e-36 | 7.20e-01 | 0.0889 |
| 84305 | PYM1 | P9T-E | Human | Esophagus | ESCC | 9.23e-16 | 3.10e-01 | 0.1131 |
| 84305 | PYM1 | P10T-E | Human | Esophagus | ESCC | 2.20e-17 | 3.55e-01 | 0.116 |
| 84305 | PYM1 | P11T-E | Human | Esophagus | ESCC | 2.00e-10 | 3.79e-01 | 0.1426 |
| 84305 | PYM1 | P12T-E | Human | Esophagus | ESCC | 1.50e-17 | 3.79e-01 | 0.1122 |
| 84305 | PYM1 | P15T-E | Human | Esophagus | ESCC | 3.37e-20 | 4.79e-01 | 0.1149 |
| 84305 | PYM1 | P16T-E | Human | Esophagus | ESCC | 1.29e-19 | 3.26e-01 | 0.1153 |
| 84305 | PYM1 | P17T-E | Human | Esophagus | ESCC | 5.07e-09 | 2.28e-01 | 0.1278 |
| Page: 1 2 3 4 5 |
| Tissue | Expression Dynamics | Abbreviation |
| Esophagus | 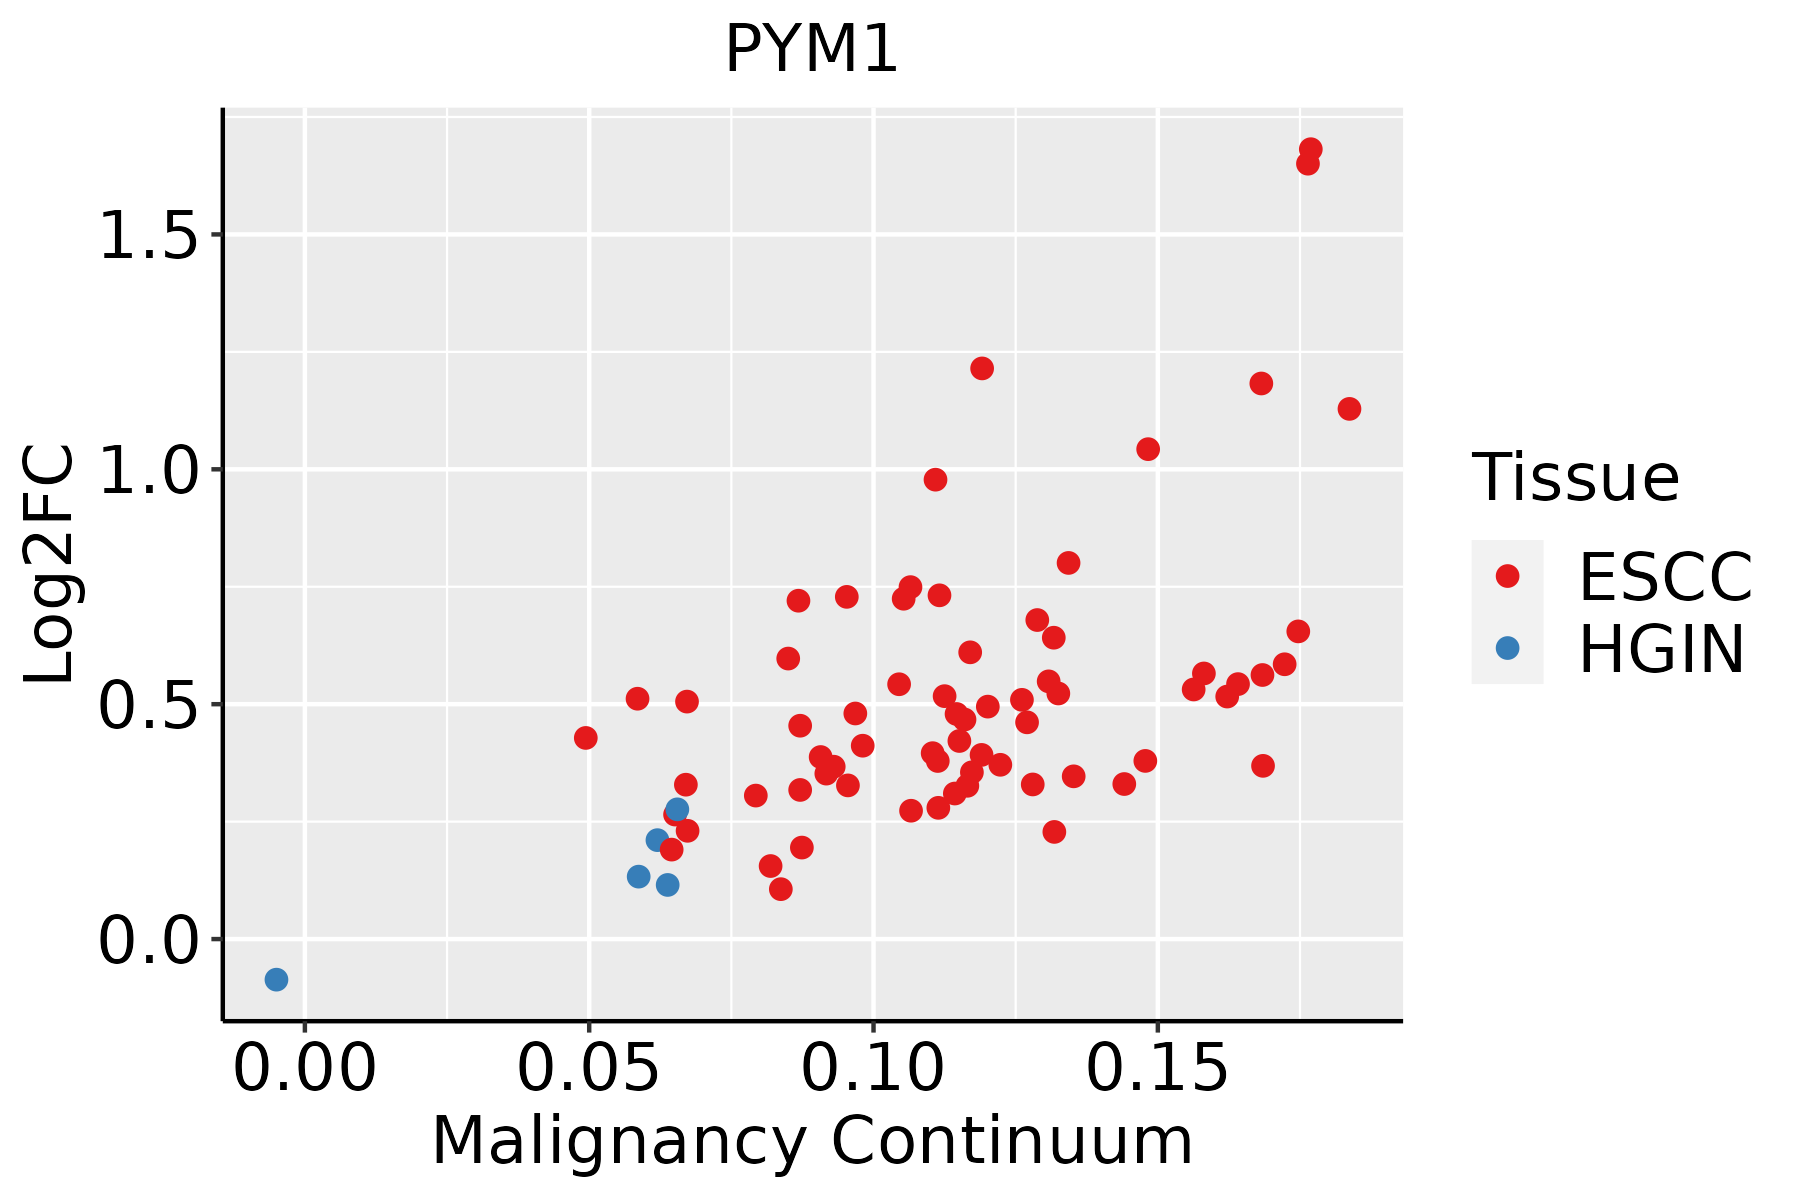 | ESCC: Esophageal squamous cell carcinoma |
| HGIN: High-grade intraepithelial neoplasias | ||
| LGIN: Low-grade intraepithelial neoplasias | ||
| Liver | 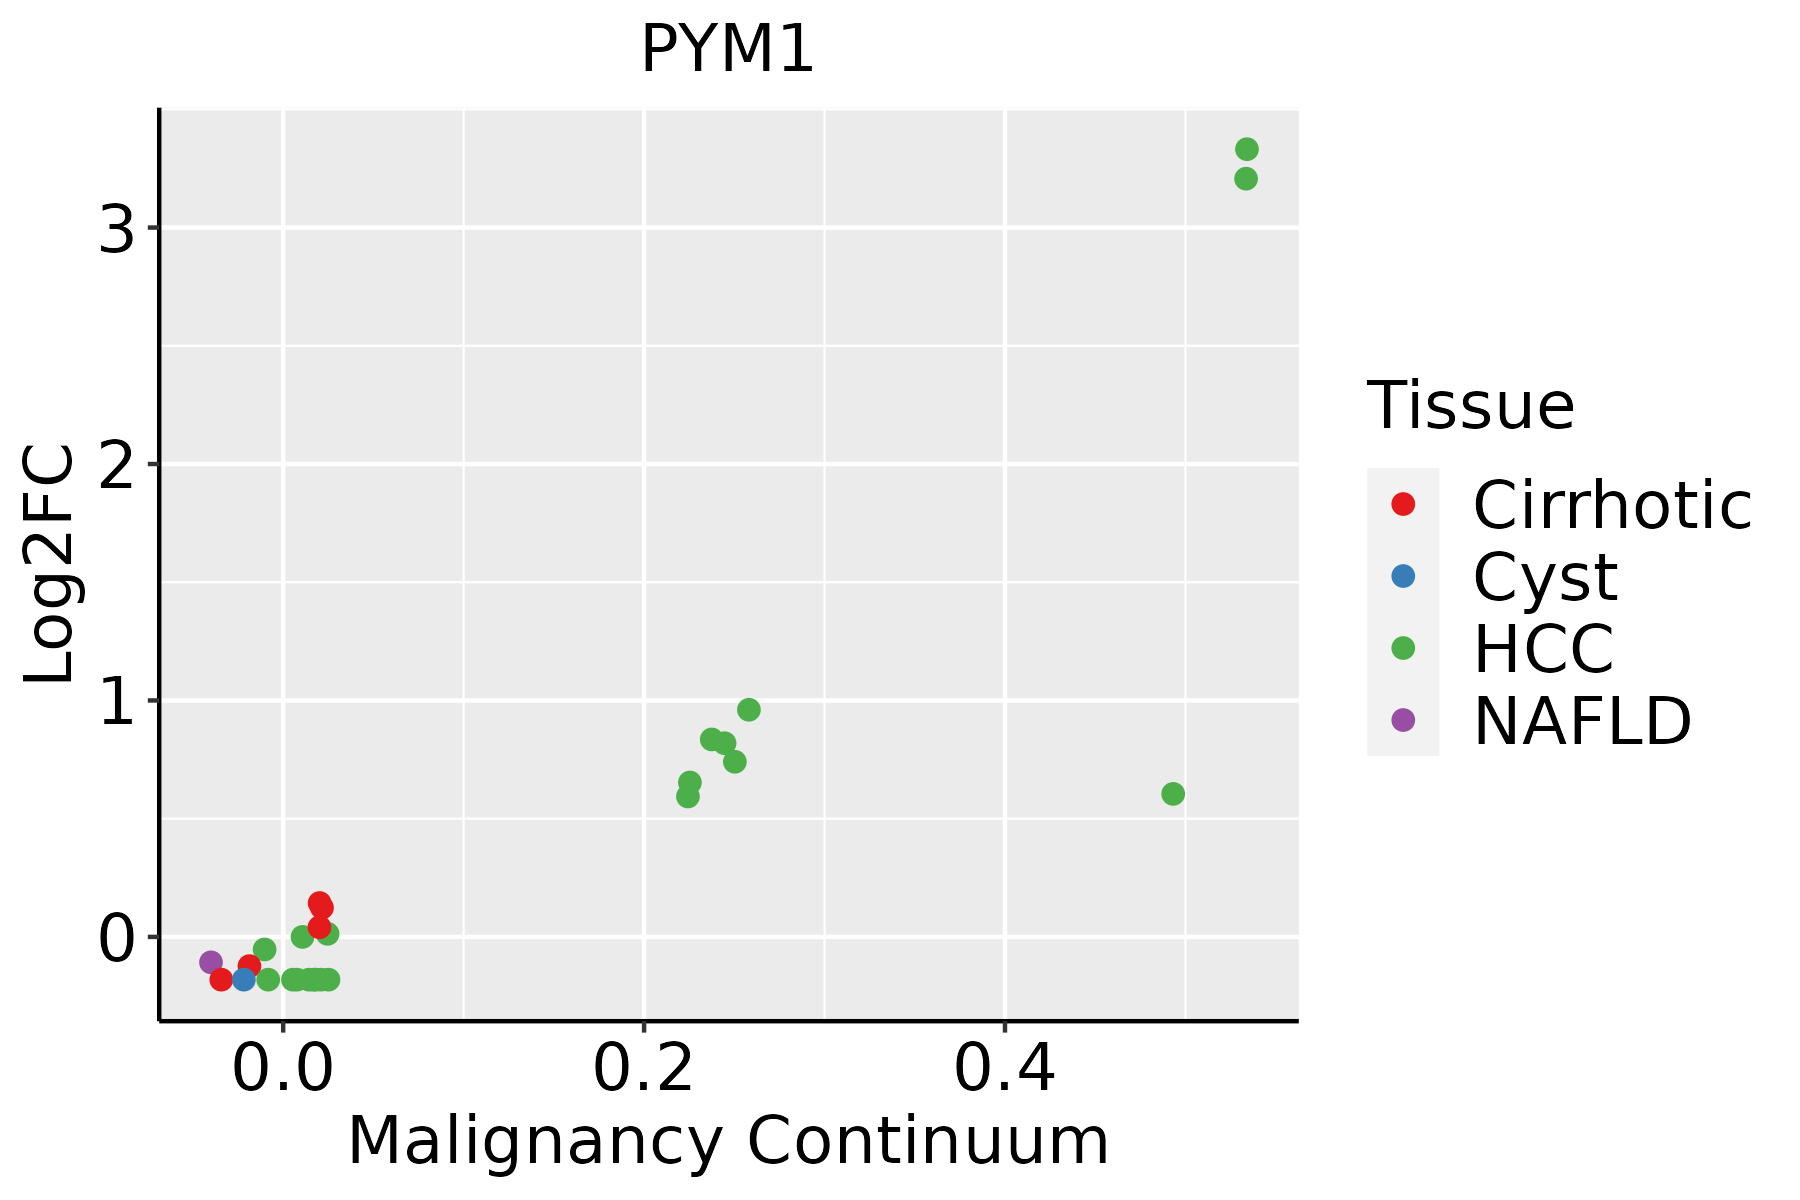 | HCC: Hepatocellular carcinoma |
| NAFLD: Non-alcoholic fatty liver disease | ||
| Oral Cavity | 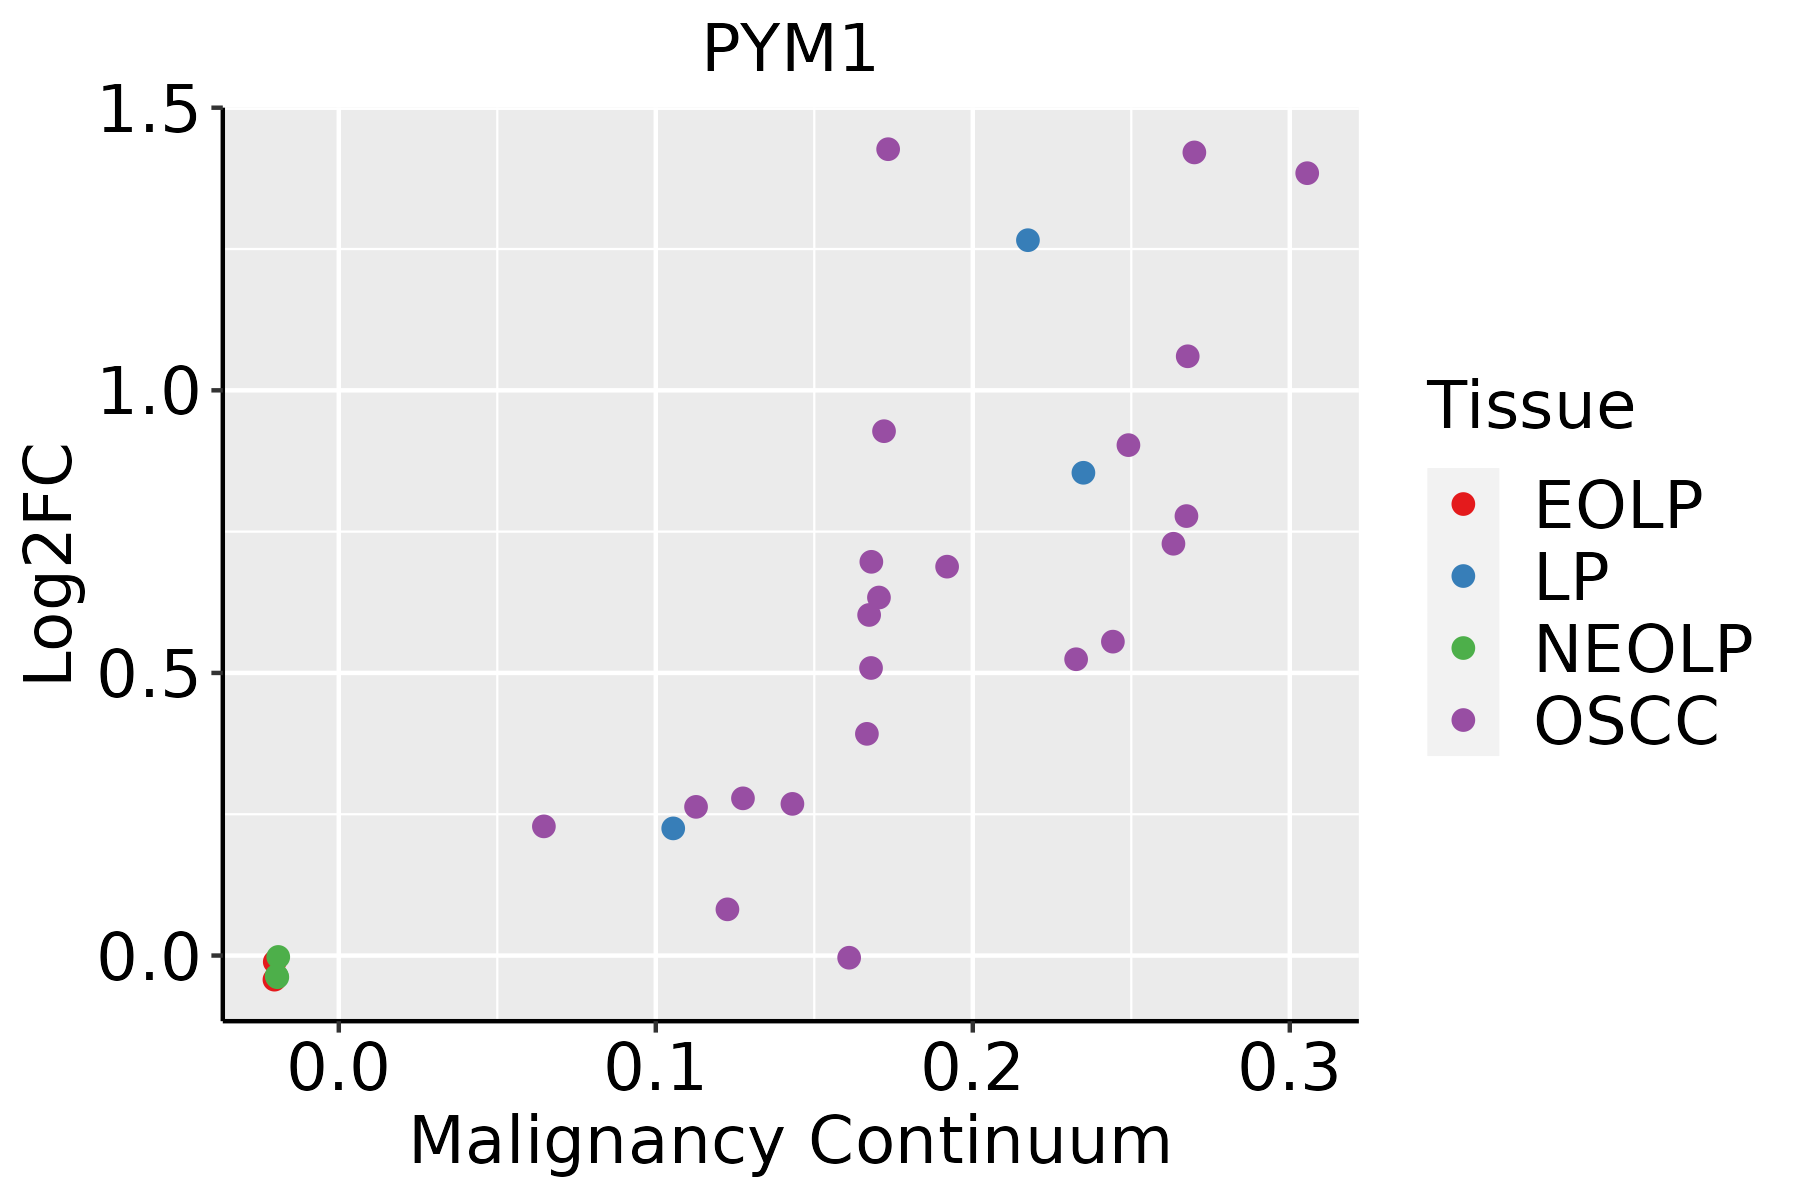 | EOLP: Erosive Oral lichen planus |
| LP: leukoplakia | ||
| NEOLP: Non-erosive oral lichen planus | ||
| OSCC: Oral squamous cell carcinoma | ||
| Prostate | 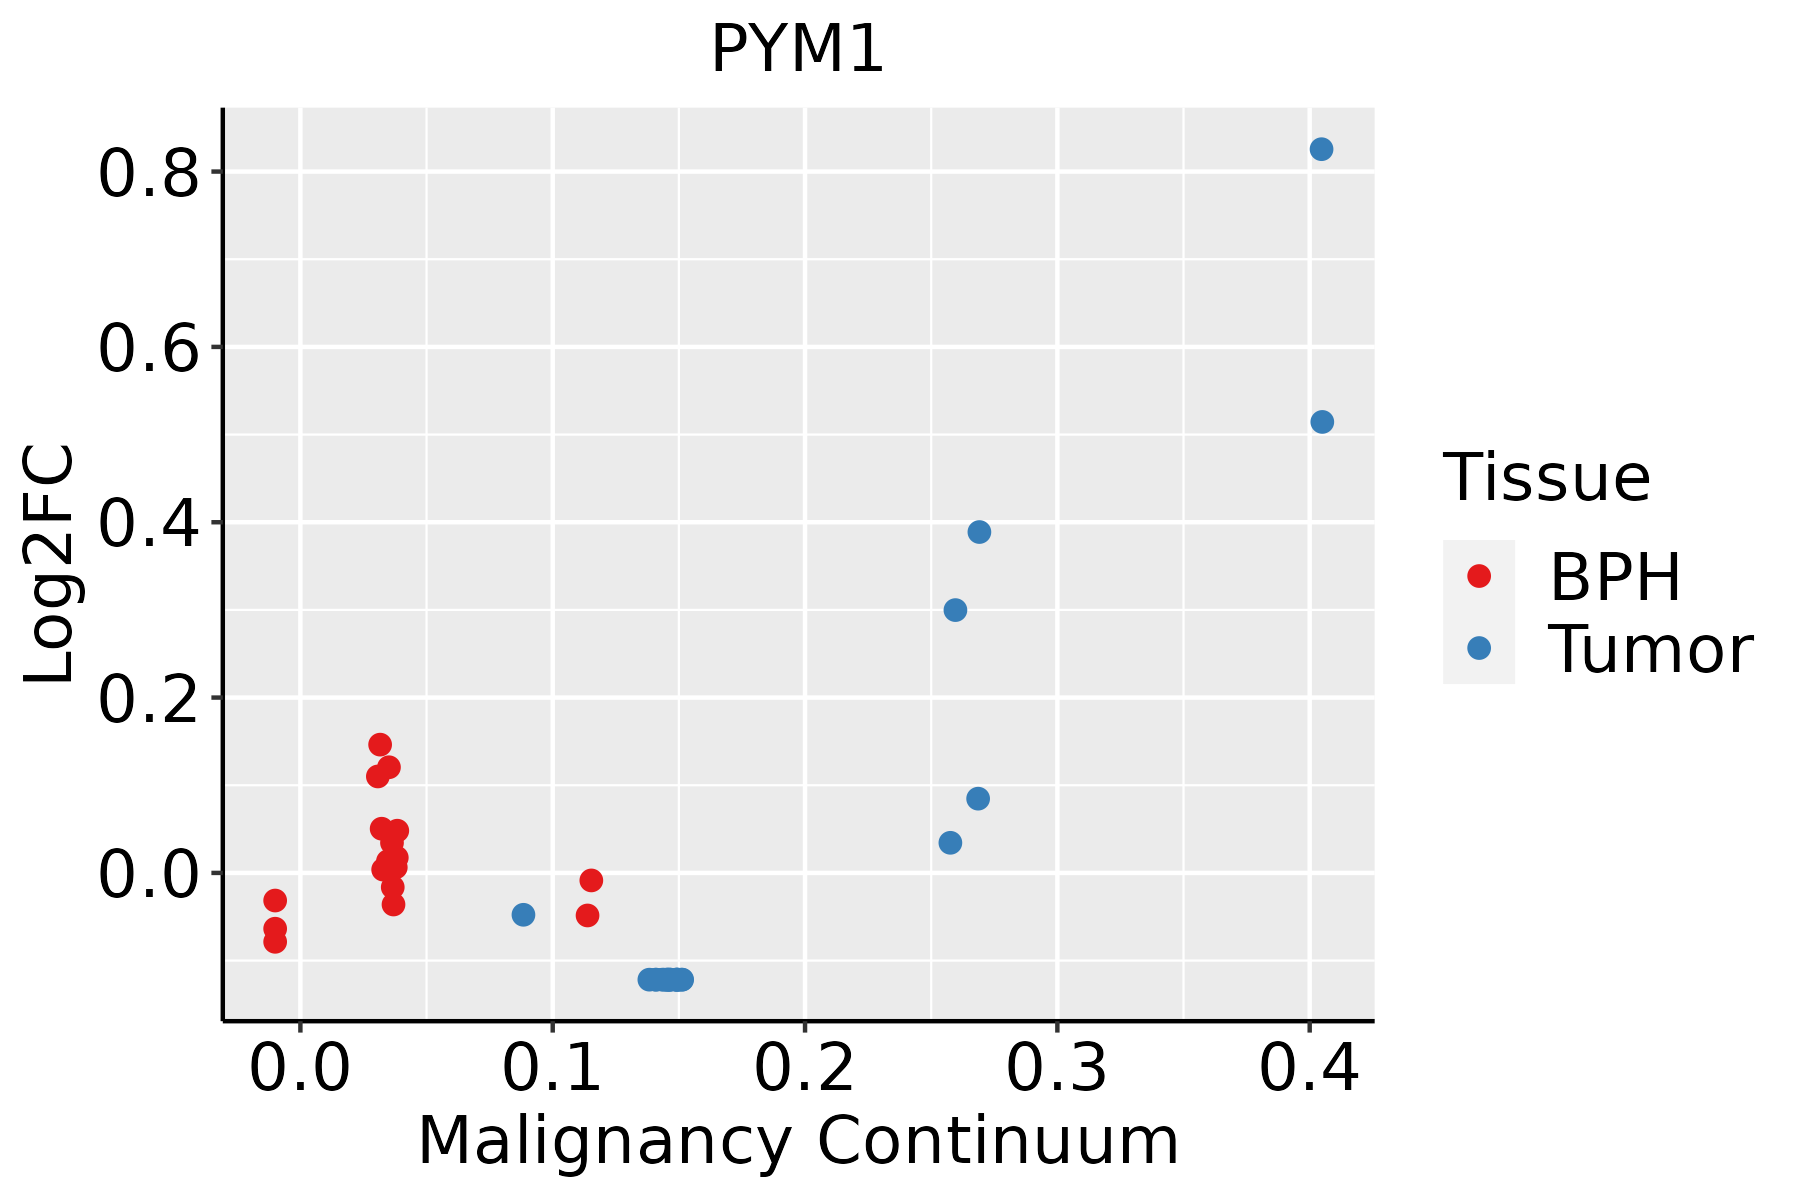 | BPH: Benign Prostatic Hyperplasia |
| ∗log2FC in expression of this searched gene in stem-like cells from each diseased tissue sample relative to stem-like cells in normal samples in each tissue plotted against the malignancy continuum. Samples are colored based on if they are from different disease stage. |
Top |
Malignant transformation related pathway analysis |
| Find out the enriched GO biological processes and KEGG pathways involved in transition from healthy to precancer to cancer |
| Tissue | Disease Stage | Enriched GO biological Processes |
| Colorectum | AD |  |
| Colorectum | SER |  |
| Colorectum | MSS |  |
| Colorectum | MSI-H |  |
| Colorectum | FAP |  |
| ∗Top 15 enriched GO BP terms are showed in the bar plot of each disease state in each tissue. Each row represents a significant GO biological process which is colored according to the -log10(p.adjust). |
| Page: 1 2 3 4 5 6 7 8 9 |
| GO ID | Tissue | Disease Stage | Description | Gene Ratio | Bg Ratio | pvalue | p.adjust | Count |
| GO:000641727 | Esophagus | HGIN | regulation of translation | 139/2587 | 468/18723 | 1.46e-19 | 7.98e-17 | 139 |
| GO:004572720 | Esophagus | HGIN | positive regulation of translation | 49/2587 | 136/18723 | 5.88e-11 | 6.30e-09 | 49 |
| GO:003425020 | Esophagus | HGIN | positive regulation of cellular amide metabolic process | 53/2587 | 162/18723 | 6.01e-10 | 5.15e-08 | 53 |
| GO:000640120 | Esophagus | HGIN | RNA catabolic process | 77/2587 | 278/18723 | 7.63e-10 | 6.36e-08 | 77 |
| GO:000640220 | Esophagus | HGIN | mRNA catabolic process | 67/2587 | 232/18723 | 1.47e-09 | 1.13e-07 | 67 |
| GO:000095617 | Esophagus | HGIN | nuclear-transcribed mRNA catabolic process | 40/2587 | 112/18723 | 4.44e-09 | 3.03e-07 | 40 |
| GO:003465519 | Esophagus | HGIN | nucleobase-containing compound catabolic process | 98/2587 | 407/18723 | 1.44e-08 | 8.94e-07 | 98 |
| GO:004670017 | Esophagus | HGIN | heterocycle catabolic process | 103/2587 | 445/18723 | 5.44e-08 | 2.99e-06 | 103 |
| GO:002241120 | Esophagus | HGIN | cellular component disassembly | 102/2587 | 443/18723 | 8.31e-08 | 4.33e-06 | 102 |
| GO:004427018 | Esophagus | HGIN | cellular nitrogen compound catabolic process | 103/2587 | 451/18723 | 1.10e-07 | 5.56e-06 | 103 |
| GO:001943917 | Esophagus | HGIN | aromatic compound catabolic process | 105/2587 | 467/18723 | 1.89e-07 | 9.31e-06 | 105 |
| GO:190136117 | Esophagus | HGIN | organic cyclic compound catabolic process | 106/2587 | 495/18723 | 1.94e-06 | 7.13e-05 | 106 |
| GO:00001846 | Esophagus | HGIN | nuclear-transcribed mRNA catabolic process, nonsense-mediated decay | 15/2587 | 37/18723 | 5.66e-05 | 1.33e-03 | 15 |
| GO:003298415 | Esophagus | HGIN | protein-containing complex disassembly | 50/2587 | 224/18723 | 3.43e-04 | 5.56e-03 | 50 |
| GO:0022411111 | Esophagus | ESCC | cellular component disassembly | 305/8552 | 443/18723 | 1.94e-23 | 4.57e-21 | 305 |
| GO:0006401110 | Esophagus | ESCC | RNA catabolic process | 204/8552 | 278/18723 | 3.39e-21 | 5.66e-19 | 204 |
| GO:0034655110 | Esophagus | ESCC | nucleobase-containing compound catabolic process | 272/8552 | 407/18723 | 2.92e-18 | 2.90e-16 | 272 |
| GO:0006402110 | Esophagus | ESCC | mRNA catabolic process | 170/8552 | 232/18723 | 8.70e-18 | 8.00e-16 | 170 |
| GO:0006417111 | Esophagus | ESCC | regulation of translation | 304/8552 | 468/18723 | 1.53e-17 | 1.33e-15 | 304 |
| GO:004670018 | Esophagus | ESCC | heterocycle catabolic process | 286/8552 | 445/18723 | 1.12e-15 | 7.47e-14 | 286 |
| Page: 1 2 3 4 5 6 |
| Pathway ID | Tissue | Disease Stage | Description | Gene Ratio | Bg Ratio | pvalue | p.adjust | qvalue | Count |
| hsa030159 | Esophagus | HGIN | mRNA surveillance pathway | 30/1383 | 97/8465 | 2.48e-04 | 2.69e-03 | 2.14e-03 | 30 |
| hsa030137 | Esophagus | HGIN | Nucleocytoplasmic transport | 31/1383 | 108/8465 | 8.29e-04 | 7.95e-03 | 6.31e-03 | 31 |
| hsa0301514 | Esophagus | HGIN | mRNA surveillance pathway | 30/1383 | 97/8465 | 2.48e-04 | 2.69e-03 | 2.14e-03 | 30 |
| hsa0301312 | Esophagus | HGIN | Nucleocytoplasmic transport | 31/1383 | 108/8465 | 8.29e-04 | 7.95e-03 | 6.31e-03 | 31 |
| hsa0301321 | Esophagus | ESCC | Nucleocytoplasmic transport | 89/4205 | 108/8465 | 1.20e-12 | 2.37e-11 | 1.21e-11 | 89 |
| hsa0301524 | Esophagus | ESCC | mRNA surveillance pathway | 72/4205 | 97/8465 | 6.12e-07 | 4.10e-06 | 2.10e-06 | 72 |
| hsa0301331 | Esophagus | ESCC | Nucleocytoplasmic transport | 89/4205 | 108/8465 | 1.20e-12 | 2.37e-11 | 1.21e-11 | 89 |
| hsa0301534 | Esophagus | ESCC | mRNA surveillance pathway | 72/4205 | 97/8465 | 6.12e-07 | 4.10e-06 | 2.10e-06 | 72 |
| hsa03013 | Liver | HCC | Nucleocytoplasmic transport | 81/4020 | 108/8465 | 4.28e-09 | 6.83e-08 | 3.80e-08 | 81 |
| hsa0301521 | Liver | HCC | mRNA surveillance pathway | 66/4020 | 97/8465 | 3.16e-05 | 1.88e-04 | 1.04e-04 | 66 |
| hsa030131 | Liver | HCC | Nucleocytoplasmic transport | 81/4020 | 108/8465 | 4.28e-09 | 6.83e-08 | 3.80e-08 | 81 |
| hsa0301531 | Liver | HCC | mRNA surveillance pathway | 66/4020 | 97/8465 | 3.16e-05 | 1.88e-04 | 1.04e-04 | 66 |
| hsa030136 | Oral cavity | OSCC | Nucleocytoplasmic transport | 82/3704 | 108/8465 | 7.93e-12 | 1.33e-10 | 6.77e-11 | 82 |
| hsa030158 | Oral cavity | OSCC | mRNA surveillance pathway | 75/3704 | 97/8465 | 1.30e-11 | 2.01e-10 | 1.02e-10 | 75 |
| hsa0301311 | Oral cavity | OSCC | Nucleocytoplasmic transport | 82/3704 | 108/8465 | 7.93e-12 | 1.33e-10 | 6.77e-11 | 82 |
| hsa0301513 | Oral cavity | OSCC | mRNA surveillance pathway | 75/3704 | 97/8465 | 1.30e-11 | 2.01e-10 | 1.02e-10 | 75 |
| hsa0301523 | Oral cavity | LP | mRNA surveillance pathway | 50/2418 | 97/8465 | 1.39e-06 | 1.50e-05 | 9.66e-06 | 50 |
| hsa030132 | Oral cavity | LP | Nucleocytoplasmic transport | 53/2418 | 108/8465 | 4.68e-06 | 4.10e-05 | 2.64e-05 | 53 |
| hsa0301533 | Oral cavity | LP | mRNA surveillance pathway | 50/2418 | 97/8465 | 1.39e-06 | 1.50e-05 | 9.66e-06 | 50 |
| hsa030133 | Oral cavity | LP | Nucleocytoplasmic transport | 53/2418 | 108/8465 | 4.68e-06 | 4.10e-05 | 2.64e-05 | 53 |
| Page: 1 2 |
Top |
Cell-cell communication analysis |
| Identification of potential cell-cell interactions between two cell types and their ligand-receptor pairs for different disease states |
| Ligand | Receptor | LRpair | Pathway | Tissue | Disease Stage |
| Page: 1 |
Top |
Single-cell gene regulatory network inference analysis |
| Find out the significant the regulons (TFs) and the target genes of each regulon across cell types for different disease states |
| TF | Cell Type | Tissue | Disease Stage | Target Gene | RSS | Regulon Activity |
| ∗The dot plots of a searched regulon are shown for all cell subpopulations in each disease state of each tissue based on the regulon specific score inferred using pySCENIC and by calculating the average expression. |
| Page: 1 |
Top |
Somatic mutation of malignant transformation related genes |
| Annotation of somatic variants for genes involved in malignant transformation |
| Hugo Symbol | Variant Class | Variant Classification | dbSNP RS | HGVSc | HGVSp | HGVSp Short | SWISSPROT | BIOTYPE | SIFT | PolyPhen | Tumor Sample Barcode | Tissue | Histology | Sex | Age | Stage | Therapy Types | Drugs | Outcome |
| PYM1 | insertion | Nonsense_Mutation | novel | c.279_280insGAGTTCTTAGCCTGACTCATAAGCTCACATATAATCTGGCCCT | p.Lys94GlufsTer5 | p.K94Efs*5 | Q9BRP8 | protein_coding | TCGA-AO-A03O-01 | Breast | breast invasive carcinoma | Female | >=65 | I/II | Chemotherapy | doxorubicin | SD | ||
| PYM1 | SNV | Missense_Mutation | novel | c.358N>C | p.Glu120Gln | p.E120Q | Q9BRP8 | protein_coding | tolerated(0.36) | benign(0.174) | TCGA-ZJ-AAXU-01 | Cervix | cervical & endocervical cancer | Female | <65 | I/II | Unknown | Unknown | SD |
| PYM1 | SNV | Missense_Mutation | c.41A>G | p.Lys14Arg | p.K14R | Q9BRP8 | protein_coding | tolerated(0.08) | probably_damaging(0.998) | TCGA-AA-3494-01 | Colorectum | colon adenocarcinoma | Male | <65 | III/IV | Chemotherapy | folinic | PR | |
| PYM1 | SNV | Missense_Mutation | novel | c.74C>A | p.Thr25Asn | p.T25N | Q9BRP8 | protein_coding | deleterious(0) | probably_damaging(0.93) | TCGA-AA-A02R-01 | Colorectum | colon adenocarcinoma | Female | >=65 | I/II | Unknown | Unknown | PD |
| PYM1 | SNV | Missense_Mutation | novel | c.386N>G | p.Gln129Arg | p.Q129R | Q9BRP8 | protein_coding | tolerated(0.28) | benign(0) | TCGA-G4-6304-01 | Colorectum | colon adenocarcinoma | Female | >=65 | I/II | Chemotherapy | fluorouracil | PD |
| PYM1 | SNV | Missense_Mutation | novel | c.436N>A | p.Ala146Thr | p.A146T | Q9BRP8 | protein_coding | deleterious(0.04) | benign(0.051) | TCGA-WS-AB45-01 | Colorectum | colon adenocarcinoma | Female | <65 | I/II | Unknown | Unknown | SD |
| PYM1 | SNV | Missense_Mutation | rs767819119 | c.266N>A | p.Arg89His | p.R89H | Q9BRP8 | protein_coding | deleterious(0.03) | benign(0.003) | TCGA-AG-A002-01 | Colorectum | rectum adenocarcinoma | Male | <65 | I/II | Unknown | Unknown | SD |
| PYM1 | SNV | Missense_Mutation | novel | c.146A>G | p.Tyr49Cys | p.Y49C | Q9BRP8 | protein_coding | deleterious(0.02) | probably_damaging(0.972) | TCGA-A5-A0G2-01 | Endometrium | uterine corpus endometrioid carcinoma | Female | <65 | III/IV | Unknown | Unknown | SD |
| PYM1 | SNV | Missense_Mutation | c.89N>A | p.Arg30Gln | p.R30Q | Q9BRP8 | protein_coding | deleterious(0.01) | probably_damaging(0.998) | TCGA-AP-A0LT-01 | Endometrium | uterine corpus endometrioid carcinoma | Female | <65 | I/II | Unknown | Unknown | SD | |
| PYM1 | SNV | Missense_Mutation | rs773714243 | c.49N>A | p.Ala17Thr | p.A17T | Q9BRP8 | protein_coding | deleterious(0.03) | probably_damaging(0.999) | TCGA-AX-A1C5-01 | Endometrium | uterine corpus endometrioid carcinoma | Female | <65 | III/IV | Unspecific | Carboplatin | SD |
| Page: 1 2 |
Top |
Related drugs of malignant transformation related genes |
| Identification of chemicals and drugs interact with genes involved in malignant transfromation |
| (DGIdb 4.0) |
| Entrez ID | Symbol | Category | Interaction Types | Drug Claim Name | Drug Name | PMIDs |
| Page: 1 |

Copyright 2023-Present -The University of Texas Health Science Center at Houston |