
|
|||||
|
 | |
| |
| |
| |
| |
| |
|
Gene: PYGO2 |
Gene summary for PYGO2 |
| Gene information | Species | Human | Gene symbol | PYGO2 | Gene ID | 90780 |
| Gene name | pygopus family PHD finger 2 | |
| Gene Alias | 1190004M21Rik | |
| Cytomap | 1q21.3 | |
| Gene Type | protein-coding | GO ID | GO:0000003 | UniProtAcc | Q5T170 |
Top |
Malignant transformation analysis |
| Identification of the aberrant gene expression in precancerous and cancerous lesions by comparing the gene expression of stem-like cells in diseased tissues with normal stem cells |
| Entrez ID | Symbol | Replicates | Species | Organ | Tissue | Adj P-value | Log2FC | Malignancy |
| 90780 | PYGO2 | LZE4T | Human | Esophagus | ESCC | 4.36e-07 | 1.38e-01 | 0.0811 |
| 90780 | PYGO2 | LZE7T | Human | Esophagus | ESCC | 2.67e-13 | 3.16e-01 | 0.0667 |
| 90780 | PYGO2 | LZE20T | Human | Esophagus | ESCC | 8.72e-07 | 1.19e-01 | 0.0662 |
| 90780 | PYGO2 | LZE22T | Human | Esophagus | ESCC | 3.10e-05 | 4.06e-01 | 0.068 |
| 90780 | PYGO2 | LZE24T | Human | Esophagus | ESCC | 1.49e-13 | 3.44e-01 | 0.0596 |
| 90780 | PYGO2 | LZE21T | Human | Esophagus | ESCC | 1.50e-02 | 1.96e-01 | 0.0655 |
| 90780 | PYGO2 | P1T-E | Human | Esophagus | ESCC | 6.94e-05 | 2.06e-01 | 0.0875 |
| 90780 | PYGO2 | P2T-E | Human | Esophagus | ESCC | 9.74e-21 | 3.51e-01 | 0.1177 |
| 90780 | PYGO2 | P4T-E | Human | Esophagus | ESCC | 3.92e-14 | 2.93e-01 | 0.1323 |
| 90780 | PYGO2 | P5T-E | Human | Esophagus | ESCC | 4.40e-09 | 1.72e-01 | 0.1327 |
| 90780 | PYGO2 | P8T-E | Human | Esophagus | ESCC | 8.56e-12 | 1.76e-01 | 0.0889 |
| 90780 | PYGO2 | P9T-E | Human | Esophagus | ESCC | 7.16e-13 | 1.99e-01 | 0.1131 |
| 90780 | PYGO2 | P10T-E | Human | Esophagus | ESCC | 9.67e-18 | 2.84e-01 | 0.116 |
| 90780 | PYGO2 | P11T-E | Human | Esophagus | ESCC | 2.47e-14 | 4.06e-01 | 0.1426 |
| 90780 | PYGO2 | P12T-E | Human | Esophagus | ESCC | 1.11e-16 | 2.33e-01 | 0.1122 |
| 90780 | PYGO2 | P15T-E | Human | Esophagus | ESCC | 9.76e-24 | 4.41e-01 | 0.1149 |
| 90780 | PYGO2 | P16T-E | Human | Esophagus | ESCC | 4.24e-18 | 3.01e-01 | 0.1153 |
| 90780 | PYGO2 | P17T-E | Human | Esophagus | ESCC | 7.84e-11 | 2.80e-01 | 0.1278 |
| 90780 | PYGO2 | P19T-E | Human | Esophagus | ESCC | 1.33e-03 | 4.00e-01 | 0.1662 |
| 90780 | PYGO2 | P20T-E | Human | Esophagus | ESCC | 7.37e-15 | 2.56e-01 | 0.1124 |
| Page: 1 2 3 4 |
| Tissue | Expression Dynamics | Abbreviation |
| Esophagus |  | ESCC: Esophageal squamous cell carcinoma |
| HGIN: High-grade intraepithelial neoplasias | ||
| LGIN: Low-grade intraepithelial neoplasias | ||
| Liver | 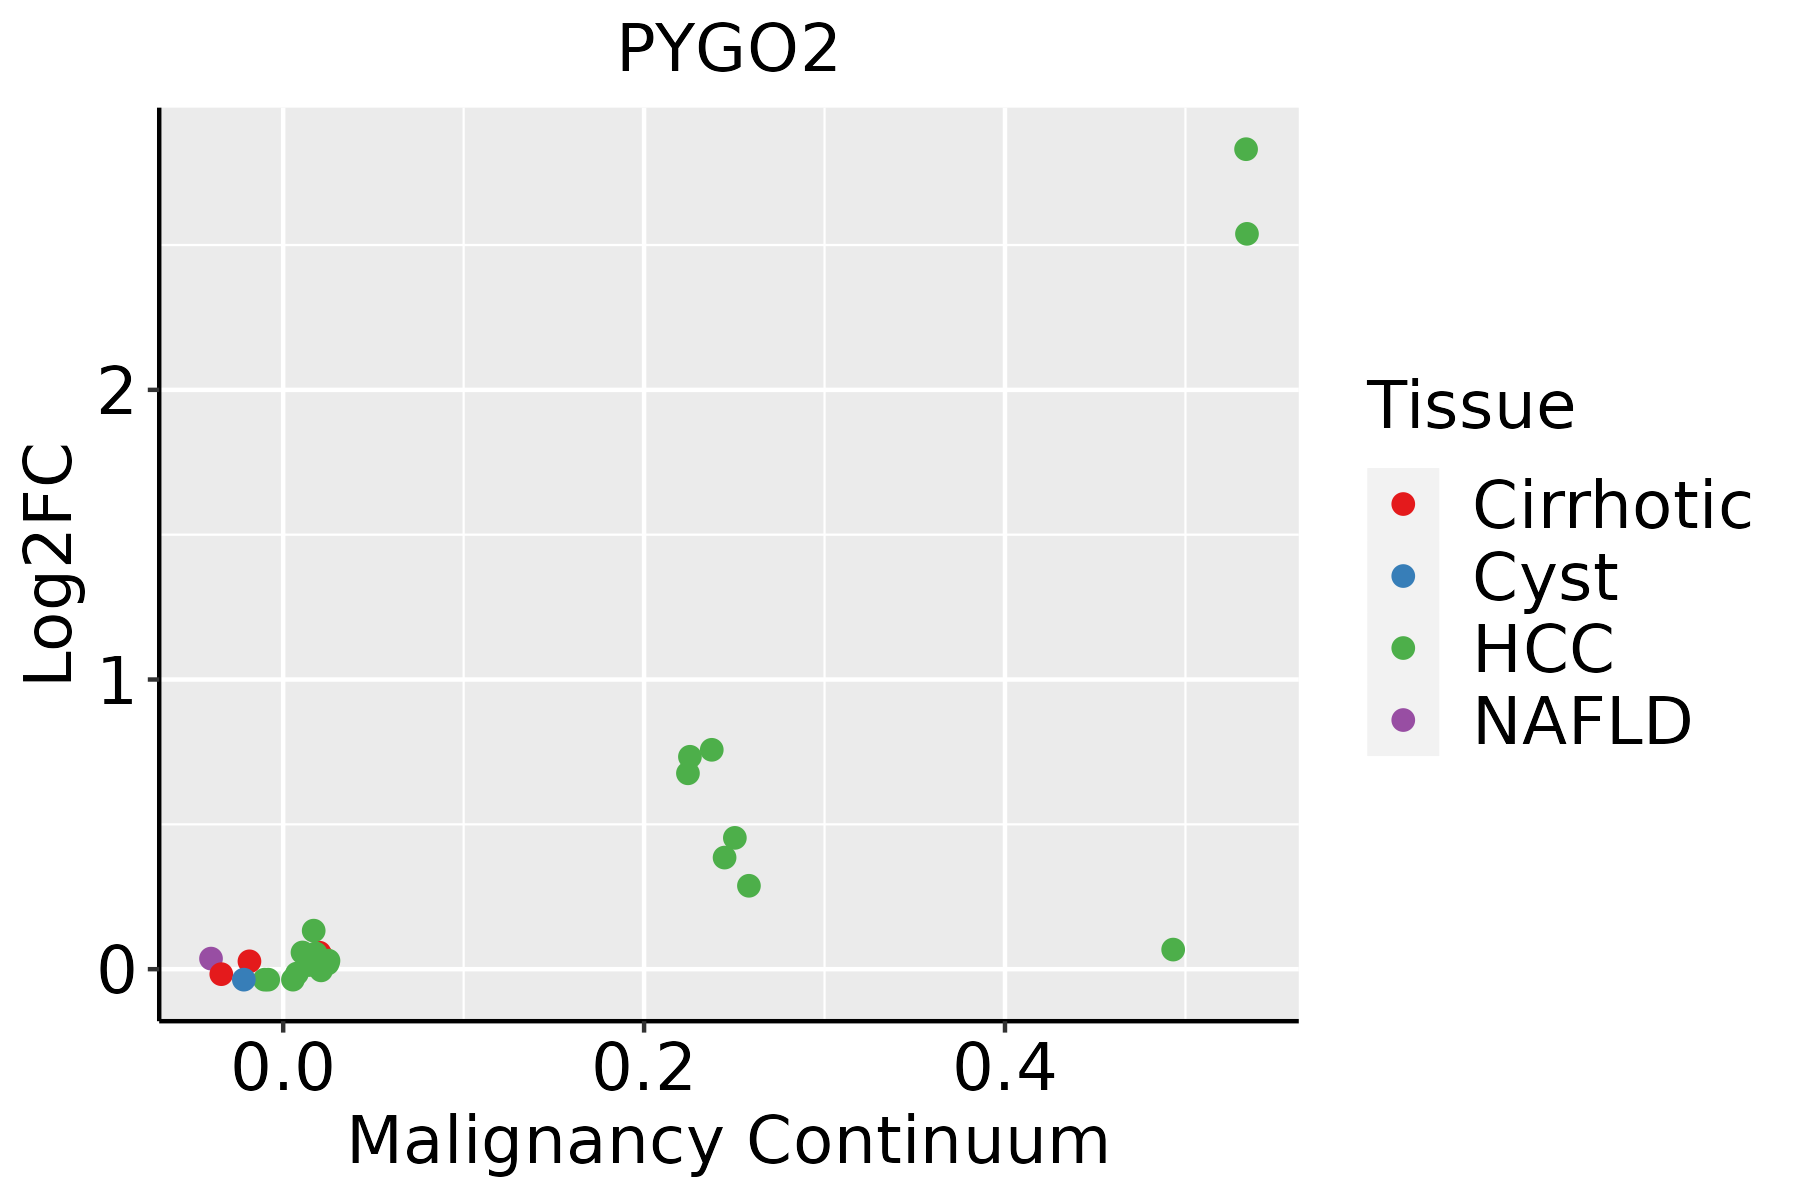 | HCC: Hepatocellular carcinoma |
| NAFLD: Non-alcoholic fatty liver disease |
| ∗log2FC in expression of this searched gene in stem-like cells from each diseased tissue sample relative to stem-like cells in normal samples in each tissue plotted against the malignancy continuum. Samples are colored based on if they are from different disease stage. |
Top |
Malignant transformation related pathway analysis |
| Find out the enriched GO biological processes and KEGG pathways involved in transition from healthy to precancer to cancer |
| Tissue | Disease Stage | Enriched GO biological Processes |
| Colorectum | AD |  |
| Colorectum | SER |  |
| Colorectum | MSS |  |
| Colorectum | MSI-H |  |
| Colorectum | FAP |  |
| ∗Top 15 enriched GO BP terms are showed in the bar plot of each disease state in each tissue. Each row represents a significant GO biological process which is colored according to the -log10(p.adjust). |
| Page: 1 2 3 4 5 6 7 8 9 |
| GO ID | Tissue | Disease Stage | Description | Gene Ratio | Bg Ratio | pvalue | p.adjust | Count |
| GO:001657015 | Esophagus | ESCC | histone modification | 323/8552 | 463/18723 | 2.61e-26 | 7.88e-24 | 323 |
| GO:001820514 | Esophagus | ESCC | peptidyl-lysine modification | 259/8552 | 376/18723 | 3.90e-20 | 5.26e-18 | 259 |
| GO:0051098111 | Esophagus | ESCC | regulation of binding | 251/8552 | 363/18723 | 6.73e-20 | 8.46e-18 | 251 |
| GO:001839413 | Esophagus | ESCC | peptidyl-lysine acetylation | 123/8552 | 169/18723 | 6.58e-13 | 2.94e-11 | 123 |
| GO:004354313 | Esophagus | ESCC | protein acylation | 165/8552 | 243/18723 | 1.69e-12 | 7.14e-11 | 165 |
| GO:000647313 | Esophagus | ESCC | protein acetylation | 140/8552 | 201/18723 | 4.37e-12 | 1.69e-10 | 140 |
| GO:0048732111 | Esophagus | ESCC | gland development | 269/8552 | 436/18723 | 7.81e-12 | 2.95e-10 | 269 |
| GO:001839313 | Esophagus | ESCC | internal peptidyl-lysine acetylation | 114/8552 | 158/18723 | 1.16e-11 | 4.24e-10 | 114 |
| GO:000647513 | Esophagus | ESCC | internal protein amino acid acetylation | 115/8552 | 160/18723 | 1.43e-11 | 5.08e-10 | 115 |
| GO:00165735 | Esophagus | ESCC | histone acetylation | 110/8552 | 152/18723 | 1.95e-11 | 6.81e-10 | 110 |
| GO:0051099111 | Esophagus | ESCC | positive regulation of binding | 122/8552 | 173/18723 | 2.79e-11 | 9.45e-10 | 122 |
| GO:001605517 | Esophagus | ESCC | Wnt signaling pathway | 268/8552 | 444/18723 | 2.32e-10 | 6.58e-09 | 268 |
| GO:019873817 | Esophagus | ESCC | cell-cell signaling by wnt | 269/8552 | 446/18723 | 2.41e-10 | 6.79e-09 | 269 |
| GO:00434143 | Esophagus | ESCC | macromolecule methylation | 199/8552 | 316/18723 | 3.44e-10 | 9.57e-09 | 199 |
| GO:000699713 | Esophagus | ESCC | nucleus organization | 96/8552 | 133/18723 | 4.66e-10 | 1.21e-08 | 96 |
| GO:003105614 | Esophagus | ESCC | regulation of histone modification | 106/8552 | 152/18723 | 1.52e-09 | 3.55e-08 | 106 |
| GO:00322592 | Esophagus | ESCC | methylation | 222/8552 | 364/18723 | 2.26e-09 | 5.09e-08 | 222 |
| GO:000647914 | Esophagus | ESCC | protein methylation | 115/8552 | 181/18723 | 9.07e-07 | 1.16e-05 | 115 |
| GO:000821314 | Esophagus | ESCC | protein alkylation | 115/8552 | 181/18723 | 9.07e-07 | 1.16e-05 | 115 |
| GO:006007016 | Esophagus | ESCC | canonical Wnt signaling pathway | 180/8552 | 303/18723 | 9.15e-07 | 1.17e-05 | 180 |
| Page: 1 2 3 4 |
| Pathway ID | Tissue | Disease Stage | Description | Gene Ratio | Bg Ratio | pvalue | p.adjust | qvalue | Count |
| Page: 1 |
Top |
Cell-cell communication analysis |
| Identification of potential cell-cell interactions between two cell types and their ligand-receptor pairs for different disease states |
| Ligand | Receptor | LRpair | Pathway | Tissue | Disease Stage |
| Page: 1 |
Top |
Single-cell gene regulatory network inference analysis |
| Find out the significant the regulons (TFs) and the target genes of each regulon across cell types for different disease states |
| TF | Cell Type | Tissue | Disease Stage | Target Gene | RSS | Regulon Activity |
| ∗The dot plots of a searched regulon are shown for all cell subpopulations in each disease state of each tissue based on the regulon specific score inferred using pySCENIC and by calculating the average expression. |
| Page: 1 |
Top |
Somatic mutation of malignant transformation related genes |
| Annotation of somatic variants for genes involved in malignant transformation |
| Hugo Symbol | Variant Class | Variant Classification | dbSNP RS | HGVSc | HGVSp | HGVSp Short | SWISSPROT | BIOTYPE | SIFT | PolyPhen | Tumor Sample Barcode | Tissue | Histology | Sex | Age | Stage | Therapy Types | Drugs | Outcome |
| PYGO2 | SNV | Missense_Mutation | c.1093N>A | p.Ala365Thr | p.A365T | Q9BRQ0 | protein_coding | deleterious(0) | probably_damaging(0.99) | TCGA-AN-A0AR-01 | Breast | breast invasive carcinoma | Female | <65 | I/II | Unknown | Unknown | SD | |
| PYGO2 | SNV | Missense_Mutation | c.488C>T | p.Pro163Leu | p.P163L | Q9BRQ0 | protein_coding | tolerated(0.09) | benign(0.003) | TCGA-BH-A18G-01 | Breast | breast invasive carcinoma | Female | >=65 | I/II | Unknown | Unknown | SD | |
| PYGO2 | SNV | Missense_Mutation | novel | c.902G>A | p.Gly301Asp | p.G301D | Q9BRQ0 | protein_coding | deleterious(0.02) | benign(0.044) | TCGA-2W-A8YY-01 | Cervix | cervical & endocervical cancer | Female | <65 | I/II | Chemotherapy | cisplatin | CR |
| PYGO2 | SNV | Missense_Mutation | c.1093G>A | p.Ala365Thr | p.A365T | Q9BRQ0 | protein_coding | deleterious(0) | probably_damaging(0.99) | TCGA-AA-3495-01 | Colorectum | colon adenocarcinoma | Male | >=65 | I/II | Unknown | Unknown | SD | |
| PYGO2 | SNV | Missense_Mutation | rs757615029 | c.892C>T | p.Arg298Trp | p.R298W | Q9BRQ0 | protein_coding | deleterious(0.01) | possibly_damaging(0.539) | TCGA-AA-A00N-01 | Colorectum | colon adenocarcinoma | Male | >=65 | I/II | Unknown | Unknown | PD |
| PYGO2 | SNV | Missense_Mutation | rs760474730 | c.616N>A | p.Leu206Met | p.L206M | Q9BRQ0 | protein_coding | tolerated(0.45) | benign(0.006) | TCGA-AZ-6605-01 | Colorectum | colon adenocarcinoma | Male | >=65 | III/IV | Chemotherapy | folfox | SD |
| PYGO2 | SNV | Missense_Mutation | c.1201G>A | p.Val401Met | p.V401M | Q9BRQ0 | protein_coding | deleterious(0.01) | probably_damaging(0.964) | TCGA-CK-4951-01 | Colorectum | colon adenocarcinoma | Female | >=65 | I/II | Unknown | Unknown | PD | |
| PYGO2 | insertion | Frame_Shift_Ins | rs748504064 | c.448_449insC | p.Gln150ProfsTer27 | p.Q150Pfs*27 | Q9BRQ0 | protein_coding | TCGA-CK-6746-01 | Colorectum | colon adenocarcinoma | Female | >=65 | I/II | Unknown | Unknown | SD | ||
| PYGO2 | insertion | Frame_Shift_Ins | rs748504064 | c.448dupC | p.Gln150ProfsTer27 | p.Q150Pfs*27 | Q9BRQ0 | protein_coding | TCGA-WS-AB45-01 | Colorectum | colon adenocarcinoma | Female | <65 | I/II | Unknown | Unknown | SD | ||
| PYGO2 | SNV | Missense_Mutation | rs758189275 | c.955N>A | p.Gly319Arg | p.G319R | Q9BRQ0 | protein_coding | tolerated(0.27) | benign(0.082) | TCGA-A5-A2K3-01 | Endometrium | uterine corpus endometrioid carcinoma | Female | >=65 | I/II | Chemotherapy | carboplatin | SD |
| Page: 1 2 3 4 |
Top |
Related drugs of malignant transformation related genes |
| Identification of chemicals and drugs interact with genes involved in malignant transfromation |
| (DGIdb 4.0) |
| Entrez ID | Symbol | Category | Interaction Types | Drug Claim Name | Drug Name | PMIDs |
| Page: 1 |

Copyright 2023-Present -The University of Texas Health Science Center at Houston |