| Tissue | Expression Dynamics | Abbreviation |
| Colorectum (GSE201348) | 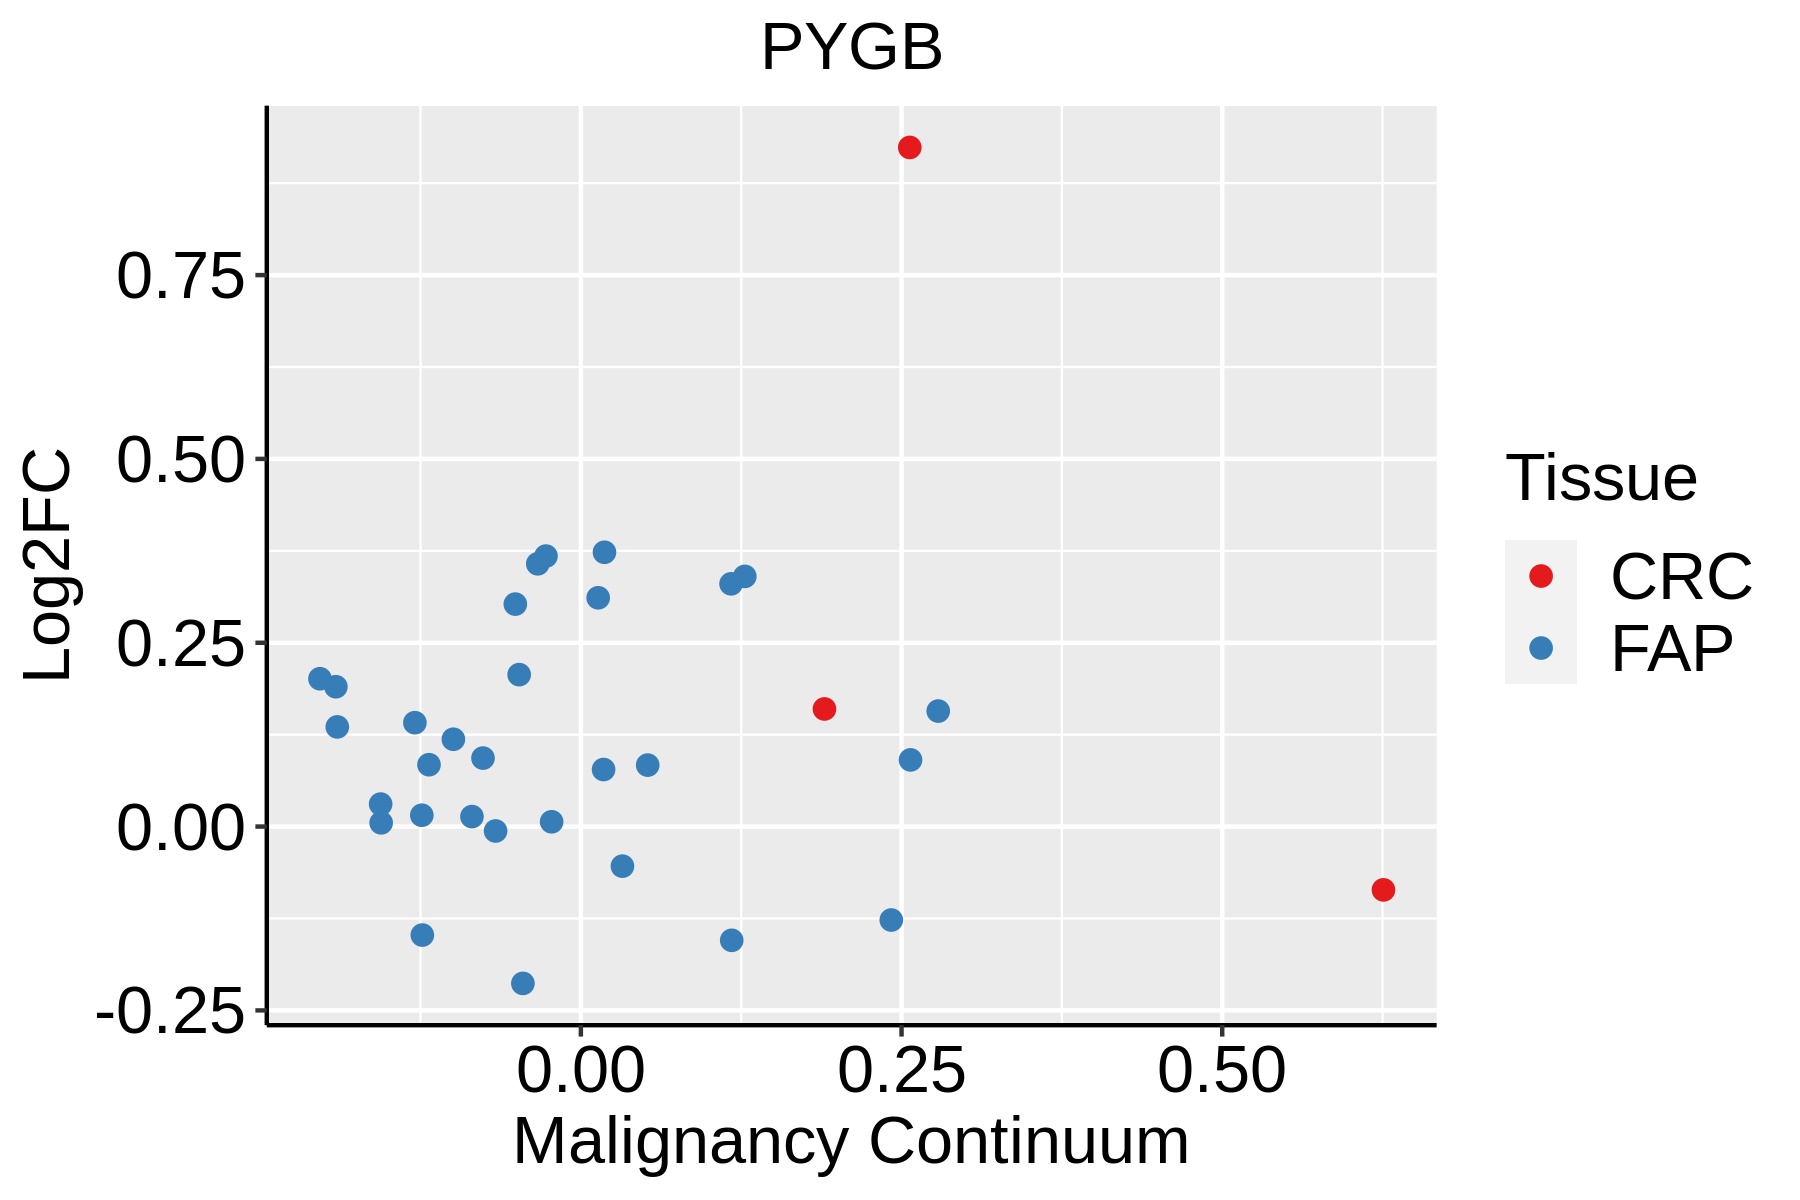 | FAP: Familial adenomatous polyposis |
| CRC: Colorectal cancer |
| Colorectum (HTA11) |  | AD: Adenomas |
| SER: Sessile serrated lesions |
| MSI-H: Microsatellite-high colorectal cancer |
| MSS: Microsatellite stable colorectal cancer |
| Esophagus | 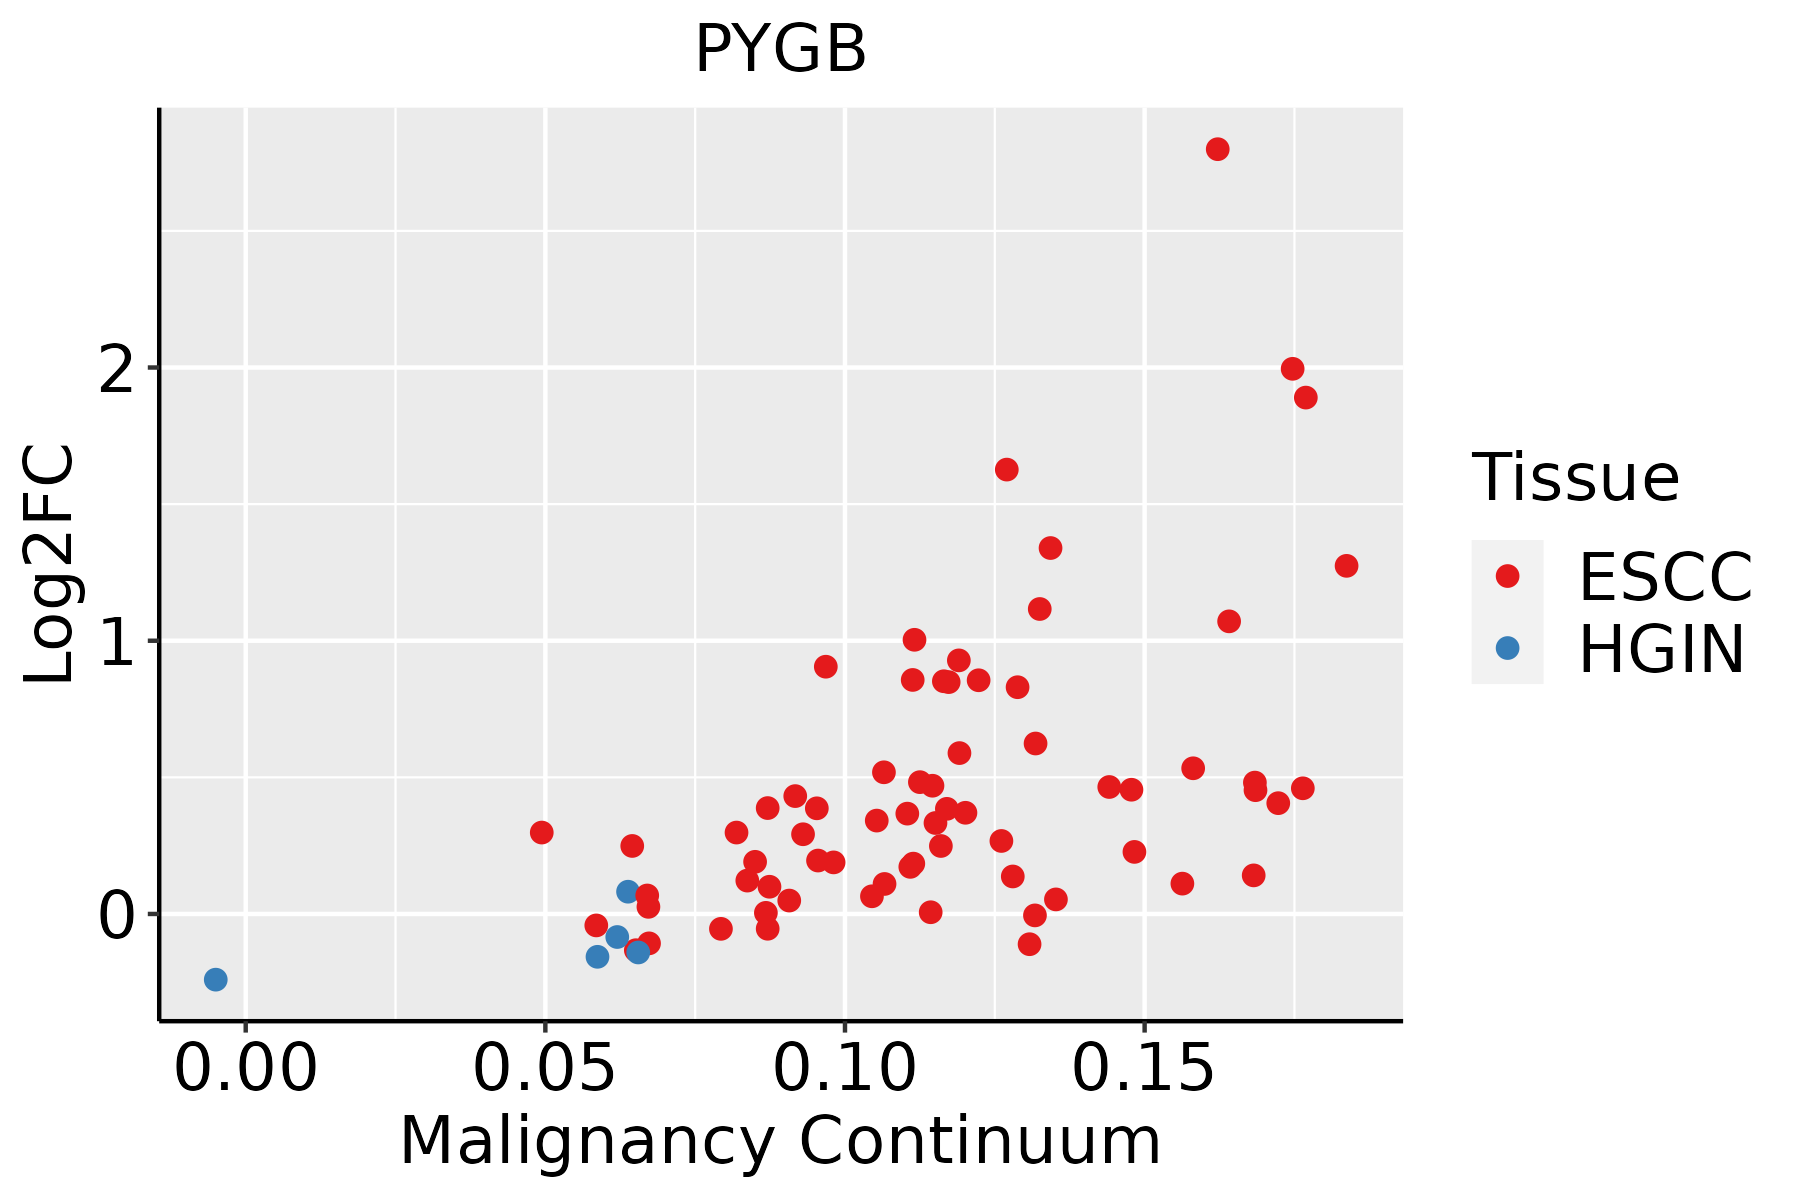 | ESCC: Esophageal squamous cell carcinoma |
| HGIN: High-grade intraepithelial neoplasias |
| LGIN: Low-grade intraepithelial neoplasias |
| Liver | 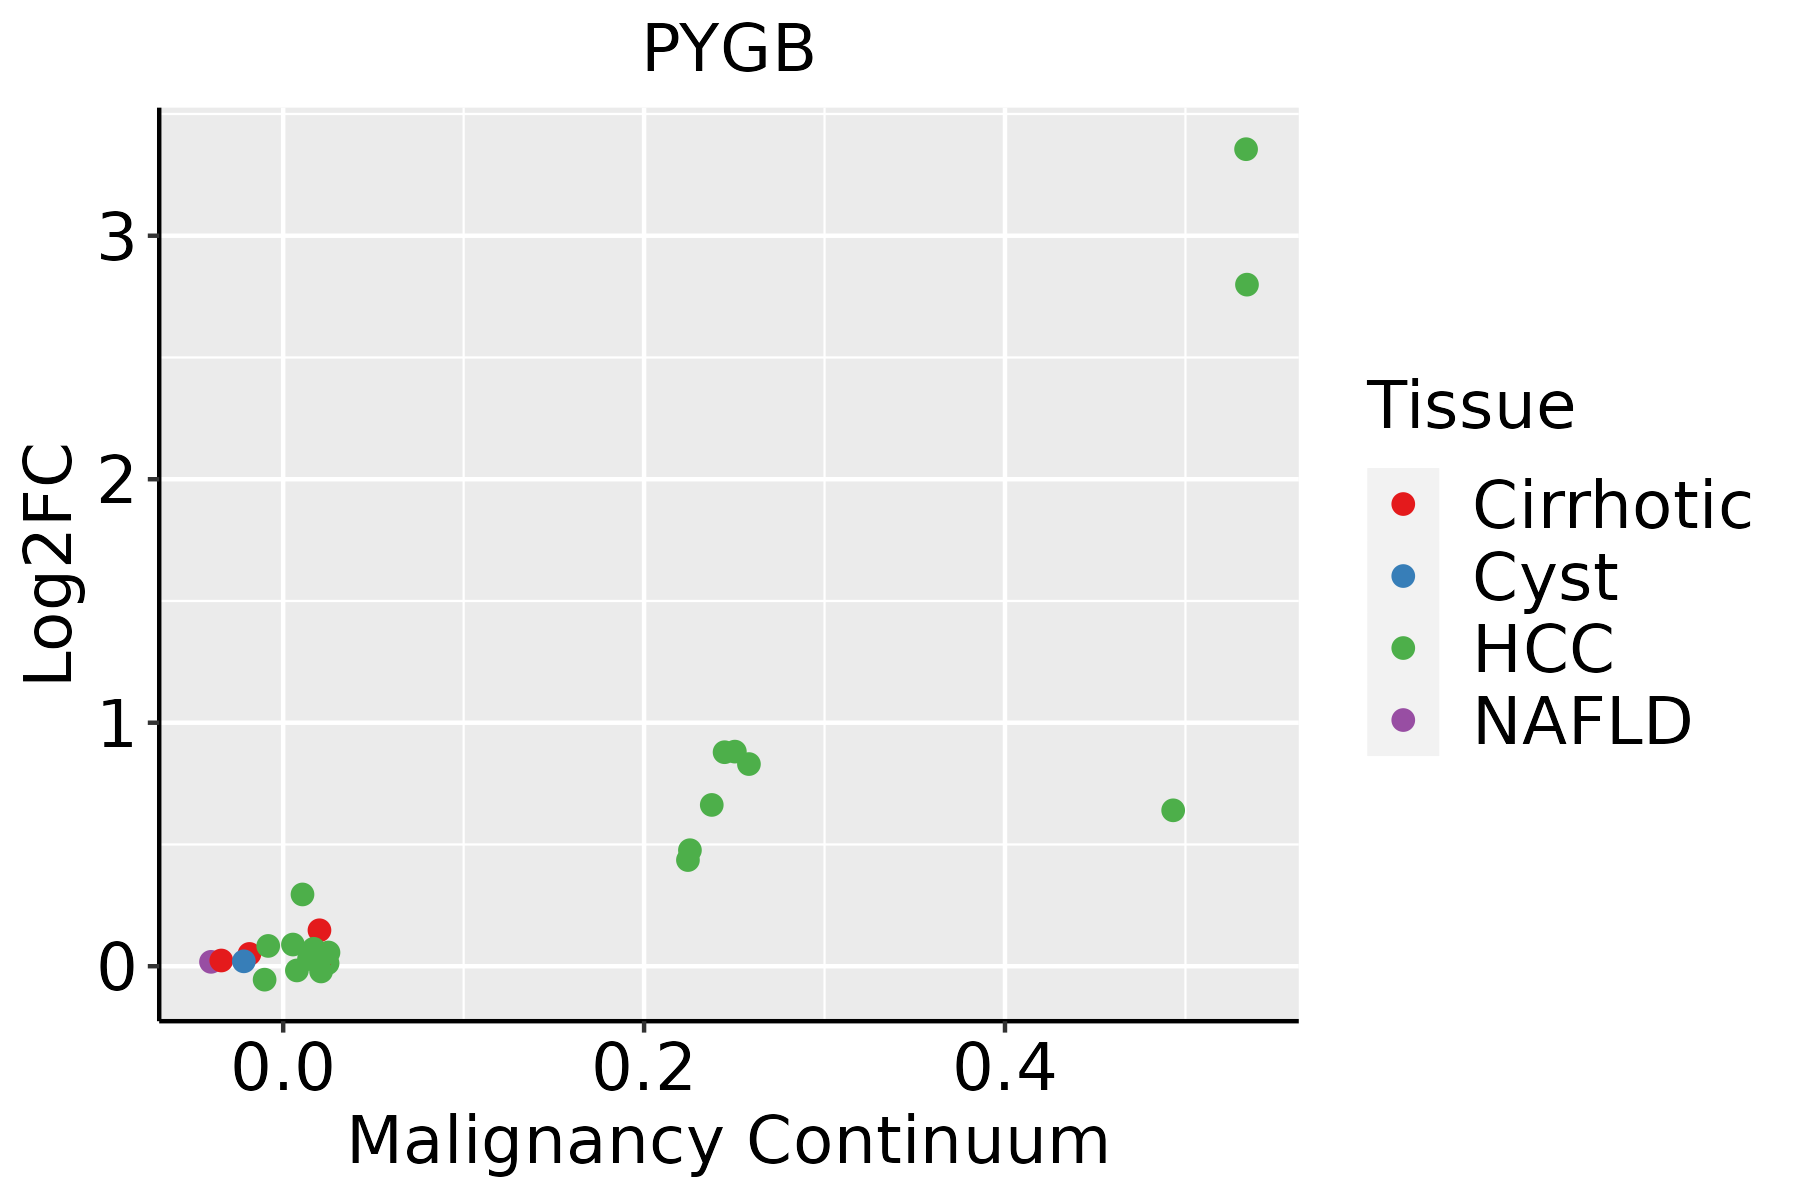 | HCC: Hepatocellular carcinoma |
| NAFLD: Non-alcoholic fatty liver disease |
| Oral Cavity | 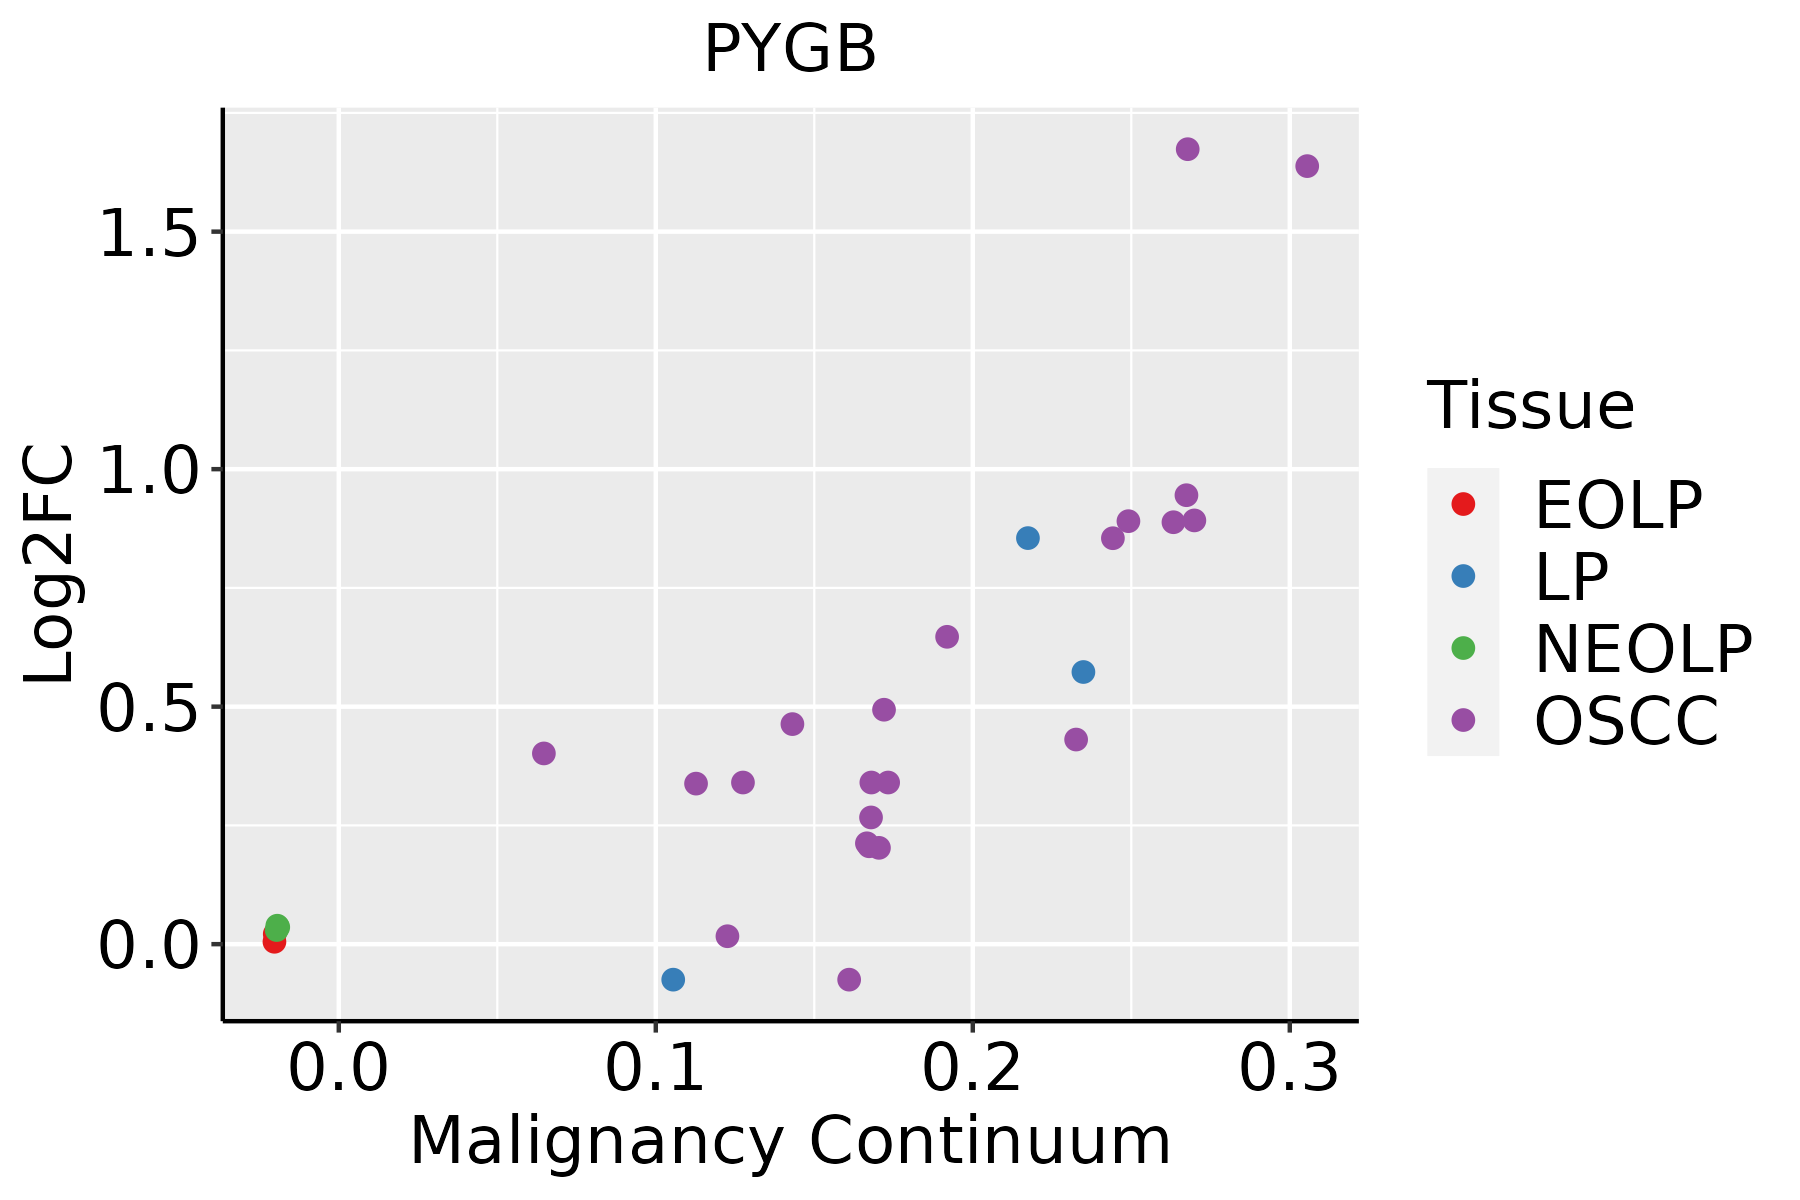 | EOLP: Erosive Oral lichen planus |
| LP: leukoplakia |
| NEOLP: Non-erosive oral lichen planus |
| OSCC: Oral squamous cell carcinoma |
| Prostate | 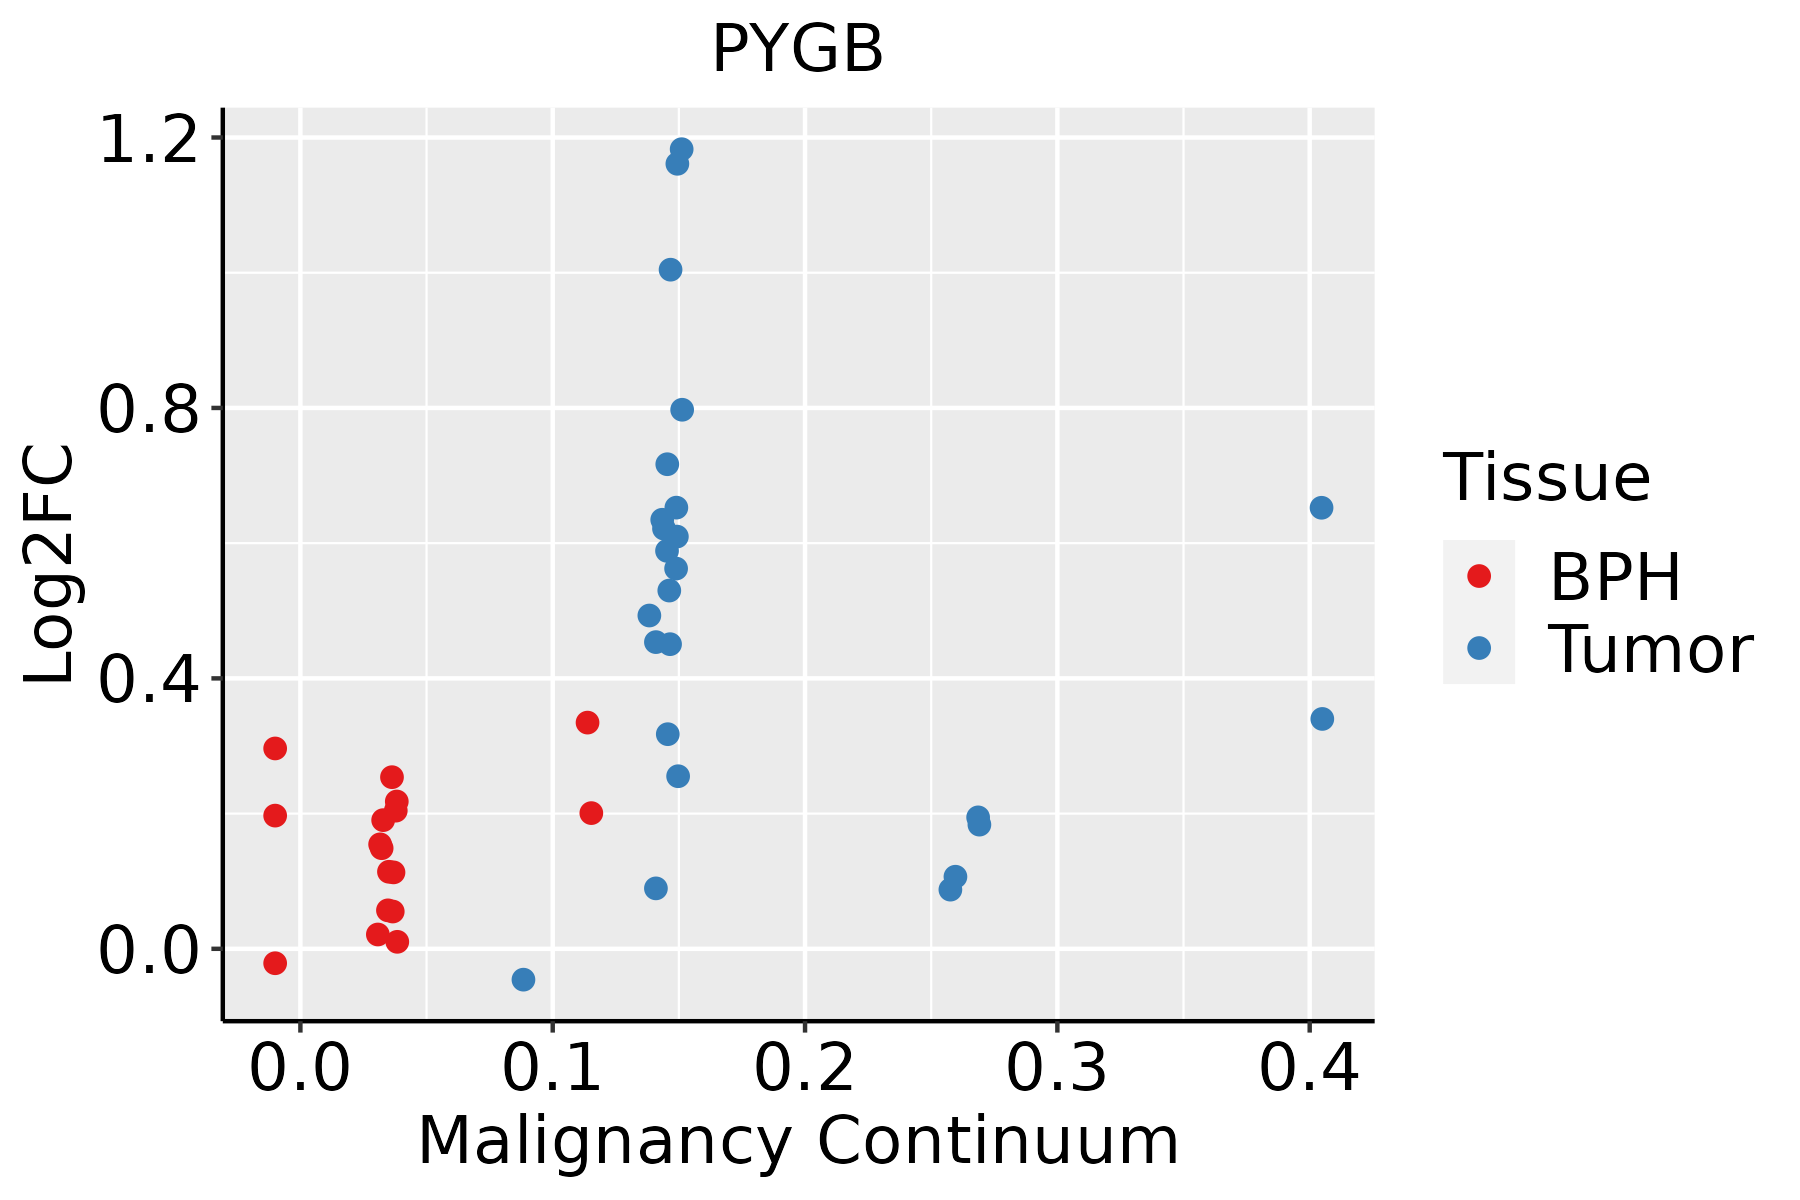 | BPH: Benign Prostatic Hyperplasia |
| Skin | 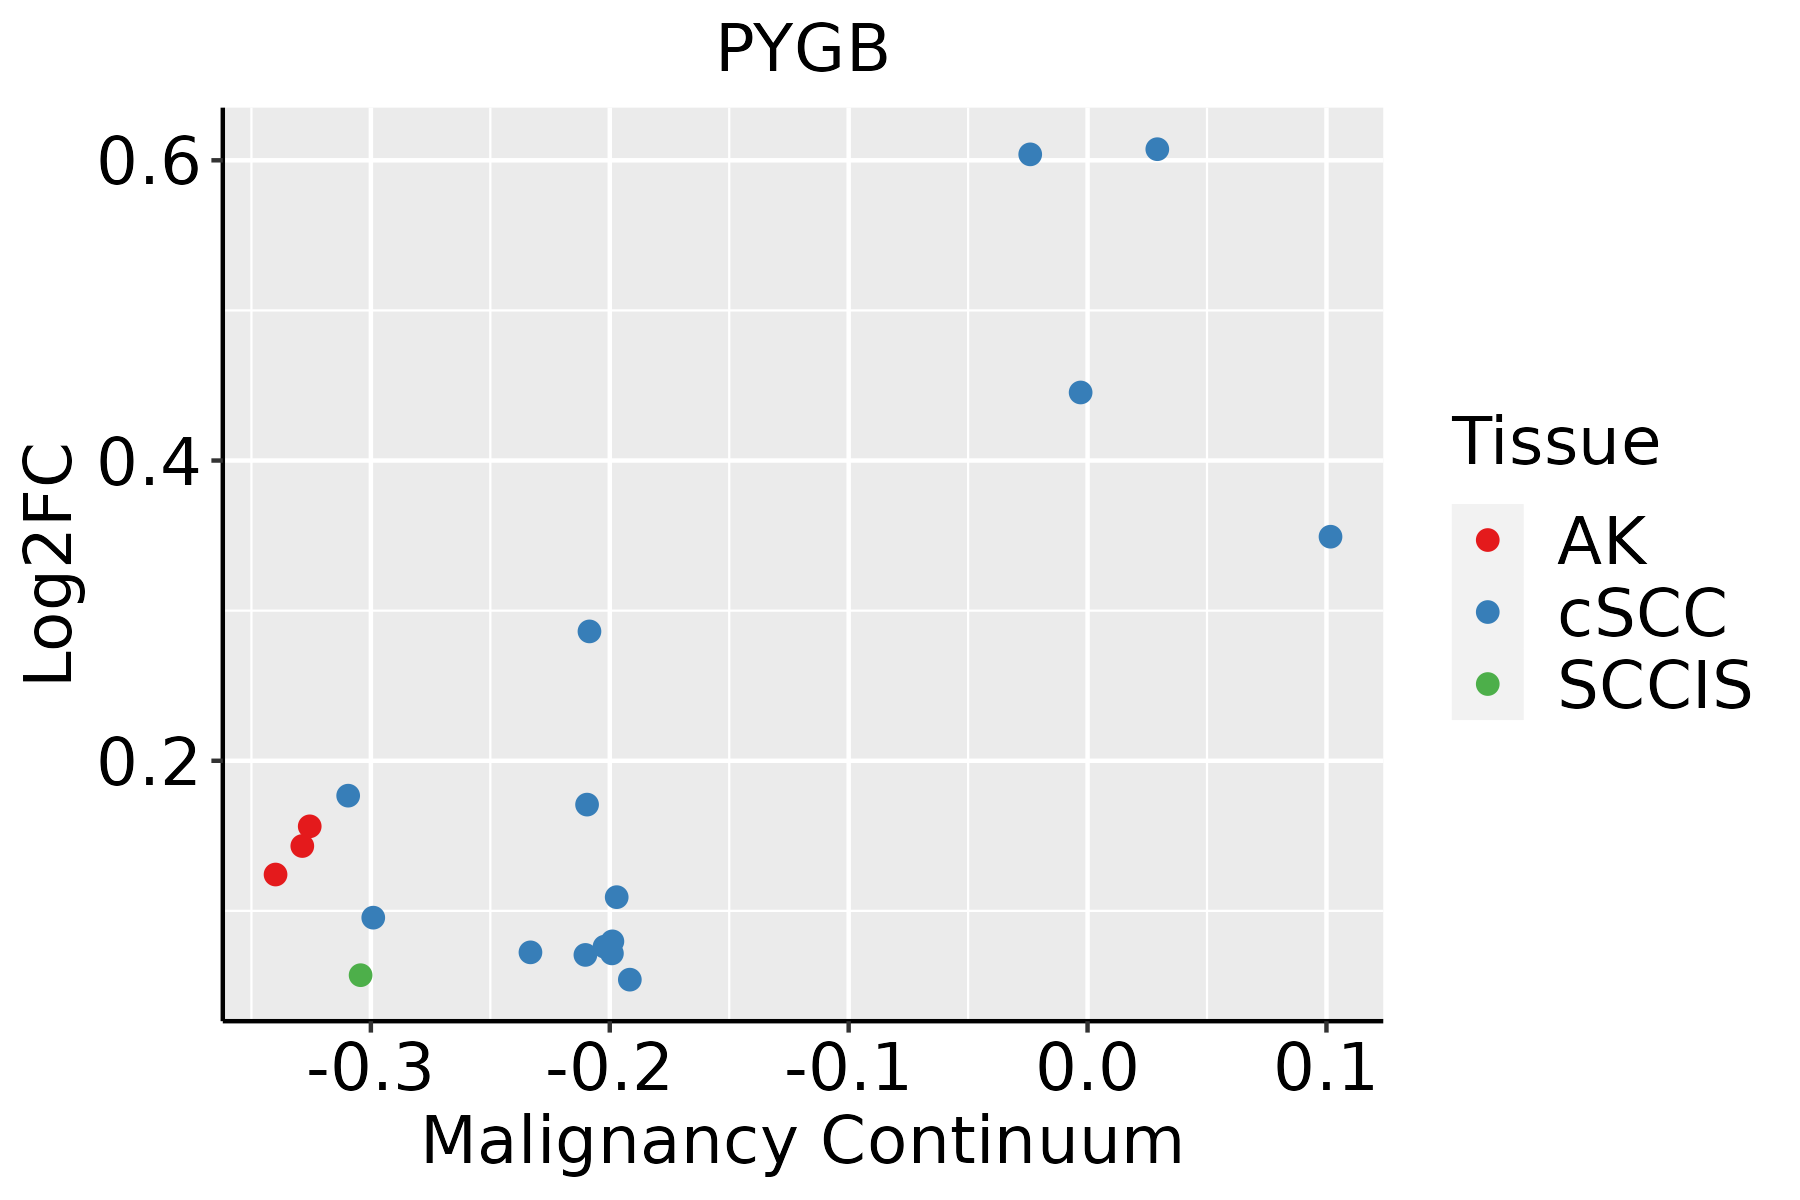 | AK: Actinic keratosis |
| cSCC: Cutaneous squamous cell carcinoma |
| SCCIS:squamous cell carcinoma in situ |
| Thyroid | 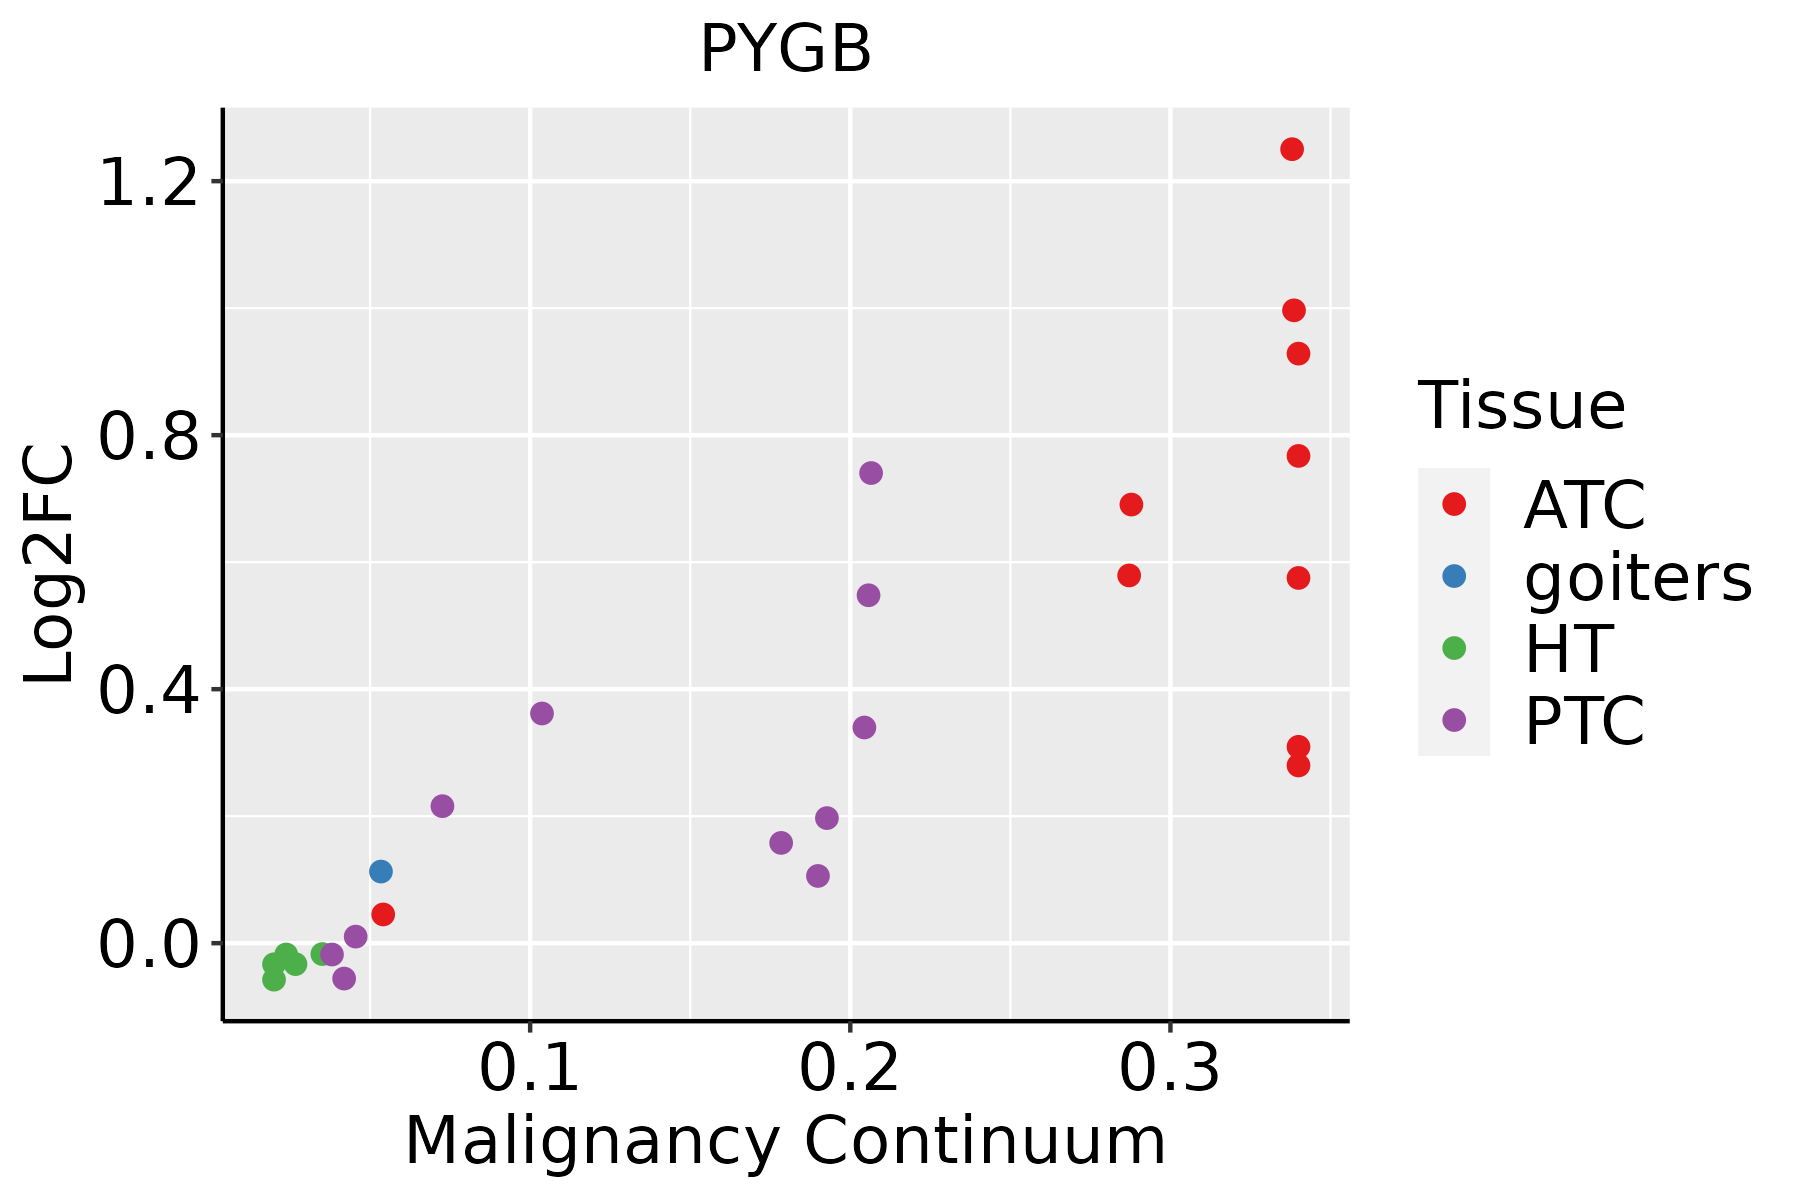 | ATC: Anaplastic thyroid cancer |
| HT: Hashimoto's thyroiditis |
| PTC: Papillary thyroid cancer |
| GO ID | Tissue | Disease Stage | Description | Gene Ratio | Bg Ratio | pvalue | p.adjust | Count |
| GO:0006091 | Colorectum | AD | generation of precursor metabolites and energy | 209/3918 | 490/18723 | 3.17e-28 | 6.61e-25 | 209 |
| GO:0015980 | Colorectum | AD | energy derivation by oxidation of organic compounds | 143/3918 | 318/18723 | 2.78e-22 | 2.49e-19 | 143 |
| GO:0016052 | Colorectum | AD | carbohydrate catabolic process | 56/3918 | 154/18723 | 7.01e-06 | 1.73e-04 | 56 |
| GO:0044262 | Colorectum | AD | cellular carbohydrate metabolic process | 87/3918 | 283/18723 | 6.00e-05 | 1.01e-03 | 87 |
| GO:00060911 | Colorectum | SER | generation of precursor metabolites and energy | 168/2897 | 490/18723 | 1.39e-25 | 1.70e-22 | 168 |
| GO:00159801 | Colorectum | SER | energy derivation by oxidation of organic compounds | 119/2897 | 318/18723 | 5.28e-22 | 4.62e-19 | 119 |
| GO:00160521 | Colorectum | SER | carbohydrate catabolic process | 38/2897 | 154/18723 | 1.92e-03 | 1.93e-02 | 38 |
| GO:00060912 | Colorectum | MSS | generation of precursor metabolites and energy | 186/3467 | 490/18723 | 1.14e-24 | 2.15e-21 | 186 |
| GO:00159802 | Colorectum | MSS | energy derivation by oxidation of organic compounds | 131/3467 | 318/18723 | 2.60e-21 | 2.70e-18 | 131 |
| GO:00160522 | Colorectum | MSS | carbohydrate catabolic process | 45/3467 | 154/18723 | 7.93e-04 | 8.36e-03 | 45 |
| GO:00060914 | Colorectum | FAP | generation of precursor metabolites and energy | 128/2622 | 490/18723 | 5.58e-13 | 4.28e-10 | 128 |
| GO:00159804 | Colorectum | FAP | energy derivation by oxidation of organic compounds | 85/2622 | 318/18723 | 1.36e-09 | 2.77e-07 | 85 |
| GO:00160523 | Colorectum | FAP | carbohydrate catabolic process | 44/2622 | 154/18723 | 1.82e-06 | 7.42e-05 | 44 |
| GO:00442621 | Colorectum | FAP | cellular carbohydrate metabolic process | 66/2622 | 283/18723 | 1.53e-05 | 4.01e-04 | 66 |
| GO:00160524 | Colorectum | CRC | carbohydrate catabolic process | 34/2078 | 154/18723 | 6.37e-05 | 1.39e-03 | 34 |
| GO:00060915 | Colorectum | CRC | generation of precursor metabolites and energy | 80/2078 | 490/18723 | 2.55e-04 | 4.16e-03 | 80 |
| GO:00442622 | Colorectum | CRC | cellular carbohydrate metabolic process | 49/2078 | 283/18723 | 1.06e-03 | 1.24e-02 | 49 |
| GO:0006091110 | Esophagus | ESCC | generation of precursor metabolites and energy | 331/8552 | 490/18723 | 3.86e-23 | 8.45e-21 | 331 |
| GO:0015980110 | Esophagus | ESCC | energy derivation by oxidation of organic compounds | 220/8552 | 318/18723 | 1.20e-17 | 1.09e-15 | 220 |
| GO:00442626 | Esophagus | ESCC | cellular carbohydrate metabolic process | 160/8552 | 283/18723 | 1.43e-04 | 9.66e-04 | 160 |
| Pathway ID | Tissue | Disease Stage | Description | Gene Ratio | Bg Ratio | pvalue | p.adjust | qvalue | Count |
| hsa04922 | Colorectum | AD | Glucagon signaling pathway | 41/2092 | 107/8465 | 1.18e-03 | 7.75e-03 | 4.94e-03 | 41 |
| hsa049221 | Colorectum | AD | Glucagon signaling pathway | 41/2092 | 107/8465 | 1.18e-03 | 7.75e-03 | 4.94e-03 | 41 |
| hsa049222 | Colorectum | SER | Glucagon signaling pathway | 38/1580 | 107/8465 | 2.57e-05 | 3.28e-04 | 2.38e-04 | 38 |
| hsa04217 | Colorectum | SER | Necroptosis | 47/1580 | 159/8465 | 5.21e-04 | 4.44e-03 | 3.22e-03 | 47 |
| hsa049223 | Colorectum | SER | Glucagon signaling pathway | 38/1580 | 107/8465 | 2.57e-05 | 3.28e-04 | 2.38e-04 | 38 |
| hsa042171 | Colorectum | SER | Necroptosis | 47/1580 | 159/8465 | 5.21e-04 | 4.44e-03 | 3.22e-03 | 47 |
| hsa049224 | Colorectum | MSS | Glucagon signaling pathway | 39/1875 | 107/8465 | 5.00e-04 | 3.45e-03 | 2.11e-03 | 39 |
| hsa04931 | Colorectum | MSS | Insulin resistance | 36/1875 | 108/8465 | 4.74e-03 | 2.01e-02 | 1.23e-02 | 36 |
| hsa04910 | Colorectum | MSS | Insulin signaling pathway | 43/1875 | 137/8465 | 7.37e-03 | 2.84e-02 | 1.74e-02 | 43 |
| hsa049225 | Colorectum | MSS | Glucagon signaling pathway | 39/1875 | 107/8465 | 5.00e-04 | 3.45e-03 | 2.11e-03 | 39 |
| hsa049311 | Colorectum | MSS | Insulin resistance | 36/1875 | 108/8465 | 4.74e-03 | 2.01e-02 | 1.23e-02 | 36 |
| hsa049101 | Colorectum | MSS | Insulin signaling pathway | 43/1875 | 137/8465 | 7.37e-03 | 2.84e-02 | 1.74e-02 | 43 |
| hsa049226 | Colorectum | FAP | Glucagon signaling pathway | 32/1404 | 107/8465 | 4.08e-04 | 3.10e-03 | 1.89e-03 | 32 |
| hsa049312 | Colorectum | FAP | Insulin resistance | 32/1404 | 108/8465 | 4.90e-04 | 3.56e-03 | 2.16e-03 | 32 |
| hsa049102 | Colorectum | FAP | Insulin signaling pathway | 36/1404 | 137/8465 | 2.51e-03 | 1.18e-02 | 7.18e-03 | 36 |
| hsa049227 | Colorectum | FAP | Glucagon signaling pathway | 32/1404 | 107/8465 | 4.08e-04 | 3.10e-03 | 1.89e-03 | 32 |
| hsa049313 | Colorectum | FAP | Insulin resistance | 32/1404 | 108/8465 | 4.90e-04 | 3.56e-03 | 2.16e-03 | 32 |
| hsa049103 | Colorectum | FAP | Insulin signaling pathway | 36/1404 | 137/8465 | 2.51e-03 | 1.18e-02 | 7.18e-03 | 36 |
| hsa049314 | Colorectum | CRC | Insulin resistance | 28/1091 | 108/8465 | 1.78e-04 | 2.37e-03 | 1.61e-03 | 28 |
| hsa049104 | Colorectum | CRC | Insulin signaling pathway | 31/1091 | 137/8465 | 1.07e-03 | 8.91e-03 | 6.03e-03 | 31 |
| Hugo Symbol | Variant Class | Variant Classification | dbSNP RS | HGVSc | HGVSp | HGVSp Short | SWISSPROT | BIOTYPE | SIFT | PolyPhen | Tumor Sample Barcode | Tissue | Histology | Sex | Age | Stage | Therapy Types | Drugs | Outcome |
| PYGB | SNV | Missense_Mutation | novel | c.1754T>A | p.Val585Asp | p.V585D | P11216 | protein_coding | deleterious(0) | possibly_damaging(0.494) | TCGA-C8-A12P-01 | Breast | breast invasive carcinoma | Female | <65 | I/II | Unknown | Unknown | SD |
| PYGB | SNV | Missense_Mutation | rs769655708 | c.281G>A | p.Arg94His | p.R94H | P11216 | protein_coding | deleterious(0) | probably_damaging(0.995) | TCGA-D8-A1J8-01 | Breast | breast invasive carcinoma | Female | >=65 | I/II | Hormone Therapy | nolvadex | SD |
| PYGB | SNV | Missense_Mutation | rs767929147 | c.444G>A | p.Met148Ile | p.M148I | P11216 | protein_coding | deleterious(0.04) | benign(0.251) | TCGA-EW-A1OY-01 | Breast | breast invasive carcinoma | Female | <65 | I/II | Chemotherapy | doxorubicin | SD |
| PYGB | SNV | Missense_Mutation | novel | c.2168A>G | p.Asp723Gly | p.D723G | P11216 | protein_coding | tolerated(0.06) | benign(0.03) | TCGA-LD-A66U-01 | Breast | breast invasive carcinoma | Female | <65 | I/II | Chemotherapy | adriamycin | SD |
| PYGB | SNV | Missense_Mutation | novel | c.1229N>T | p.Arg410Leu | p.R410L | P11216 | protein_coding | tolerated(0.08) | benign(0.009) | TCGA-UL-AAZ6-01 | Breast | breast invasive carcinoma | Female | >=65 | I/II | Chemotherapy | herceptin | SD |
| PYGB | deletion | Frame_Shift_Del | novel | c.1554delN | p.Gln518HisfsTer2 | p.Q518Hfs*2 | P11216 | protein_coding | | | TCGA-D8-A27V-01 | Breast | breast invasive carcinoma | Female | <65 | I/II | Hormone Therapy | tamoxiphen | SD |
| PYGB | deletion | Frame_Shift_Del | novel | c.697delN | p.Gly233AlafsTer62 | p.G233Afs*62 | P11216 | protein_coding | | | TCGA-EW-A2FV-01 | Breast | breast invasive carcinoma | Female | <65 | III/IV | Chemotherapy | docetaxel | SD |
| PYGB | SNV | Missense_Mutation | rs769655708 | c.281N>A | p.Arg94His | p.R94H | P11216 | protein_coding | deleterious(0) | probably_damaging(0.995) | TCGA-2W-A8YY-01 | Cervix | cervical & endocervical cancer | Female | <65 | I/II | Chemotherapy | cisplatin | CR |
| PYGB | SNV | Missense_Mutation | rs532747607 | c.715N>A | p.Val239Ile | p.V239I | P11216 | protein_coding | deleterious(0.05) | possibly_damaging(0.646) | TCGA-2W-A8YY-01 | Cervix | cervical & endocervical cancer | Female | <65 | I/II | Chemotherapy | cisplatin | CR |
| PYGB | SNV | Missense_Mutation | novel | c.904N>A | p.Ala302Thr | p.A302T | P11216 | protein_coding | deleterious(0.02) | possibly_damaging(0.881) | TCGA-2W-A8YY-01 | Cervix | cervical & endocervical cancer | Female | <65 | I/II | Chemotherapy | cisplatin | CR |


