
|
|||||
|
 | |
| |
| |
| |
| |
| |
|
Gene: PYCRL |
Gene summary for PYCRL |
| Gene information | Species | Human | Gene symbol | PYCRL | Gene ID | 65263 |
| Gene name | pyrroline-5-carboxylate reductase 3 | |
| Gene Alias | PYCRL | |
| Cytomap | 8q24.3 | |
| Gene Type | protein-coding | GO ID | GO:0006082 | UniProtAcc | B4DGI7 |
Top |
Malignant transformation analysis |
| Identification of the aberrant gene expression in precancerous and cancerous lesions by comparing the gene expression of stem-like cells in diseased tissues with normal stem cells |
| Entrez ID | Symbol | Replicates | Species | Organ | Tissue | Adj P-value | Log2FC | Malignancy |
| 65263 | PYCRL | P2T-E | Human | Esophagus | ESCC | 1.23e-20 | 3.87e-01 | 0.1177 |
| 65263 | PYCRL | P4T-E | Human | Esophagus | ESCC | 2.30e-12 | 3.67e-01 | 0.1323 |
| 65263 | PYCRL | P5T-E | Human | Esophagus | ESCC | 9.74e-22 | 3.71e-01 | 0.1327 |
| 65263 | PYCRL | P8T-E | Human | Esophagus | ESCC | 2.05e-07 | 1.53e-01 | 0.0889 |
| 65263 | PYCRL | P9T-E | Human | Esophagus | ESCC | 2.41e-09 | 2.38e-01 | 0.1131 |
| 65263 | PYCRL | P10T-E | Human | Esophagus | ESCC | 9.20e-06 | 1.18e-01 | 0.116 |
| 65263 | PYCRL | P11T-E | Human | Esophagus | ESCC | 5.52e-07 | 2.49e-01 | 0.1426 |
| 65263 | PYCRL | P12T-E | Human | Esophagus | ESCC | 7.31e-14 | 3.08e-01 | 0.1122 |
| 65263 | PYCRL | P15T-E | Human | Esophagus | ESCC | 1.14e-14 | 3.39e-01 | 0.1149 |
| 65263 | PYCRL | P16T-E | Human | Esophagus | ESCC | 2.13e-27 | 5.59e-01 | 0.1153 |
| 65263 | PYCRL | P17T-E | Human | Esophagus | ESCC | 1.87e-06 | 4.27e-01 | 0.1278 |
| 65263 | PYCRL | P19T-E | Human | Esophagus | ESCC | 3.55e-03 | 4.03e-01 | 0.1662 |
| 65263 | PYCRL | P20T-E | Human | Esophagus | ESCC | 9.85e-09 | 2.48e-01 | 0.1124 |
| 65263 | PYCRL | P21T-E | Human | Esophagus | ESCC | 1.46e-28 | 5.67e-01 | 0.1617 |
| 65263 | PYCRL | P22T-E | Human | Esophagus | ESCC | 5.30e-21 | 3.44e-01 | 0.1236 |
| 65263 | PYCRL | P23T-E | Human | Esophagus | ESCC | 1.64e-18 | 5.07e-01 | 0.108 |
| 65263 | PYCRL | P24T-E | Human | Esophagus | ESCC | 5.79e-16 | 3.33e-01 | 0.1287 |
| 65263 | PYCRL | P26T-E | Human | Esophagus | ESCC | 1.85e-18 | 3.90e-01 | 0.1276 |
| 65263 | PYCRL | P27T-E | Human | Esophagus | ESCC | 8.08e-19 | 3.09e-01 | 0.1055 |
| 65263 | PYCRL | P28T-E | Human | Esophagus | ESCC | 1.53e-19 | 3.28e-01 | 0.1149 |
| Page: 1 2 3 4 |
| Tissue | Expression Dynamics | Abbreviation |
| Esophagus | 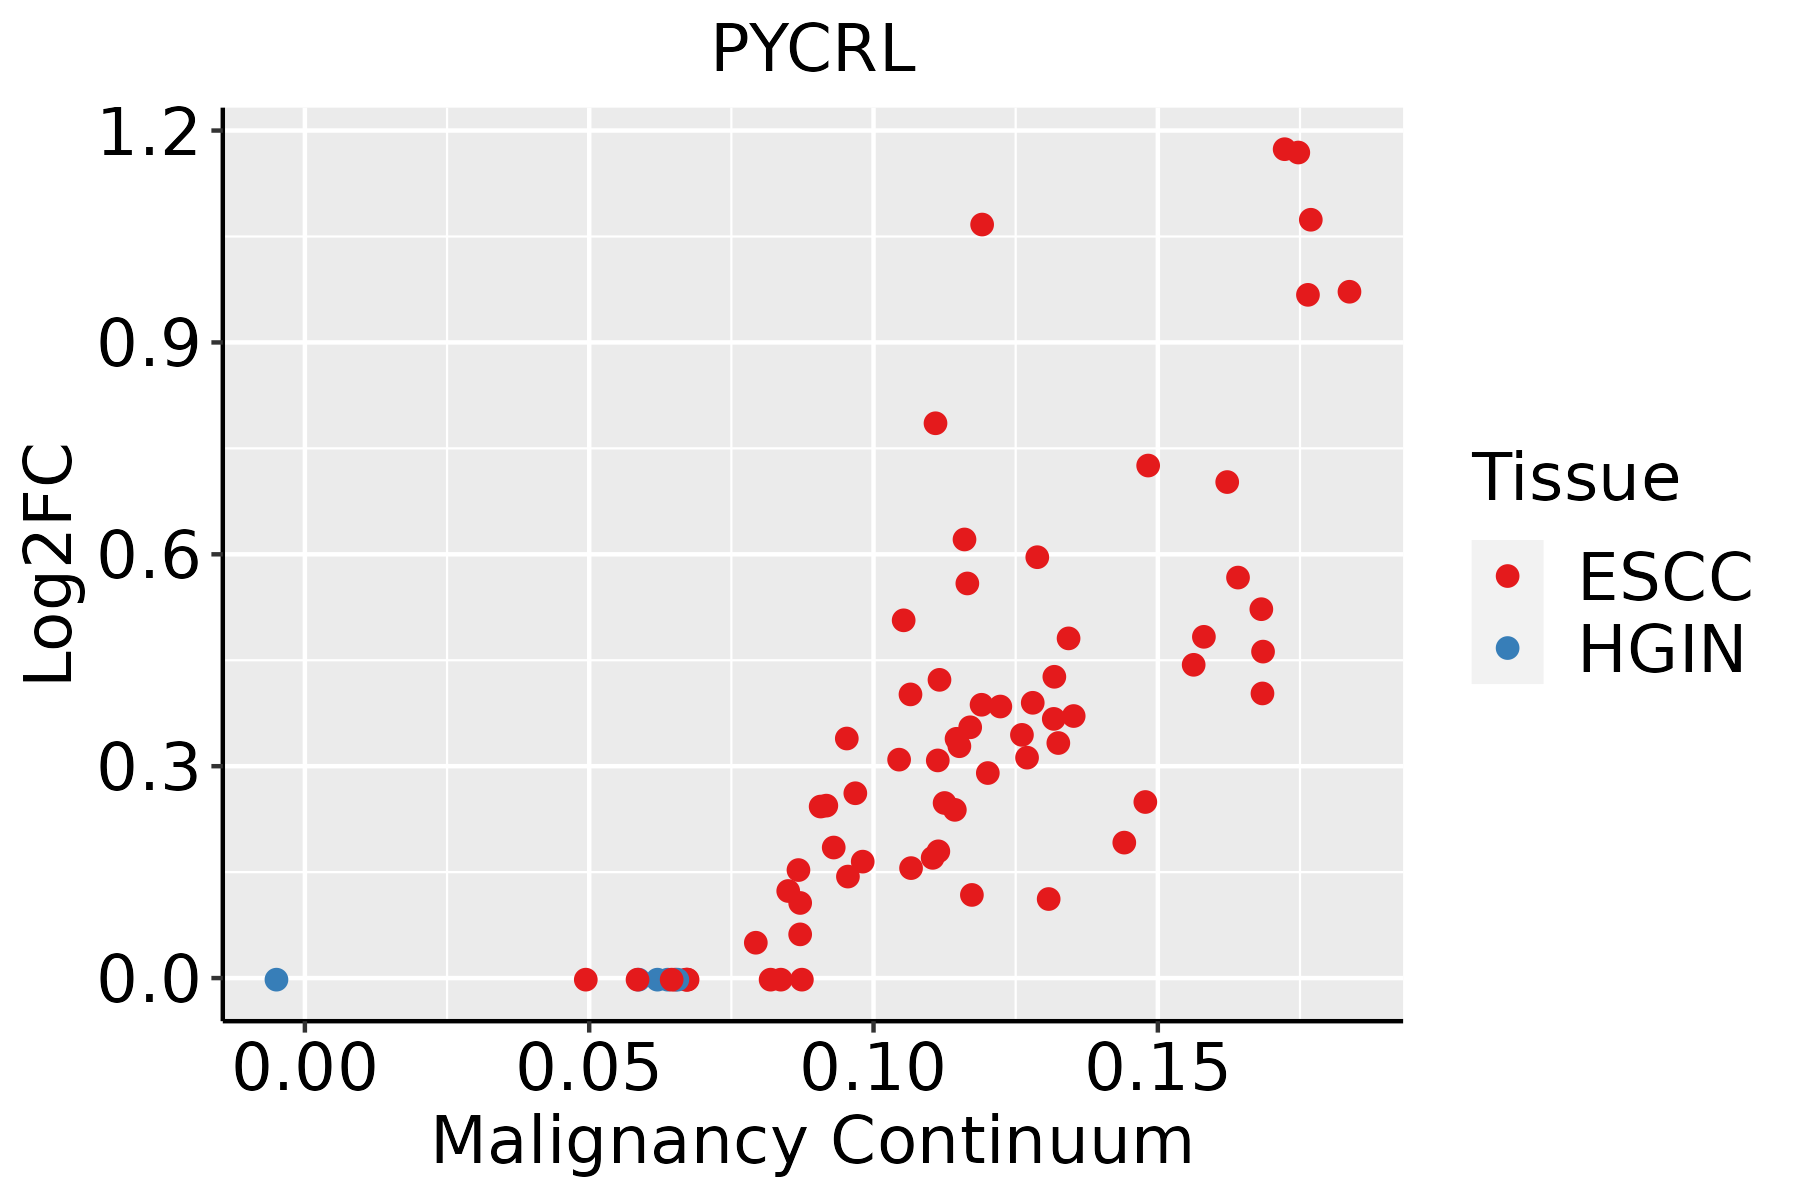 | ESCC: Esophageal squamous cell carcinoma |
| HGIN: High-grade intraepithelial neoplasias | ||
| LGIN: Low-grade intraepithelial neoplasias | ||
| Liver | 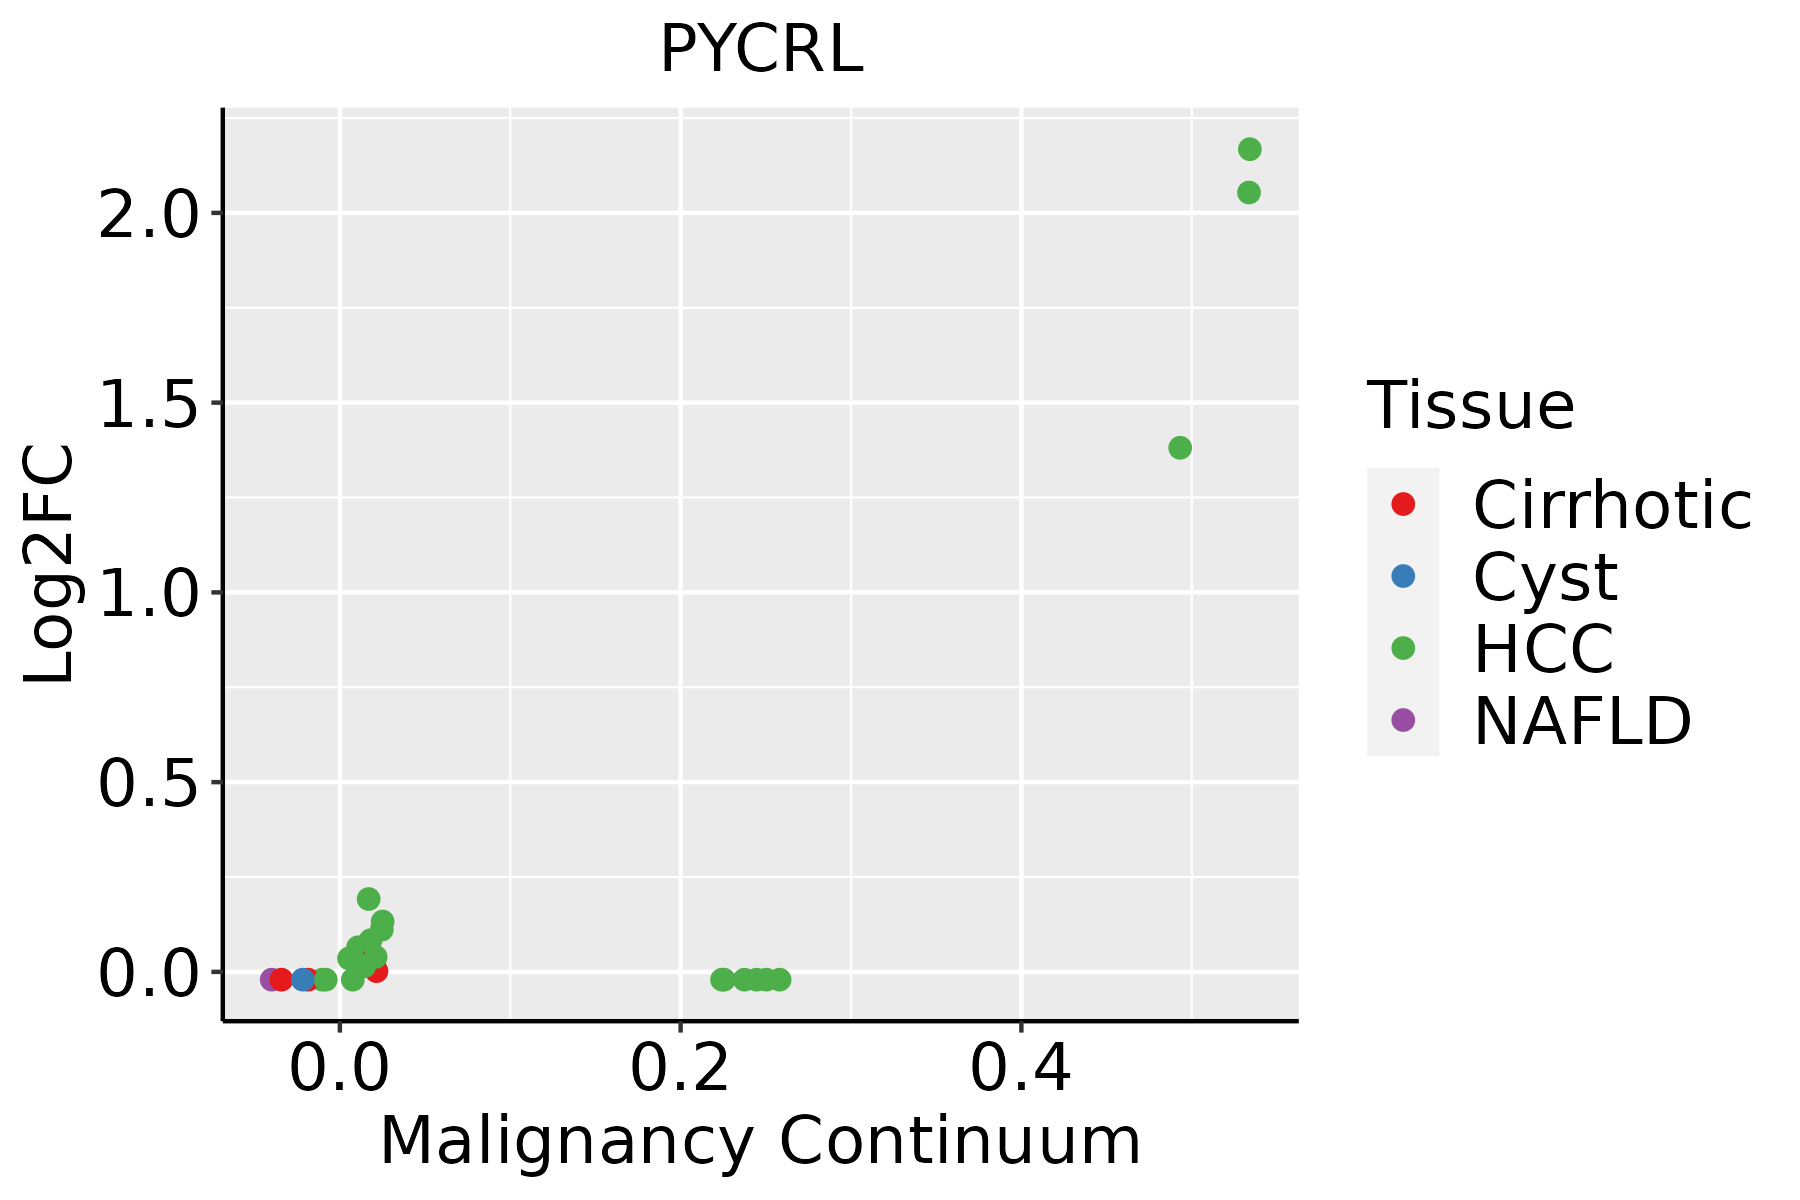 | HCC: Hepatocellular carcinoma |
| NAFLD: Non-alcoholic fatty liver disease | ||
| Oral Cavity |  | EOLP: Erosive Oral lichen planus |
| LP: leukoplakia | ||
| NEOLP: Non-erosive oral lichen planus | ||
| OSCC: Oral squamous cell carcinoma |
| ∗log2FC in expression of this searched gene in stem-like cells from each diseased tissue sample relative to stem-like cells in normal samples in each tissue plotted against the malignancy continuum. Samples are colored based on if they are from different disease stage. |
Top |
Malignant transformation related pathway analysis |
| Find out the enriched GO biological processes and KEGG pathways involved in transition from healthy to precancer to cancer |
| Tissue | Disease Stage | Enriched GO biological Processes |
| Colorectum | AD |  |
| Colorectum | SER |  |
| Colorectum | MSS |  |
| Colorectum | MSI-H |  |
| Colorectum | FAP |  |
| ∗Top 15 enriched GO BP terms are showed in the bar plot of each disease state in each tissue. Each row represents a significant GO biological process which is colored according to the -log10(p.adjust). |
| Page: 1 2 3 4 5 6 7 8 9 |
| GO ID | Tissue | Disease Stage | Description | Gene Ratio | Bg Ratio | pvalue | p.adjust | Count |
| Page: 1 |
| Pathway ID | Tissue | Disease Stage | Description | Gene Ratio | Bg Ratio | pvalue | p.adjust | qvalue | Count |
| Page: 1 |
Top |
Cell-cell communication analysis |
| Identification of potential cell-cell interactions between two cell types and their ligand-receptor pairs for different disease states |
| Ligand | Receptor | LRpair | Pathway | Tissue | Disease Stage |
| Page: 1 |
Top |
Single-cell gene regulatory network inference analysis |
| Find out the significant the regulons (TFs) and the target genes of each regulon across cell types for different disease states |
| TF | Cell Type | Tissue | Disease Stage | Target Gene | RSS | Regulon Activity |
| ∗The dot plots of a searched regulon are shown for all cell subpopulations in each disease state of each tissue based on the regulon specific score inferred using pySCENIC and by calculating the average expression. |
| Page: 1 |
Top |
Somatic mutation of malignant transformation related genes |
| Annotation of somatic variants for genes involved in malignant transformation |
| Hugo Symbol | Variant Class | Variant Classification | dbSNP RS | HGVSc | HGVSp | HGVSp Short | SWISSPROT | BIOTYPE | SIFT | PolyPhen | Tumor Sample Barcode | Tissue | Histology | Sex | Age | Stage | Therapy Types | Drugs | Outcome |
| PYCRL | SNV | Missense_Mutation | c.781N>C | p.Glu261Gln | p.E261Q | protein_coding | deleterious(0) | possibly_damaging(0.857) | TCGA-D8-A27G-01 | Breast | breast invasive carcinoma | Female | >=65 | I/II | Unknown | Unknown | SD | ||
| PYCRL | SNV | Missense_Mutation | rs138226068 | c.790G>A | p.Gly264Arg | p.G264R | protein_coding | deleterious(0.03) | probably_damaging(0.954) | TCGA-EA-A410-01 | Cervix | cervical & endocervical cancer | Female | <65 | I/II | Unknown | Unknown | SD | |
| PYCRL | SNV | Missense_Mutation | c.806C>T | p.Thr269Ile | p.T269I | protein_coding | tolerated(0.15) | possibly_damaging(0.628) | TCGA-NH-A5IV-01 | Colorectum | colon adenocarcinoma | Female | >=65 | I/II | Unknown | Unknown | SD | ||
| PYCRL | SNV | Missense_Mutation | rs142512194 | c.547G>A | p.Asp183Asn | p.D183N | protein_coding | tolerated(0.11) | benign(0.111) | TCGA-EI-6917-01 | Colorectum | rectum adenocarcinoma | Male | <65 | III/IV | Chemotherapy | 5fluorouracil+oxaciplatina+l-folinian | SD | |
| PYCRL | SNV | Missense_Mutation | rs776301894 | c.391C>T | p.Arg131Trp | p.R131W | protein_coding | deleterious(0) | probably_damaging(0.969) | TCGA-A5-A0VP-01 | Endometrium | uterine corpus endometrioid carcinoma | Female | >=65 | I/II | Unknown | Unknown | SD | |
| PYCRL | SNV | Missense_Mutation | novel | c.421T>G | p.Cys141Gly | p.C141G | protein_coding | deleterious(0) | possibly_damaging(0.908) | TCGA-AP-A1DV-01 | Endometrium | uterine corpus endometrioid carcinoma | Female | <65 | I/II | Unknown | Unknown | SD | |
| PYCRL | SNV | Missense_Mutation | c.140N>A | p.Ala47Asp | p.A47D | protein_coding | deleterious(0) | probably_damaging(0.947) | TCGA-AX-A2HC-01 | Endometrium | uterine corpus endometrioid carcinoma | Female | <65 | III/IV | Chemotherapy | paclitaxel | PD | ||
| PYCRL | SNV | Missense_Mutation | c.800C>T | p.Ala267Val | p.A267V | protein_coding | deleterious(0) | probably_damaging(0.999) | TCGA-BG-A18B-01 | Endometrium | uterine corpus endometrioid carcinoma | Female | <65 | I/II | Unknown | Unknown | SD | ||
| PYCRL | SNV | Missense_Mutation | novel | c.592N>A | p.Ala198Thr | p.A198T | protein_coding | tolerated(0.48) | benign(0.001) | TCGA-E6-A1LX-01 | Endometrium | uterine corpus endometrioid carcinoma | Female | <65 | I/II | Unknown | Unknown | SD | |
| PYCRL | SNV | Missense_Mutation | rs776301894 | c.391N>T | p.Arg131Trp | p.R131W | protein_coding | deleterious(0) | probably_damaging(0.969) | TCGA-EC-A24G-01 | Endometrium | uterine corpus endometrioid carcinoma | Female | <65 | I/II | Chemotherapy | doxorubicin | SD |
| Page: 1 2 |
Top |
Related drugs of malignant transformation related genes |
| Identification of chemicals and drugs interact with genes involved in malignant transfromation |
| (DGIdb 4.0) |
| Entrez ID | Symbol | Category | Interaction Types | Drug Claim Name | Drug Name | PMIDs |
| Page: 1 |

Copyright 2023-Present -The University of Texas Health Science Center at Houston |