| Tissue | Expression Dynamics | Abbreviation |
| Colorectum (GSE201348) |  | FAP: Familial adenomatous polyposis |
| CRC: Colorectal cancer |
| Colorectum (HTA11) |  | AD: Adenomas |
| SER: Sessile serrated lesions |
| MSI-H: Microsatellite-high colorectal cancer |
| MSS: Microsatellite stable colorectal cancer |
| Esophagus | 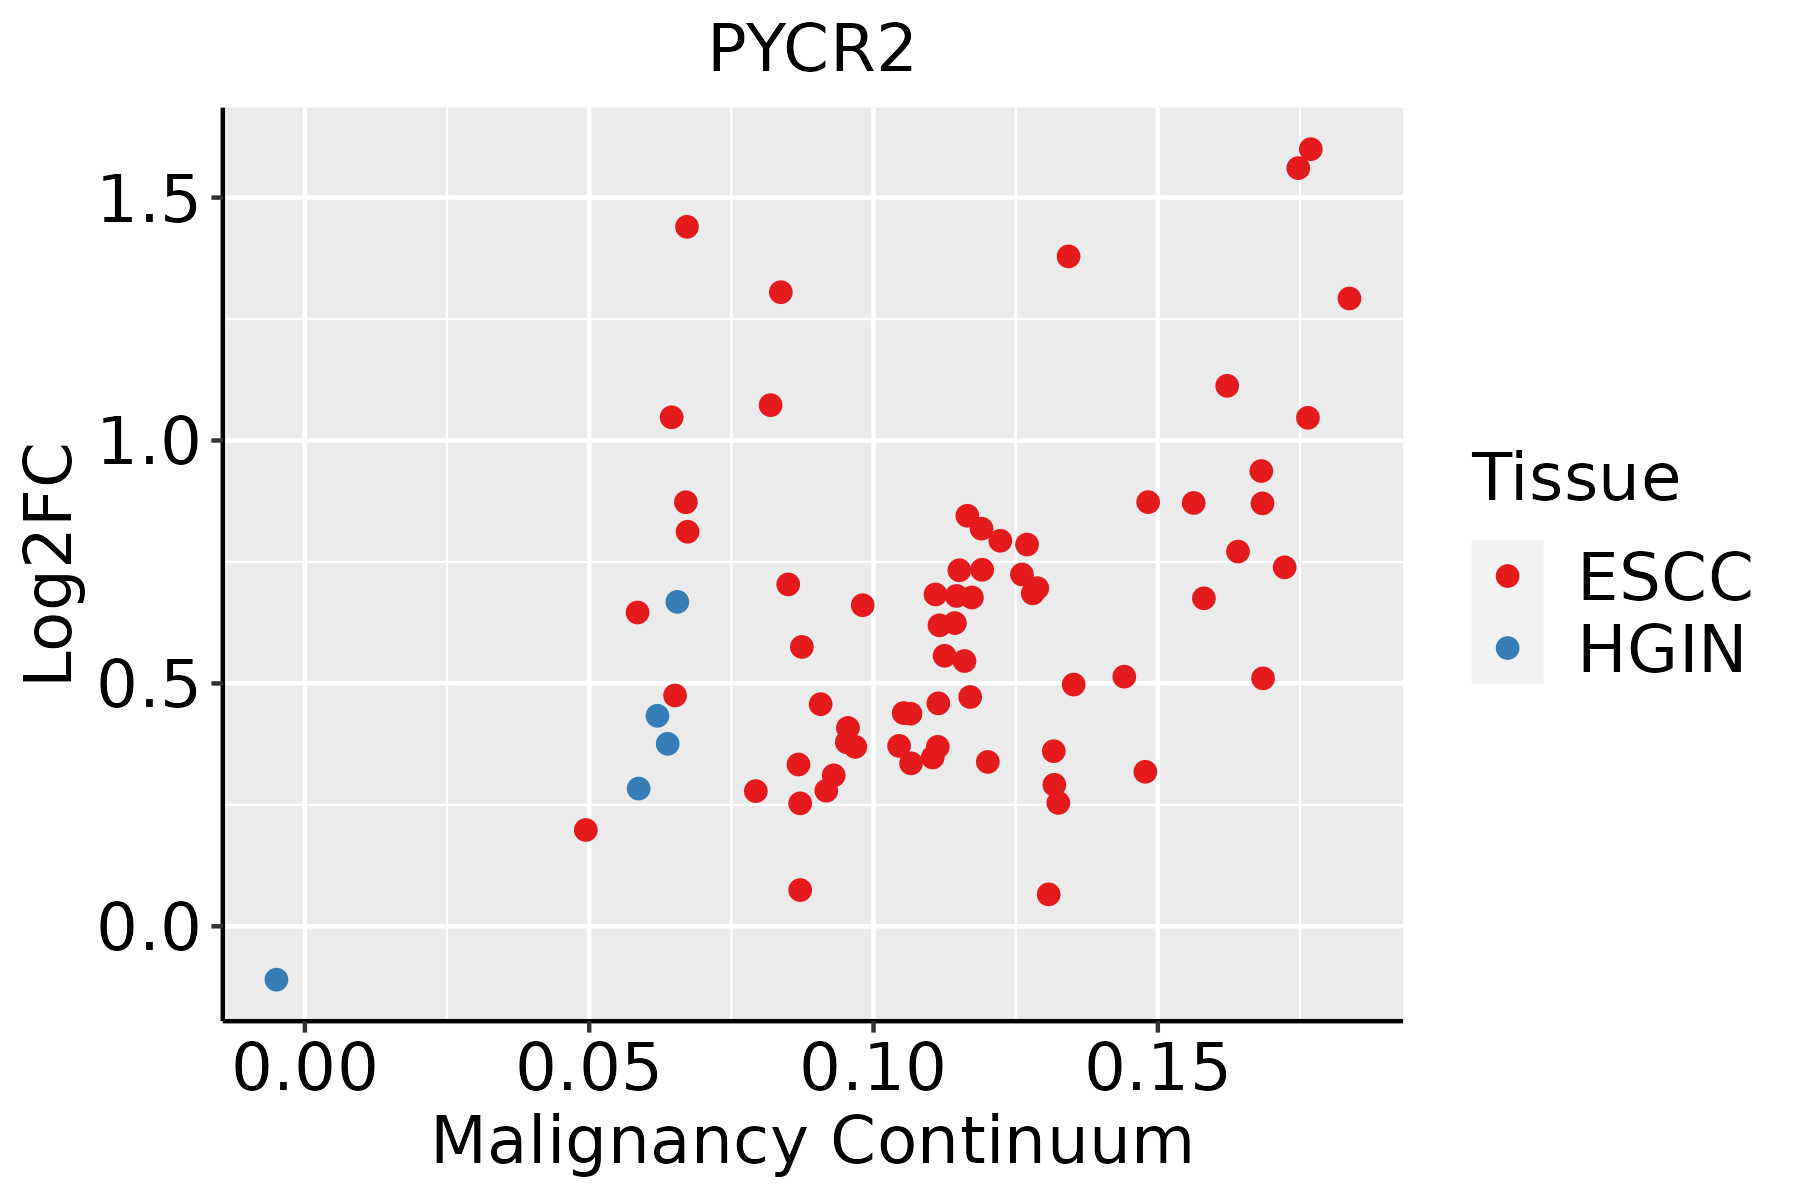 | ESCC: Esophageal squamous cell carcinoma |
| HGIN: High-grade intraepithelial neoplasias |
| LGIN: Low-grade intraepithelial neoplasias |
| Liver | 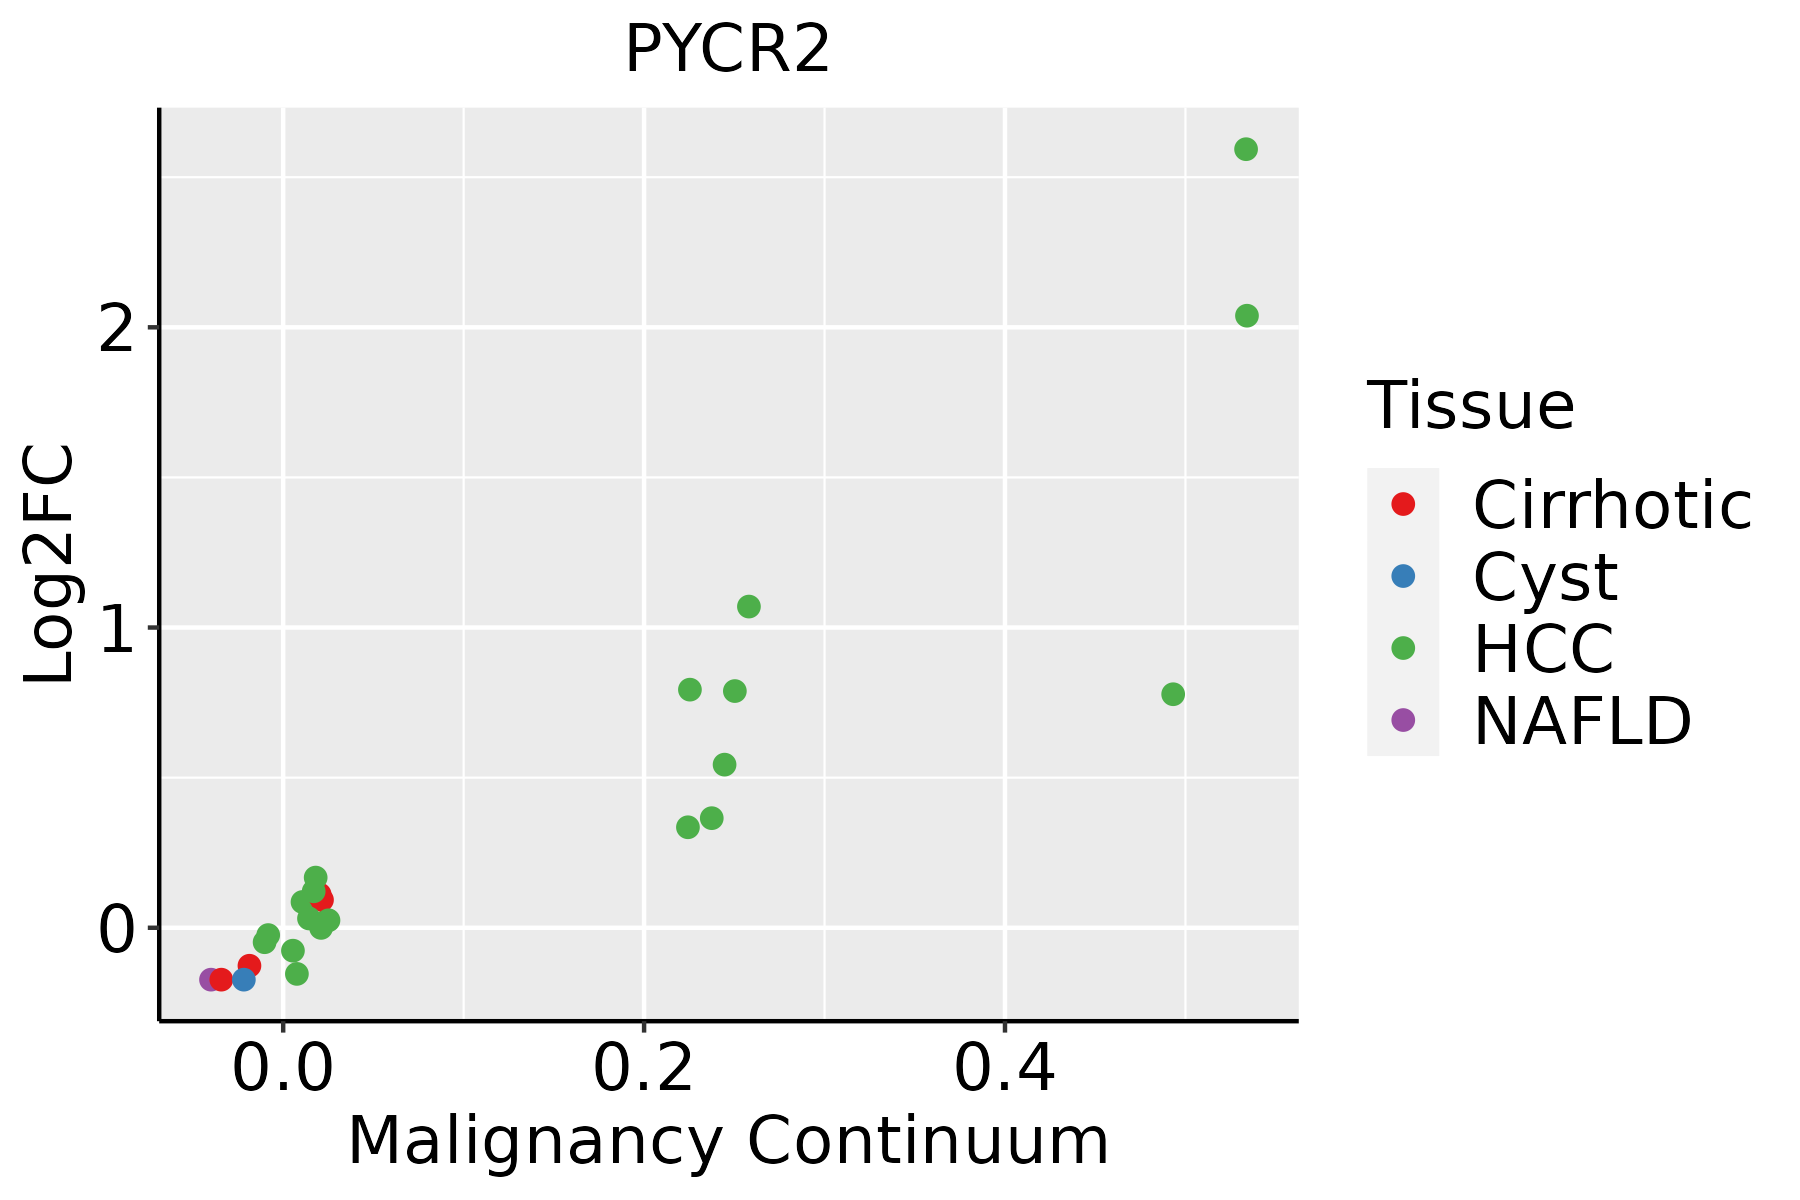 | HCC: Hepatocellular carcinoma |
| NAFLD: Non-alcoholic fatty liver disease |
| Oral Cavity | 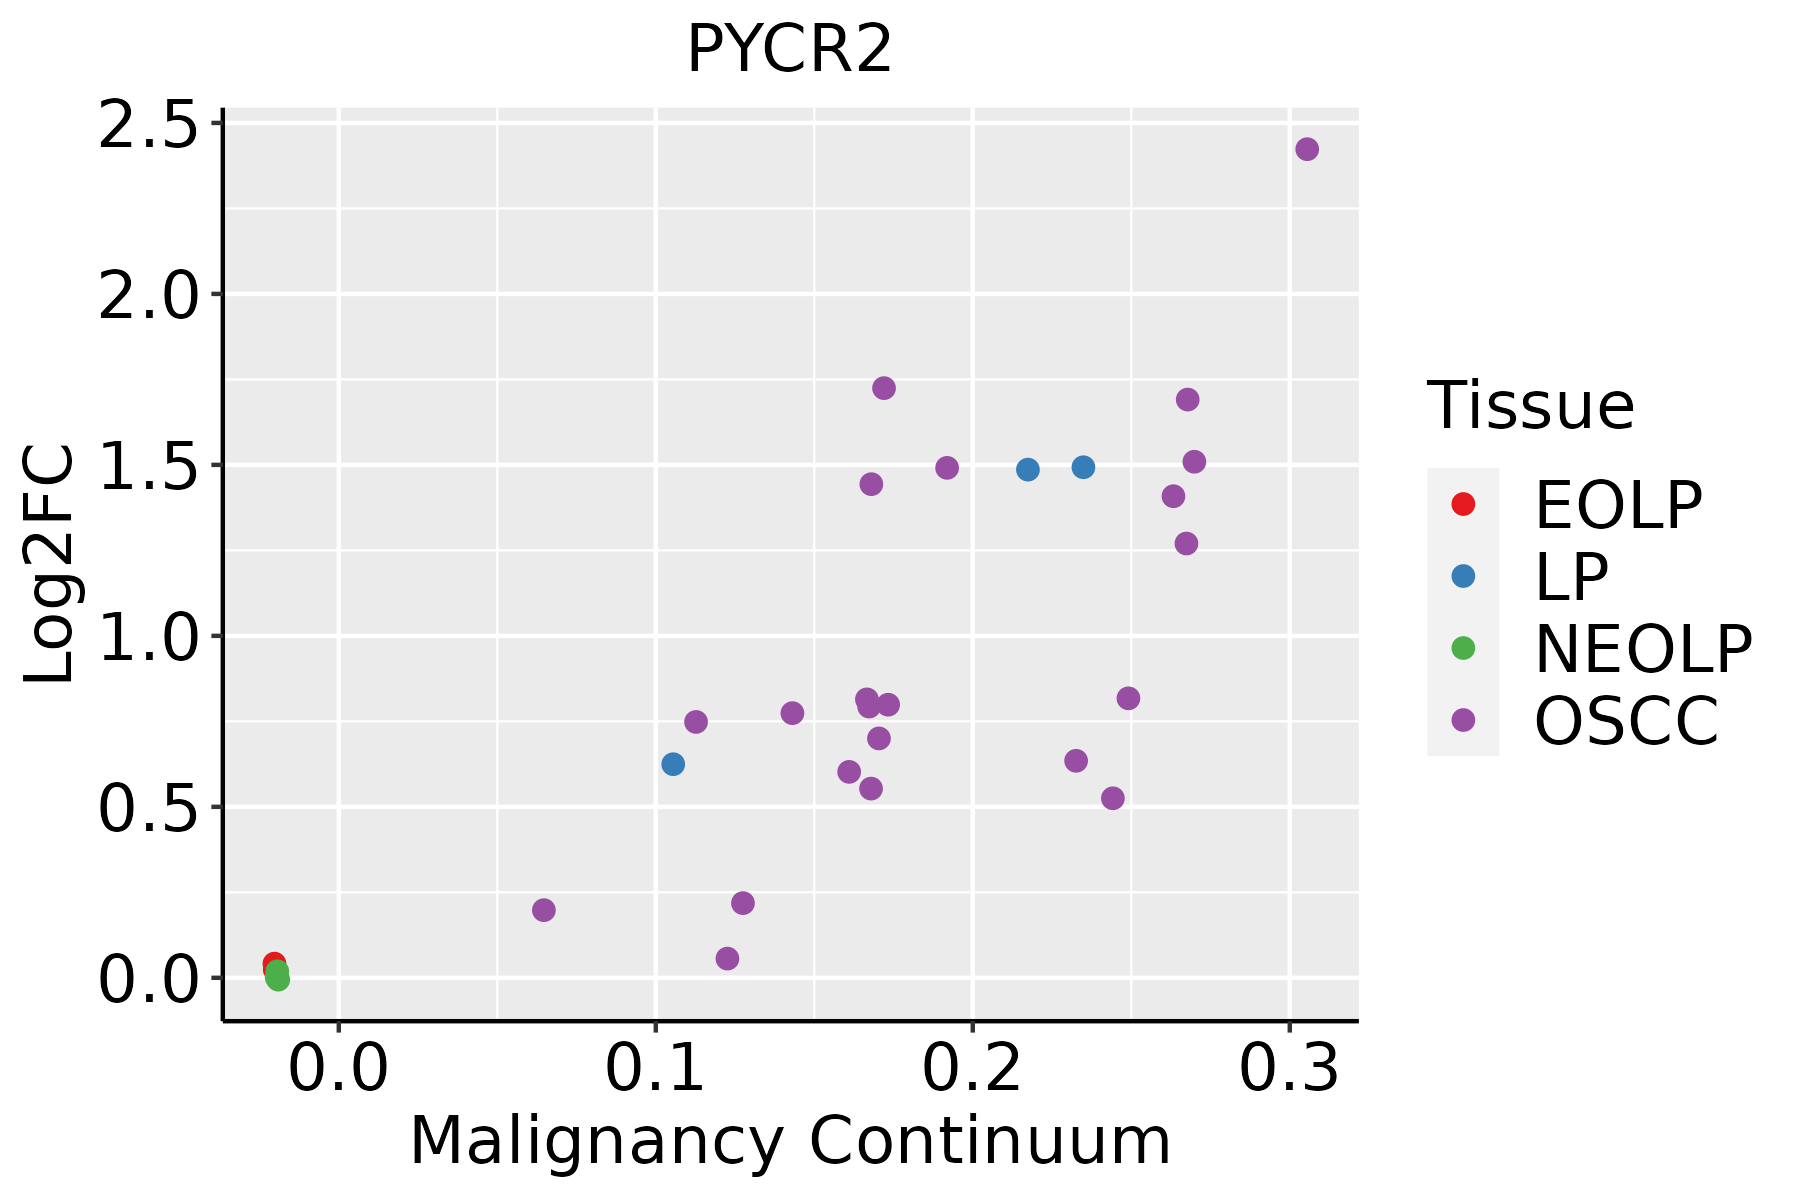 | EOLP: Erosive Oral lichen planus |
| LP: leukoplakia |
| NEOLP: Non-erosive oral lichen planus |
| OSCC: Oral squamous cell carcinoma |
| Skin | 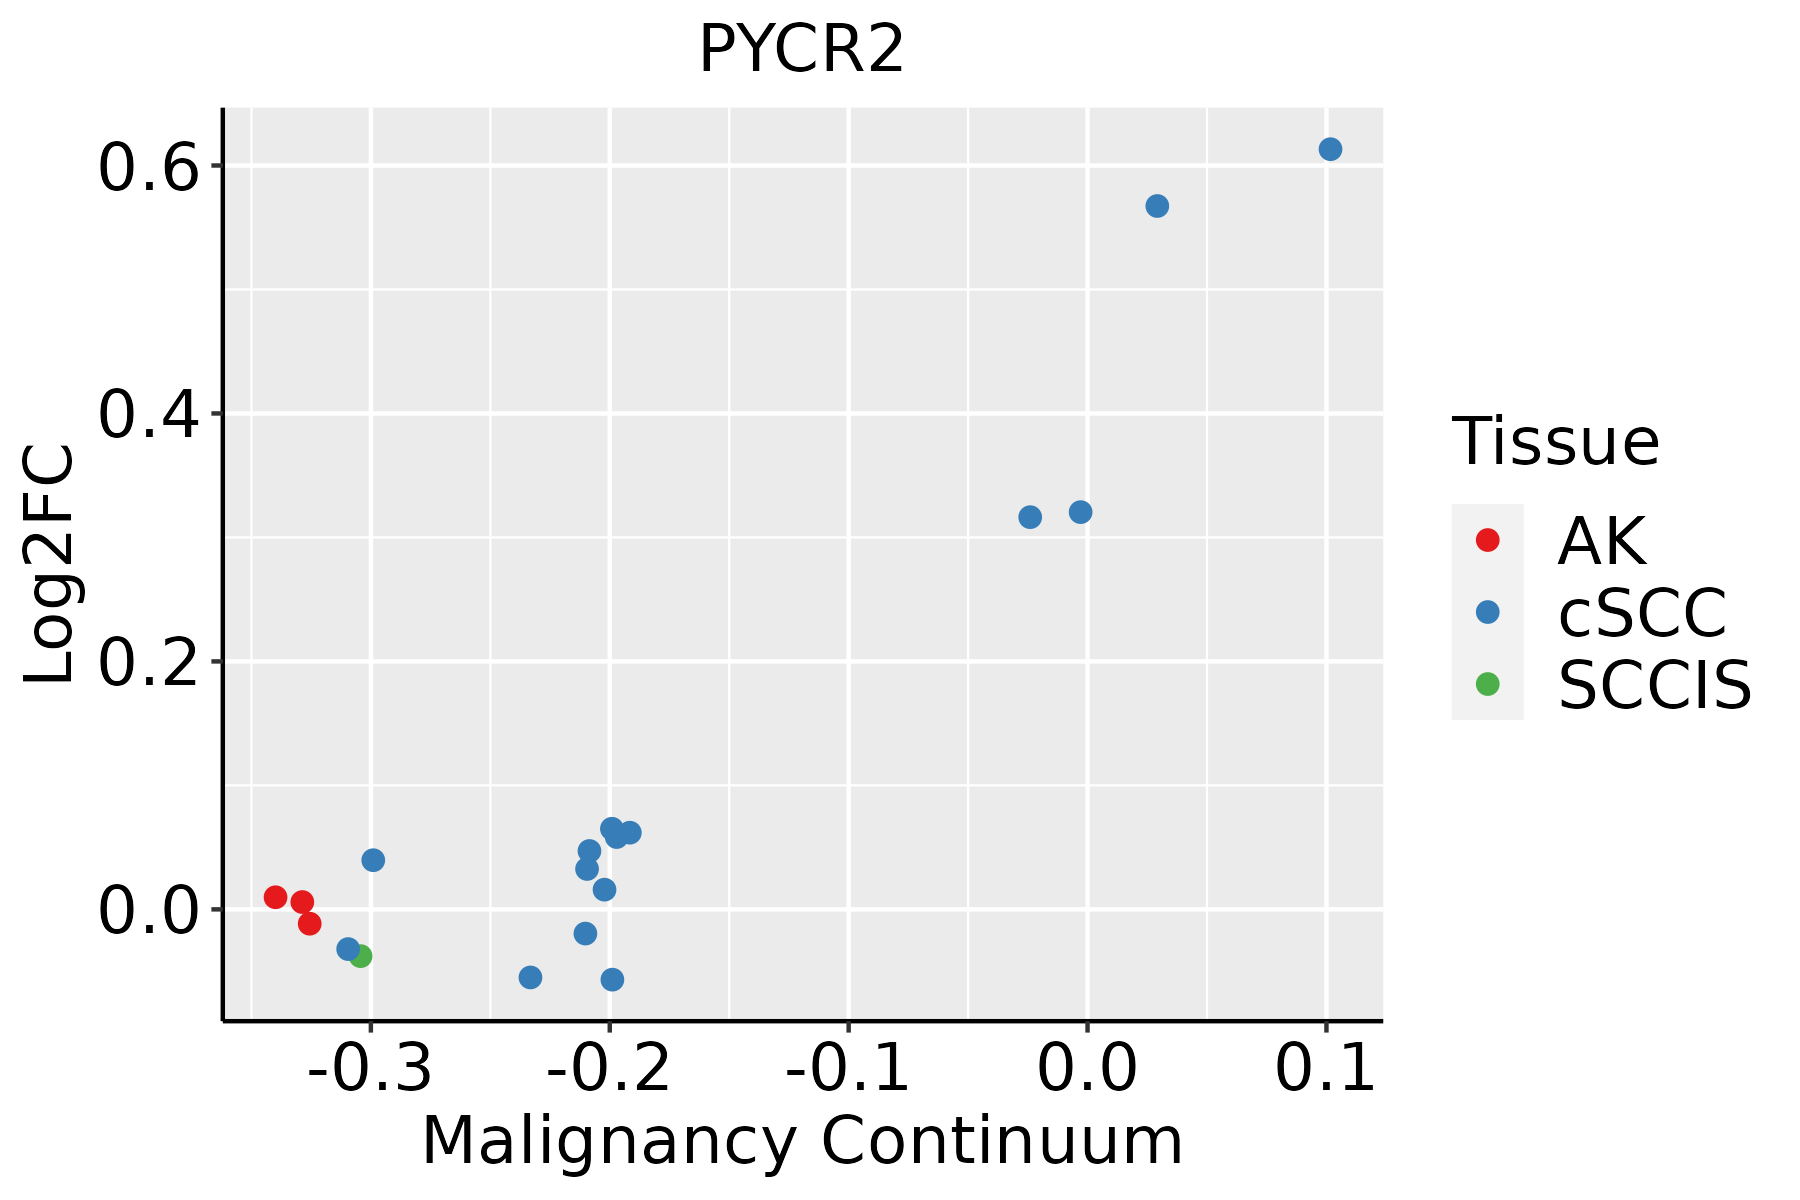 | AK: Actinic keratosis |
| cSCC: Cutaneous squamous cell carcinoma |
| SCCIS:squamous cell carcinoma in situ |
| GO ID | Tissue | Disease Stage | Description | Gene Ratio | Bg Ratio | pvalue | p.adjust | Count |
| GO:0006979 | Colorectum | AD | response to oxidative stress | 145/3918 | 446/18723 | 5.16e-09 | 3.23e-07 | 145 |
| GO:0062197 | Colorectum | AD | cellular response to chemical stress | 109/3918 | 337/18723 | 5.33e-07 | 1.95e-05 | 109 |
| GO:0034599 | Colorectum | AD | cellular response to oxidative stress | 94/3918 | 288/18723 | 2.03e-06 | 6.02e-05 | 94 |
| GO:0006520 | Colorectum | AD | cellular amino acid metabolic process | 81/3918 | 284/18723 | 1.37e-03 | 1.19e-02 | 81 |
| GO:00069791 | Colorectum | SER | response to oxidative stress | 114/2897 | 446/18723 | 1.75e-08 | 1.28e-06 | 114 |
| GO:00621971 | Colorectum | SER | cellular response to chemical stress | 87/2897 | 337/18723 | 5.33e-07 | 2.59e-05 | 87 |
| GO:00345991 | Colorectum | SER | cellular response to oxidative stress | 73/2897 | 288/18723 | 8.52e-06 | 2.86e-04 | 73 |
| GO:00065201 | Colorectum | SER | cellular amino acid metabolic process | 61/2897 | 284/18723 | 4.20e-03 | 3.41e-02 | 61 |
| GO:00069792 | Colorectum | MSS | response to oxidative stress | 128/3467 | 446/18723 | 7.65e-08 | 3.81e-06 | 128 |
| GO:00621972 | Colorectum | MSS | cellular response to chemical stress | 102/3467 | 337/18723 | 9.73e-08 | 4.71e-06 | 102 |
| GO:00345992 | Colorectum | MSS | cellular response to oxidative stress | 88/3467 | 288/18723 | 4.58e-07 | 1.77e-05 | 88 |
| GO:0046394 | Colorectum | MSS | carboxylic acid biosynthetic process | 76/3467 | 314/18723 | 6.71e-03 | 4.38e-02 | 76 |
| GO:0016053 | Colorectum | MSS | organic acid biosynthetic process | 76/3467 | 316/18723 | 7.88e-03 | 4.84e-02 | 76 |
| GO:00069793 | Colorectum | MSI-H | response to oxidative stress | 68/1319 | 446/18723 | 1.17e-09 | 1.59e-07 | 68 |
| GO:00621973 | Colorectum | MSI-H | cellular response to chemical stress | 51/1319 | 337/18723 | 1.78e-07 | 1.52e-05 | 51 |
| GO:00345993 | Colorectum | MSI-H | cellular response to oxidative stress | 43/1319 | 288/18723 | 2.31e-06 | 1.40e-04 | 43 |
| GO:1901605 | Colorectum | MSI-H | alpha-amino acid metabolic process | 26/1319 | 195/18723 | 1.26e-03 | 2.02e-02 | 26 |
| GO:0008652 | Colorectum | MSI-H | cellular amino acid biosynthetic process | 13/1319 | 76/18723 | 2.35e-03 | 3.12e-02 | 13 |
| GO:1901607 | Colorectum | MSI-H | alpha-amino acid biosynthetic process | 12/1319 | 68/18723 | 2.60e-03 | 3.41e-02 | 12 |
| GO:00463941 | Colorectum | MSI-H | carboxylic acid biosynthetic process | 36/1319 | 314/18723 | 2.68e-03 | 3.48e-02 | 36 |
| Pathway ID | Tissue | Disease Stage | Description | Gene Ratio | Bg Ratio | pvalue | p.adjust | qvalue | Count |
| hsa00330 | Colorectum | AD | Arginine and proline metabolism | 23/2092 | 50/8465 | 8.27e-04 | 5.90e-03 | 3.76e-03 | 23 |
| hsa01230 | Colorectum | AD | Biosynthesis of amino acids | 28/2092 | 75/8465 | 9.99e-03 | 3.89e-02 | 2.48e-02 | 28 |
| hsa003301 | Colorectum | AD | Arginine and proline metabolism | 23/2092 | 50/8465 | 8.27e-04 | 5.90e-03 | 3.76e-03 | 23 |
| hsa012301 | Colorectum | AD | Biosynthesis of amino acids | 28/2092 | 75/8465 | 9.99e-03 | 3.89e-02 | 2.48e-02 | 28 |
| hsa003302 | Colorectum | SER | Arginine and proline metabolism | 17/1580 | 50/8465 | 7.12e-03 | 3.77e-02 | 2.74e-02 | 17 |
| hsa012302 | Colorectum | SER | Biosynthesis of amino acids | 23/1580 | 75/8465 | 8.11e-03 | 4.14e-02 | 3.01e-02 | 23 |
| hsa003303 | Colorectum | SER | Arginine and proline metabolism | 17/1580 | 50/8465 | 7.12e-03 | 3.77e-02 | 2.74e-02 | 17 |
| hsa012303 | Colorectum | SER | Biosynthesis of amino acids | 23/1580 | 75/8465 | 8.11e-03 | 4.14e-02 | 3.01e-02 | 23 |
| hsa003304 | Colorectum | MSS | Arginine and proline metabolism | 23/1875 | 50/8465 | 1.52e-04 | 1.24e-03 | 7.61e-04 | 23 |
| hsa003305 | Colorectum | MSS | Arginine and proline metabolism | 23/1875 | 50/8465 | 1.52e-04 | 1.24e-03 | 7.61e-04 | 23 |
| hsa012306 | Esophagus | HGIN | Biosynthesis of amino acids | 21/1383 | 75/8465 | 7.38e-03 | 4.63e-02 | 3.68e-02 | 21 |
| hsa0123013 | Esophagus | HGIN | Biosynthesis of amino acids | 21/1383 | 75/8465 | 7.38e-03 | 4.63e-02 | 3.68e-02 | 21 |
| hsa0123023 | Esophagus | ESCC | Biosynthesis of amino acids | 49/4205 | 75/8465 | 4.35e-03 | 1.12e-02 | 5.74e-03 | 49 |
| hsa0123033 | Esophagus | ESCC | Biosynthesis of amino acids | 49/4205 | 75/8465 | 4.35e-03 | 1.12e-02 | 5.74e-03 | 49 |
| hsa012304 | Liver | Cirrhotic | Biosynthesis of amino acids | 35/2530 | 75/8465 | 1.54e-03 | 7.83e-03 | 4.83e-03 | 35 |
| hsa003308 | Liver | Cirrhotic | Arginine and proline metabolism | 25/2530 | 50/8465 | 2.18e-03 | 9.41e-03 | 5.80e-03 | 25 |
| hsa0123011 | Liver | Cirrhotic | Biosynthesis of amino acids | 35/2530 | 75/8465 | 1.54e-03 | 7.83e-03 | 4.83e-03 | 35 |
| hsa0033011 | Liver | Cirrhotic | Arginine and proline metabolism | 25/2530 | 50/8465 | 2.18e-03 | 9.41e-03 | 5.80e-03 | 25 |
| hsa0123021 | Liver | HCC | Biosynthesis of amino acids | 53/4020 | 75/8465 | 3.79e-05 | 2.11e-04 | 1.18e-04 | 53 |
| hsa0033021 | Liver | HCC | Arginine and proline metabolism | 33/4020 | 50/8465 | 6.28e-03 | 1.77e-02 | 9.83e-03 | 33 |
| Hugo Symbol | Variant Class | Variant Classification | dbSNP RS | HGVSc | HGVSp | HGVSp Short | SWISSPROT | BIOTYPE | SIFT | PolyPhen | Tumor Sample Barcode | Tissue | Histology | Sex | Age | Stage | Therapy Types | Drugs | Outcome |
| PYCR2 | SNV | Missense_Mutation | rs538606802 | c.427N>T | p.Val143Leu | p.V143L | Q96C36 | protein_coding | tolerated(0.31) | benign(0) | TCGA-A2-A0ET-01 | Breast | breast invasive carcinoma | Female | <65 | III/IV | Chemotherapy | cytoxan | SD |
| PYCR2 | SNV | Missense_Mutation | | c.536N>T | p.Ala179Val | p.A179V | Q96C36 | protein_coding | deleterious(0) | probably_damaging(0.969) | TCGA-AN-A0AK-01 | Breast | breast invasive carcinoma | Female | >=65 | I/II | Unknown | Unknown | SD |
| PYCR2 | SNV | Missense_Mutation | novel | c.712N>C | p.Thr238Pro | p.T238P | Q96C36 | protein_coding | deleterious(0) | probably_damaging(0.996) | TCGA-AR-A1AP-01 | Breast | breast invasive carcinoma | Female | >=65 | I/II | Hormone Therapy | anastrozole | SD |
| PYCR2 | SNV | Missense_Mutation | novel | c.712N>C | p.Thr238Pro | p.T238P | Q96C36 | protein_coding | deleterious(0) | probably_damaging(0.996) | TCGA-D8-A1X6-01 | Breast | breast invasive carcinoma | Female | >=65 | III/IV | Hormone Therapy | tamoxiphen | SD |
| PYCR2 | SNV | Missense_Mutation | rs754486659 | c.287N>T | p.Ala96Val | p.A96V | Q96C36 | protein_coding | deleterious(0.02) | probably_damaging(0.996) | TCGA-A5-A0G2-01 | Endometrium | uterine corpus endometrioid carcinoma | Female | <65 | III/IV | Unknown | Unknown | SD |
| PYCR2 | SNV | Missense_Mutation | novel | c.868N>A | p.Val290Met | p.V290M | Q96C36 | protein_coding | tolerated_low_confidence(0.05) | benign(0.188) | TCGA-AJ-A2QN-01 | Endometrium | uterine corpus endometrioid carcinoma | Female | <65 | I/II | Unknown | Unknown | SD |
| PYCR2 | SNV | Missense_Mutation | novel | c.268N>T | p.His90Tyr | p.H90Y | Q96C36 | protein_coding | deleterious(0) | probably_damaging(0.998) | TCGA-AJ-A3BG-01 | Endometrium | uterine corpus endometrioid carcinoma | Female | >=65 | I/II | Chemotherapy | carboplatin | PD |
| PYCR2 | SNV | Missense_Mutation | | c.142A>G | p.Met48Val | p.M48V | Q96C36 | protein_coding | tolerated(0.1) | benign(0.001) | TCGA-AP-A056-01 | Endometrium | uterine corpus endometrioid carcinoma | Female | <65 | I/II | Unknown | Unknown | SD |
| PYCR2 | SNV | Missense_Mutation | | c.394N>A | p.Ala132Thr | p.A132T | Q96C36 | protein_coding | deleterious(0.01) | possibly_damaging(0.696) | TCGA-AP-A0LM-01 | Endometrium | uterine corpus endometrioid carcinoma | Female | <65 | III/IV | Chemotherapy | cisplatin | SD |
| PYCR2 | SNV | Missense_Mutation | novel | c.742N>A | p.Gly248Arg | p.G248R | Q96C36 | protein_coding | deleterious(0.04) | possibly_damaging(0.621) | TCGA-AP-A1DK-01 | Endometrium | uterine corpus endometrioid carcinoma | Female | <65 | I/II | Unknown | Unknown | SD |


