
|
|||||
|
 | |
| |
| |
| |
| |
| |
|
Gene: PXYLP1 |
Gene summary for PXYLP1 |
| Gene information | Species | Human | Gene symbol | PXYLP1 | Gene ID | 92370 |
| Gene name | 2-phosphoxylose phosphatase 1 | |
| Gene Alias | ACPL2 | |
| Cytomap | 3q23 | |
| Gene Type | protein-coding | GO ID | GO:0006022 | UniProtAcc | Q8TE99 |
Top |
Malignant transformation analysis |
| Identification of the aberrant gene expression in precancerous and cancerous lesions by comparing the gene expression of stem-like cells in diseased tissues with normal stem cells |
| Entrez ID | Symbol | Replicates | Species | Organ | Tissue | Adj P-value | Log2FC | Malignancy |
| 92370 | PXYLP1 | LZE4T | Human | Esophagus | ESCC | 4.95e-02 | 1.83e-01 | 0.0811 |
| 92370 | PXYLP1 | LZE22T | Human | Esophagus | ESCC | 1.29e-04 | 3.26e-01 | 0.068 |
| 92370 | PXYLP1 | LZE24T | Human | Esophagus | ESCC | 1.06e-06 | 1.75e-01 | 0.0596 |
| 92370 | PXYLP1 | LZE6T | Human | Esophagus | ESCC | 7.46e-05 | 3.87e-01 | 0.0845 |
| 92370 | PXYLP1 | P2T-E | Human | Esophagus | ESCC | 1.80e-47 | 6.49e-01 | 0.1177 |
| 92370 | PXYLP1 | P4T-E | Human | Esophagus | ESCC | 9.43e-12 | 2.88e-01 | 0.1323 |
| 92370 | PXYLP1 | P5T-E | Human | Esophagus | ESCC | 2.06e-08 | 1.62e-01 | 0.1327 |
| 92370 | PXYLP1 | P8T-E | Human | Esophagus | ESCC | 1.13e-16 | 3.09e-01 | 0.0889 |
| 92370 | PXYLP1 | P9T-E | Human | Esophagus | ESCC | 7.96e-08 | 2.11e-01 | 0.1131 |
| 92370 | PXYLP1 | P10T-E | Human | Esophagus | ESCC | 5.04e-45 | 7.89e-01 | 0.116 |
| 92370 | PXYLP1 | P11T-E | Human | Esophagus | ESCC | 5.54e-04 | 2.12e-01 | 0.1426 |
| 92370 | PXYLP1 | P12T-E | Human | Esophagus | ESCC | 1.08e-25 | 3.64e-01 | 0.1122 |
| 92370 | PXYLP1 | P15T-E | Human | Esophagus | ESCC | 1.44e-04 | 1.53e-01 | 0.1149 |
| 92370 | PXYLP1 | P16T-E | Human | Esophagus | ESCC | 1.12e-12 | 3.23e-01 | 0.1153 |
| 92370 | PXYLP1 | P22T-E | Human | Esophagus | ESCC | 5.30e-21 | 3.65e-01 | 0.1236 |
| 92370 | PXYLP1 | P23T-E | Human | Esophagus | ESCC | 9.94e-13 | 3.59e-01 | 0.108 |
| 92370 | PXYLP1 | P24T-E | Human | Esophagus | ESCC | 2.05e-07 | 1.59e-01 | 0.1287 |
| 92370 | PXYLP1 | P26T-E | Human | Esophagus | ESCC | 2.39e-24 | 4.19e-01 | 0.1276 |
| 92370 | PXYLP1 | P27T-E | Human | Esophagus | ESCC | 1.26e-12 | 3.01e-01 | 0.1055 |
| 92370 | PXYLP1 | P28T-E | Human | Esophagus | ESCC | 2.93e-15 | 2.89e-01 | 0.1149 |
| Page: 1 2 3 |
| Tissue | Expression Dynamics | Abbreviation |
| Esophagus | 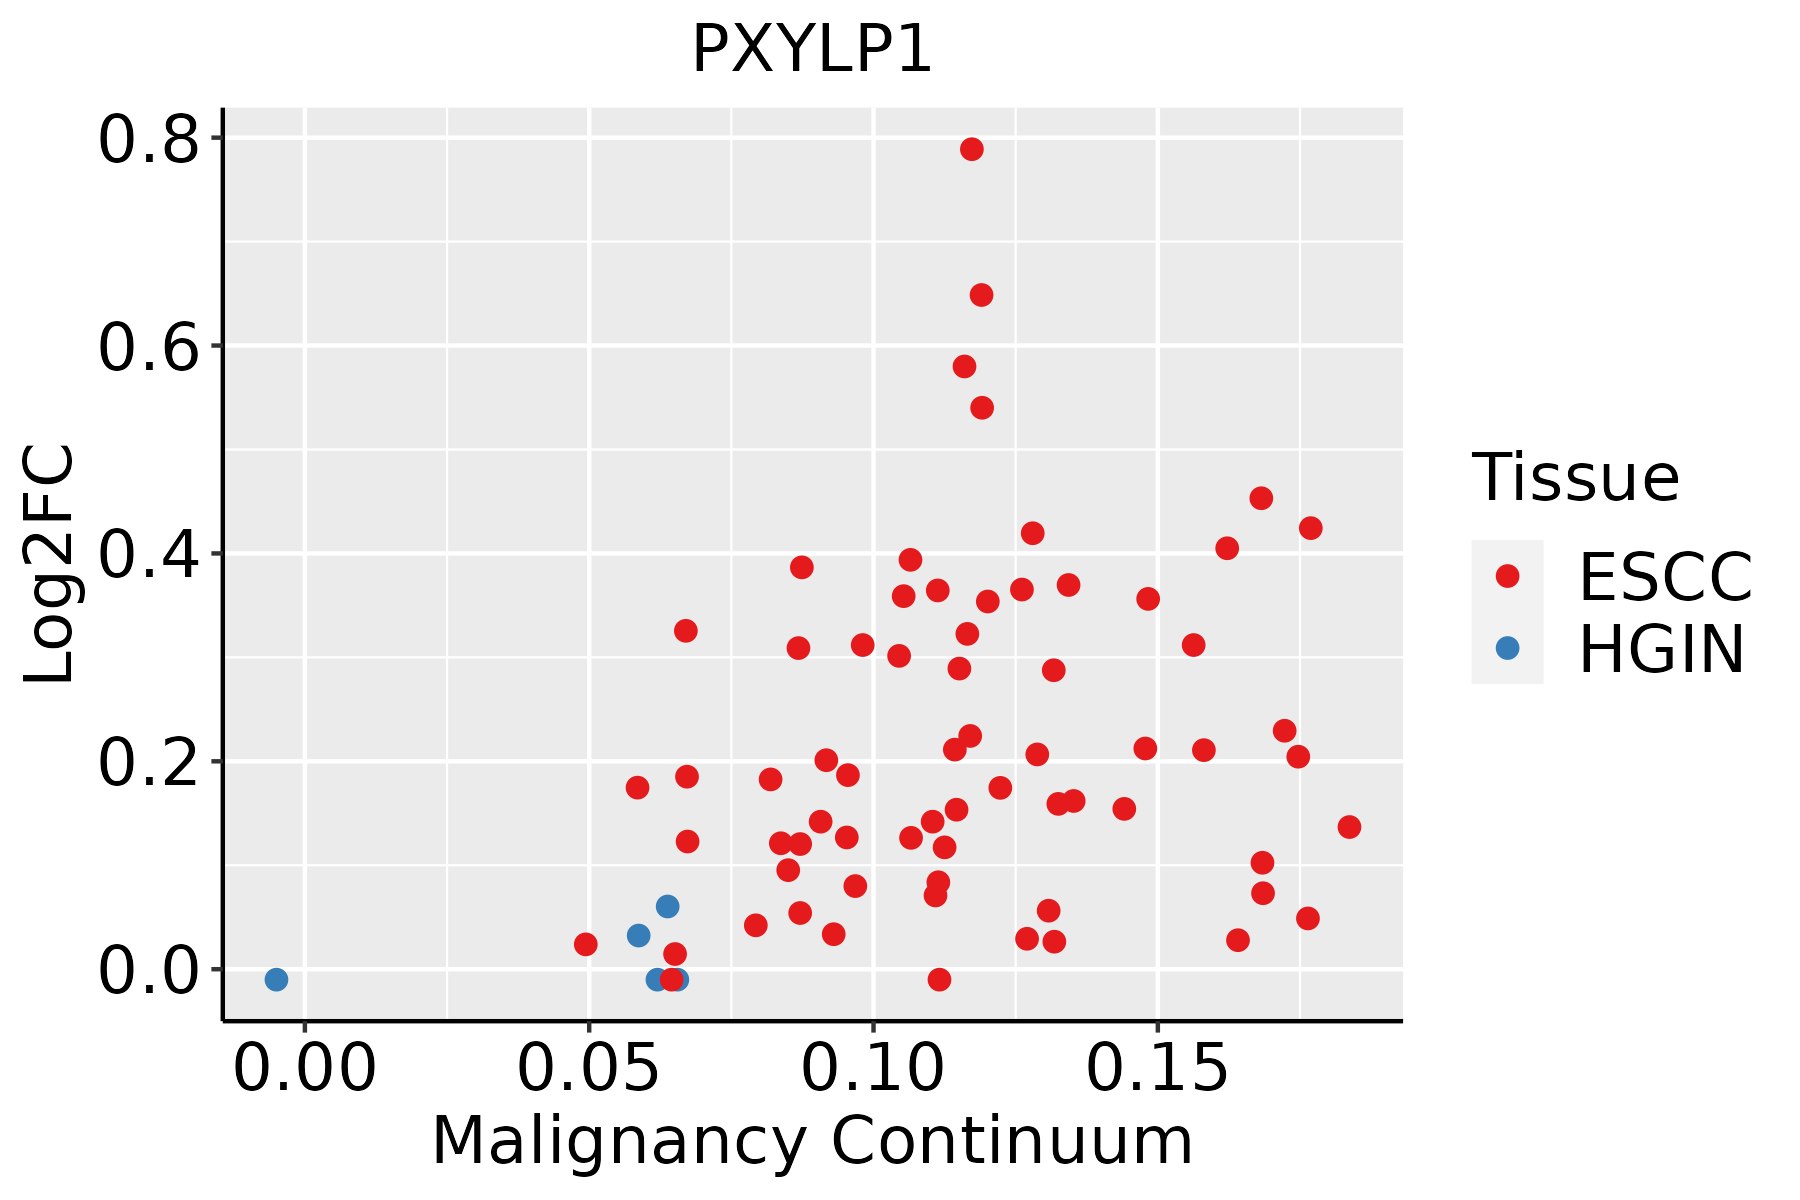 | ESCC: Esophageal squamous cell carcinoma |
| HGIN: High-grade intraepithelial neoplasias | ||
| LGIN: Low-grade intraepithelial neoplasias |
| ∗log2FC in expression of this searched gene in stem-like cells from each diseased tissue sample relative to stem-like cells in normal samples in each tissue plotted against the malignancy continuum. Samples are colored based on if they are from different disease stage. |
Top |
Malignant transformation related pathway analysis |
| Find out the enriched GO biological processes and KEGG pathways involved in transition from healthy to precancer to cancer |
| Tissue | Disease Stage | Enriched GO biological Processes |
| Colorectum | AD |  |
| Colorectum | SER |  |
| Colorectum | MSS |  |
| Colorectum | MSI-H |  |
| Colorectum | FAP |  |
| ∗Top 15 enriched GO BP terms are showed in the bar plot of each disease state in each tissue. Each row represents a significant GO biological process which is colored according to the -log10(p.adjust). |
| Page: 1 2 3 4 5 6 7 8 9 |
| GO ID | Tissue | Disease Stage | Description | Gene Ratio | Bg Ratio | pvalue | p.adjust | Count |
| GO:001631110 | Esophagus | ESCC | dephosphorylation | 251/8552 | 417/18723 | 1.26e-09 | 2.99e-08 | 251 |
| GO:00091002 | Esophagus | ESCC | glycoprotein metabolic process | 226/8552 | 387/18723 | 2.64e-07 | 3.94e-06 | 226 |
| GO:00091012 | Esophagus | ESCC | glycoprotein biosynthetic process | 181/8552 | 317/18723 | 2.54e-05 | 2.15e-04 | 181 |
| GO:0006029 | Esophagus | ESCC | proteoglycan metabolic process | 48/8552 | 79/18723 | 4.93e-03 | 1.89e-02 | 48 |
| GO:0030166 | Esophagus | ESCC | proteoglycan biosynthetic process | 35/8552 | 56/18723 | 8.30e-03 | 2.94e-02 | 35 |
| GO:0006024 | Esophagus | ESCC | glycosaminoglycan biosynthetic process | 45/8552 | 75/18723 | 8.75e-03 | 3.08e-02 | 45 |
| GO:0006023 | Esophagus | ESCC | aminoglycan biosynthetic process | 47/8552 | 79/18723 | 9.29e-03 | 3.23e-02 | 47 |
| GO:0030201 | Esophagus | ESCC | heparan sulfate proteoglycan metabolic process | 21/8552 | 31/18723 | 1.10e-02 | 3.70e-02 | 21 |
| Page: 1 |
| Pathway ID | Tissue | Disease Stage | Description | Gene Ratio | Bg Ratio | pvalue | p.adjust | qvalue | Count |
| Page: 1 |
Top |
Cell-cell communication analysis |
| Identification of potential cell-cell interactions between two cell types and their ligand-receptor pairs for different disease states |
| Ligand | Receptor | LRpair | Pathway | Tissue | Disease Stage |
| Page: 1 |
Top |
Single-cell gene regulatory network inference analysis |
| Find out the significant the regulons (TFs) and the target genes of each regulon across cell types for different disease states |
| TF | Cell Type | Tissue | Disease Stage | Target Gene | RSS | Regulon Activity |
| ∗The dot plots of a searched regulon are shown for all cell subpopulations in each disease state of each tissue based on the regulon specific score inferred using pySCENIC and by calculating the average expression. |
| Page: 1 |
Top |
Somatic mutation of malignant transformation related genes |
| Annotation of somatic variants for genes involved in malignant transformation |
| Hugo Symbol | Variant Class | Variant Classification | dbSNP RS | HGVSc | HGVSp | HGVSp Short | SWISSPROT | BIOTYPE | SIFT | PolyPhen | Tumor Sample Barcode | Tissue | Histology | Sex | Age | Stage | Therapy Types | Drugs | Outcome |
| PXYLP1 | SNV | Missense_Mutation | c.14N>G | p.Asn5Ser | p.N5S | Q8TE99 | protein_coding | tolerated_low_confidence(0.08) | benign(0) | TCGA-AO-A128-01 | Breast | breast invasive carcinoma | Female | <65 | I/II | Chemotherapy | doxorubicin | SD | |
| PXYLP1 | SNV | Missense_Mutation | c.130N>G | p.Arg44Gly | p.R44G | Q8TE99 | protein_coding | deleterious_low_confidence(0) | probably_damaging(0.995) | TCGA-D8-A147-01 | Breast | breast invasive carcinoma | Female | <65 | I/II | Chemotherapy | doxorubicine | SD | |
| PXYLP1 | SNV | Missense_Mutation | c.117N>C | p.Met39Ile | p.M39I | Q8TE99 | protein_coding | tolerated_low_confidence(0.41) | benign(0) | TCGA-D8-A27G-01 | Breast | breast invasive carcinoma | Female | >=65 | I/II | Unknown | Unknown | SD | |
| PXYLP1 | insertion | Frame_Shift_Ins | novel | c.66_67insGTGCTTTTCGTAGTACAGCTTATTGAGATAGG | p.Ser23ValfsTer18 | p.S23Vfs*18 | Q8TE99 | protein_coding | TCGA-A8-A07J-01 | Breast | breast invasive carcinoma | Female | <65 | I/II | Chemotherapy | 5-fluorouracil | CR | ||
| PXYLP1 | deletion | Frame_Shift_Del | novel | c.1067delN | p.Ile357SerfsTer47 | p.I357Sfs*47 | Q8TE99 | protein_coding | TCGA-AR-A5QN-01 | Breast | breast invasive carcinoma | Female | >=65 | III/IV | Chemotherapy | taxotere | SD | ||
| PXYLP1 | SNV | Missense_Mutation | novel | c.912N>A | p.His304Gln | p.H304Q | Q8TE99 | protein_coding | deleterious(0) | probably_damaging(0.999) | TCGA-C5-A901-01 | Cervix | cervical & endocervical cancer | Female | <65 | I/II | Unknown | Unknown | SD |
| PXYLP1 | SNV | Missense_Mutation | rs142753948 | c.1093N>A | p.Glu365Lys | p.E365K | Q8TE99 | protein_coding | tolerated(0.61) | benign(0.005) | TCGA-Q1-A73Q-01 | Cervix | cervical & endocervical cancer | Female | <65 | I/II | Chemotherapy | cisplatin | SD |
| PXYLP1 | SNV | Missense_Mutation | rs745590323 | c.625N>T | p.Arg209Trp | p.R209W | Q8TE99 | protein_coding | deleterious(0) | probably_damaging(1) | TCGA-VS-A9UJ-01 | Cervix | cervical & endocervical cancer | Female | <65 | I/II | Unknown | Unknown | PD |
| PXYLP1 | SNV | Missense_Mutation | novel | c.490N>C | p.Glu164Gln | p.E164Q | Q8TE99 | protein_coding | tolerated(0.22) | possibly_damaging(0.862) | TCGA-ZJ-AAXU-01 | Cervix | cervical & endocervical cancer | Female | <65 | I/II | Unknown | Unknown | SD |
| PXYLP1 | SNV | Missense_Mutation | c.773A>G | p.Gln258Arg | p.Q258R | Q8TE99 | protein_coding | deleterious(0) | probably_damaging(0.948) | TCGA-AA-3672-01 | Colorectum | colon adenocarcinoma | Female | >=65 | III/IV | Unknown | Unknown | SD |
| Page: 1 2 3 4 |
Top |
Related drugs of malignant transformation related genes |
| Identification of chemicals and drugs interact with genes involved in malignant transfromation |
| (DGIdb 4.0) |
| Entrez ID | Symbol | Category | Interaction Types | Drug Claim Name | Drug Name | PMIDs |
| Page: 1 |

Copyright 2023-Present -The University of Texas Health Science Center at Houston |