
|
|||||
|
 | |
| |
| |
| |
| |
| |
|
Gene: PXN |
Gene summary for PXN |
| Gene information | Species | Human | Gene symbol | PXN | Gene ID | 5829 |
| Gene name | paxillin | |
| Gene Alias | PXN | |
| Cytomap | 12q24.23 | |
| Gene Type | protein-coding | GO ID | GO:0000302 | UniProtAcc | A0A140VJQ8 |
Top |
Malignant transformation analysis |
| Identification of the aberrant gene expression in precancerous and cancerous lesions by comparing the gene expression of stem-like cells in diseased tissues with normal stem cells |
| Entrez ID | Symbol | Replicates | Species | Organ | Tissue | Adj P-value | Log2FC | Malignancy |
| 5829 | PXN | HTA11_2487_2000001011 | Human | Colorectum | SER | 7.83e-03 | 3.82e-01 | -0.1808 |
| 5829 | PXN | HTA11_78_2000001011 | Human | Colorectum | AD | 3.93e-03 | 3.77e-01 | -0.1088 |
| 5829 | PXN | HTA11_347_2000001011 | Human | Colorectum | AD | 3.51e-14 | 5.84e-01 | -0.1954 |
| 5829 | PXN | HTA11_696_2000001011 | Human | Colorectum | AD | 7.69e-04 | 3.13e-01 | -0.1464 |
| 5829 | PXN | HTA11_866_2000001011 | Human | Colorectum | AD | 1.05e-02 | 2.92e-01 | -0.1001 |
| 5829 | PXN | A015-C-203 | Human | Colorectum | FAP | 4.49e-04 | -9.19e-02 | -0.1294 |
| 5829 | PXN | A002-C-205 | Human | Colorectum | FAP | 2.26e-05 | -2.33e-01 | -0.1236 |
| 5829 | PXN | A015-C-104 | Human | Colorectum | FAP | 4.73e-06 | -1.07e-01 | -0.1899 |
| 5829 | PXN | A002-C-016 | Human | Colorectum | FAP | 8.81e-06 | -1.80e-01 | 0.0521 |
| 5829 | PXN | A002-C-116 | Human | Colorectum | FAP | 3.78e-11 | -2.04e-01 | -0.0452 |
| 5829 | PXN | F034 | Human | Colorectum | FAP | 2.87e-05 | -1.85e-01 | -0.0665 |
| 5829 | PXN | F072B | Human | Colorectum | FAP | 2.94e-03 | -1.77e-01 | 0.257 |
| 5829 | PXN | LZE4T | Human | Esophagus | ESCC | 4.28e-08 | -1.01e-01 | 0.0811 |
| 5829 | PXN | LZE7T | Human | Esophagus | ESCC | 2.23e-04 | -9.42e-03 | 0.0667 |
| 5829 | PXN | LZE8T | Human | Esophagus | ESCC | 8.23e-05 | 2.36e-02 | 0.067 |
| 5829 | PXN | LZE20T | Human | Esophagus | ESCC | 4.81e-04 | -8.51e-02 | 0.0662 |
| 5829 | PXN | LZE22D1 | Human | Esophagus | HGIN | 6.59e-03 | -9.25e-02 | 0.0595 |
| 5829 | PXN | LZE24T | Human | Esophagus | ESCC | 9.31e-10 | 1.76e-02 | 0.0596 |
| 5829 | PXN | LZE6T | Human | Esophagus | ESCC | 3.02e-02 | 1.31e-01 | 0.0845 |
| 5829 | PXN | P2T-E | Human | Esophagus | ESCC | 1.24e-25 | 5.04e-01 | 0.1177 |
| Page: 1 2 3 4 5 6 |
| Tissue | Expression Dynamics | Abbreviation |
| Colorectum (GSE201348) |  | FAP: Familial adenomatous polyposis |
| CRC: Colorectal cancer | ||
| Colorectum (HTA11) |  | AD: Adenomas |
| SER: Sessile serrated lesions | ||
| MSI-H: Microsatellite-high colorectal cancer | ||
| MSS: Microsatellite stable colorectal cancer | ||
| Esophagus | 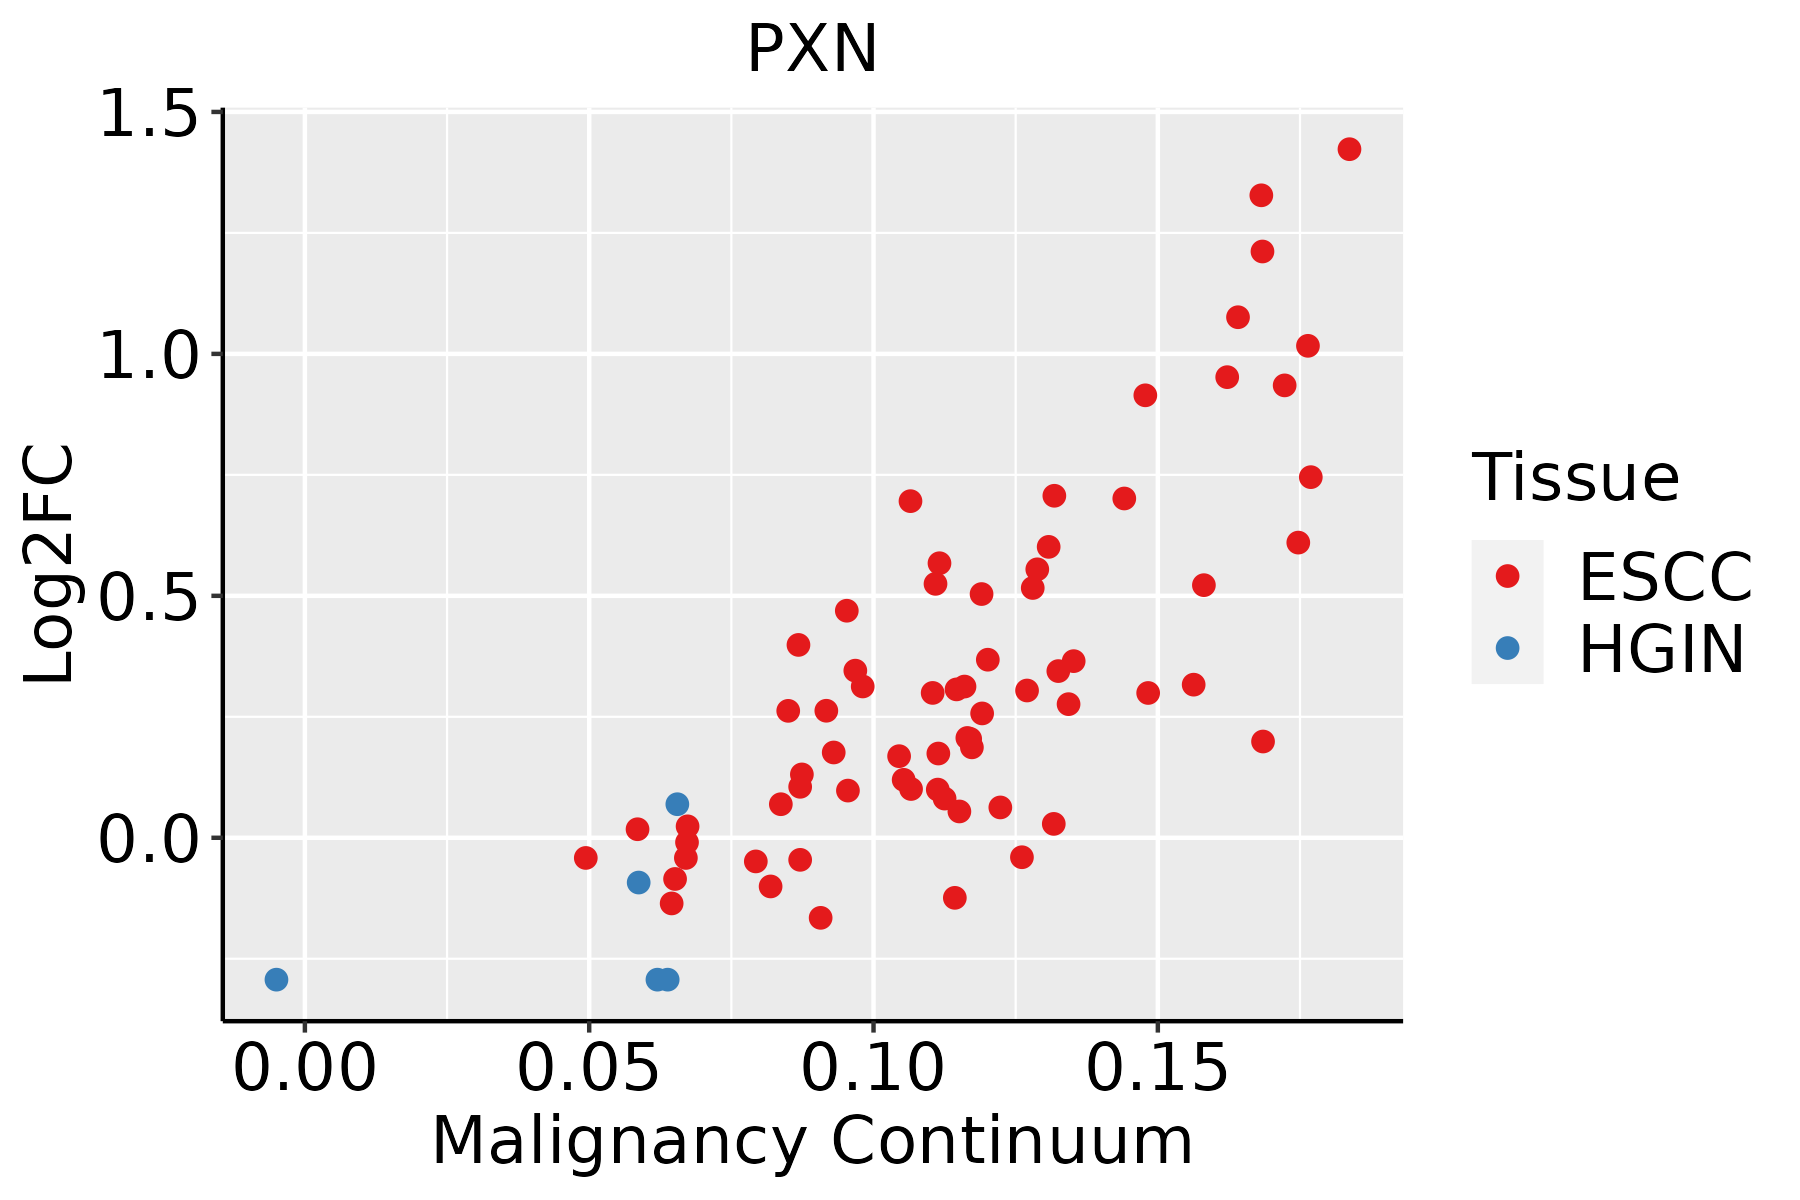 | ESCC: Esophageal squamous cell carcinoma |
| HGIN: High-grade intraepithelial neoplasias | ||
| LGIN: Low-grade intraepithelial neoplasias | ||
| Liver | 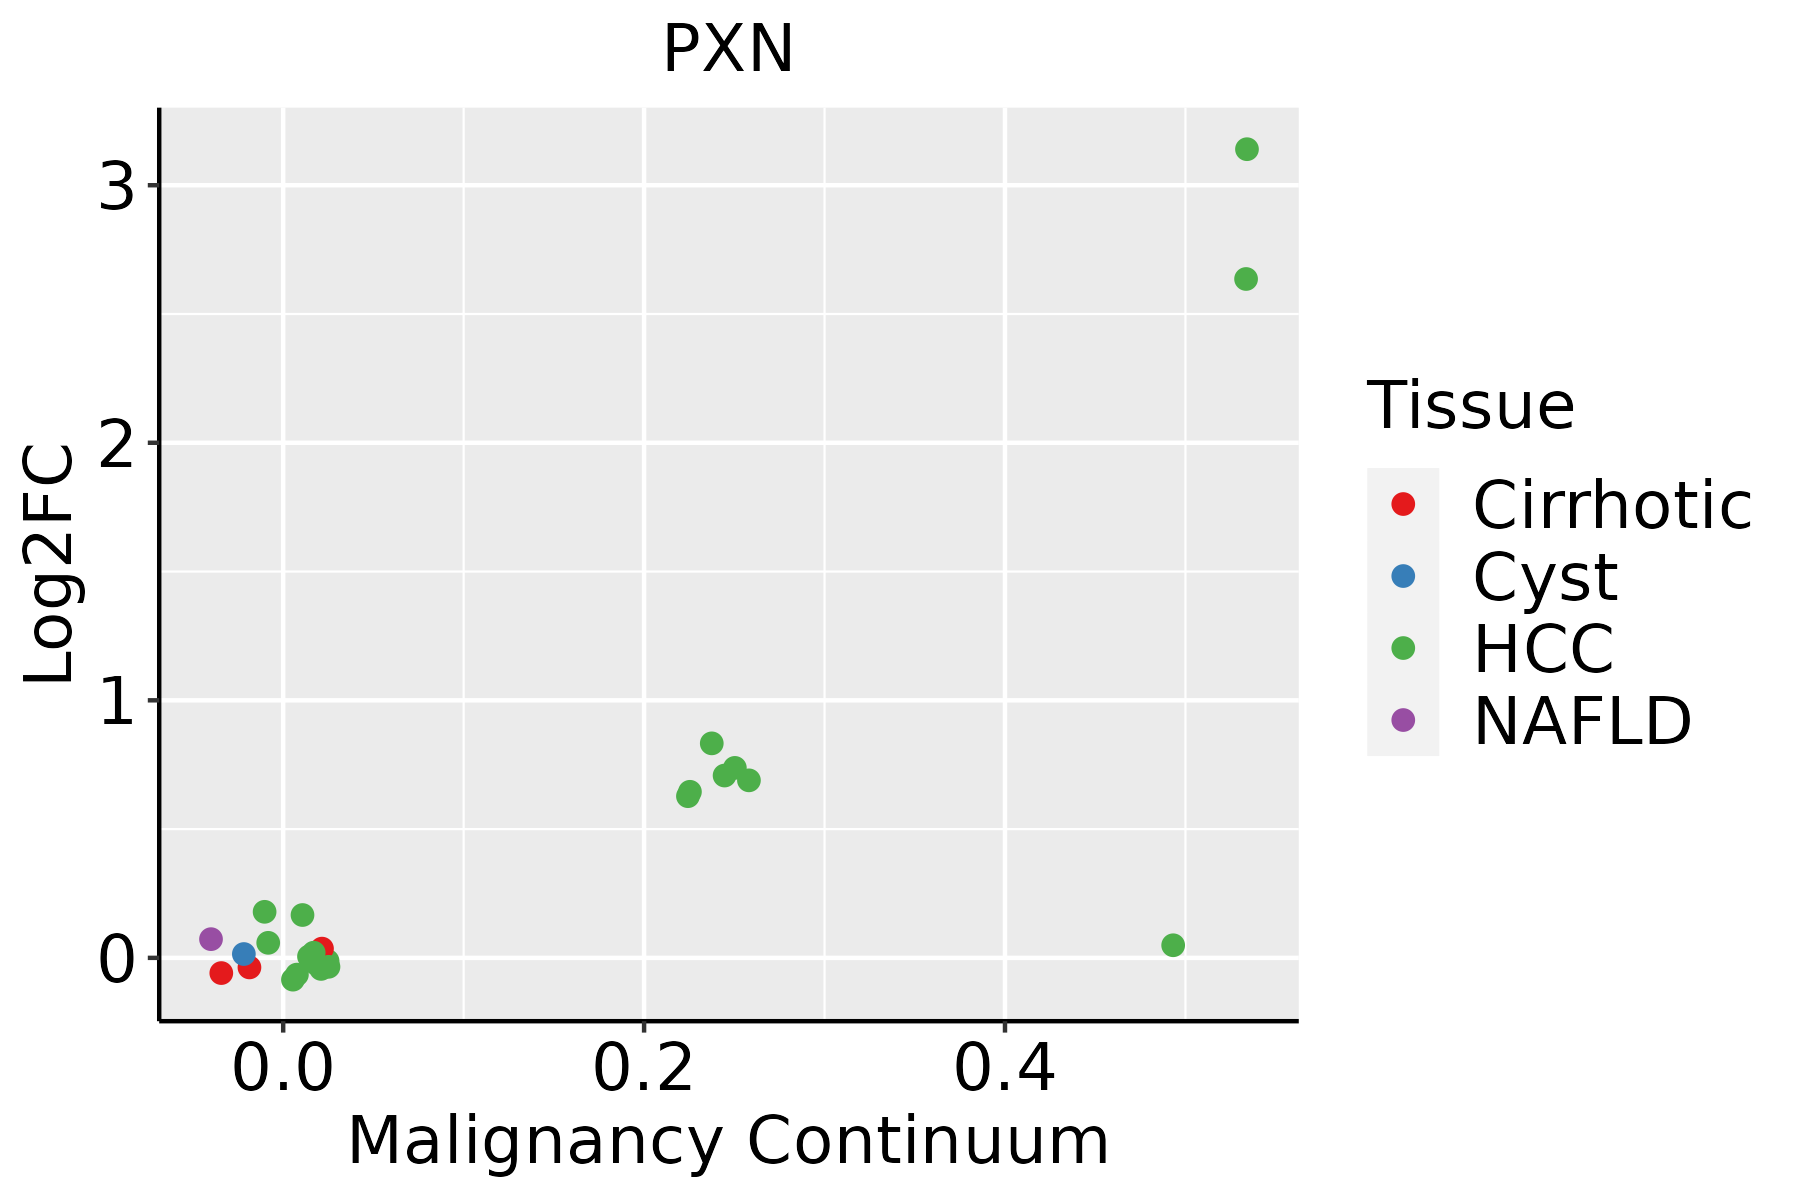 | HCC: Hepatocellular carcinoma |
| NAFLD: Non-alcoholic fatty liver disease | ||
| Oral Cavity | 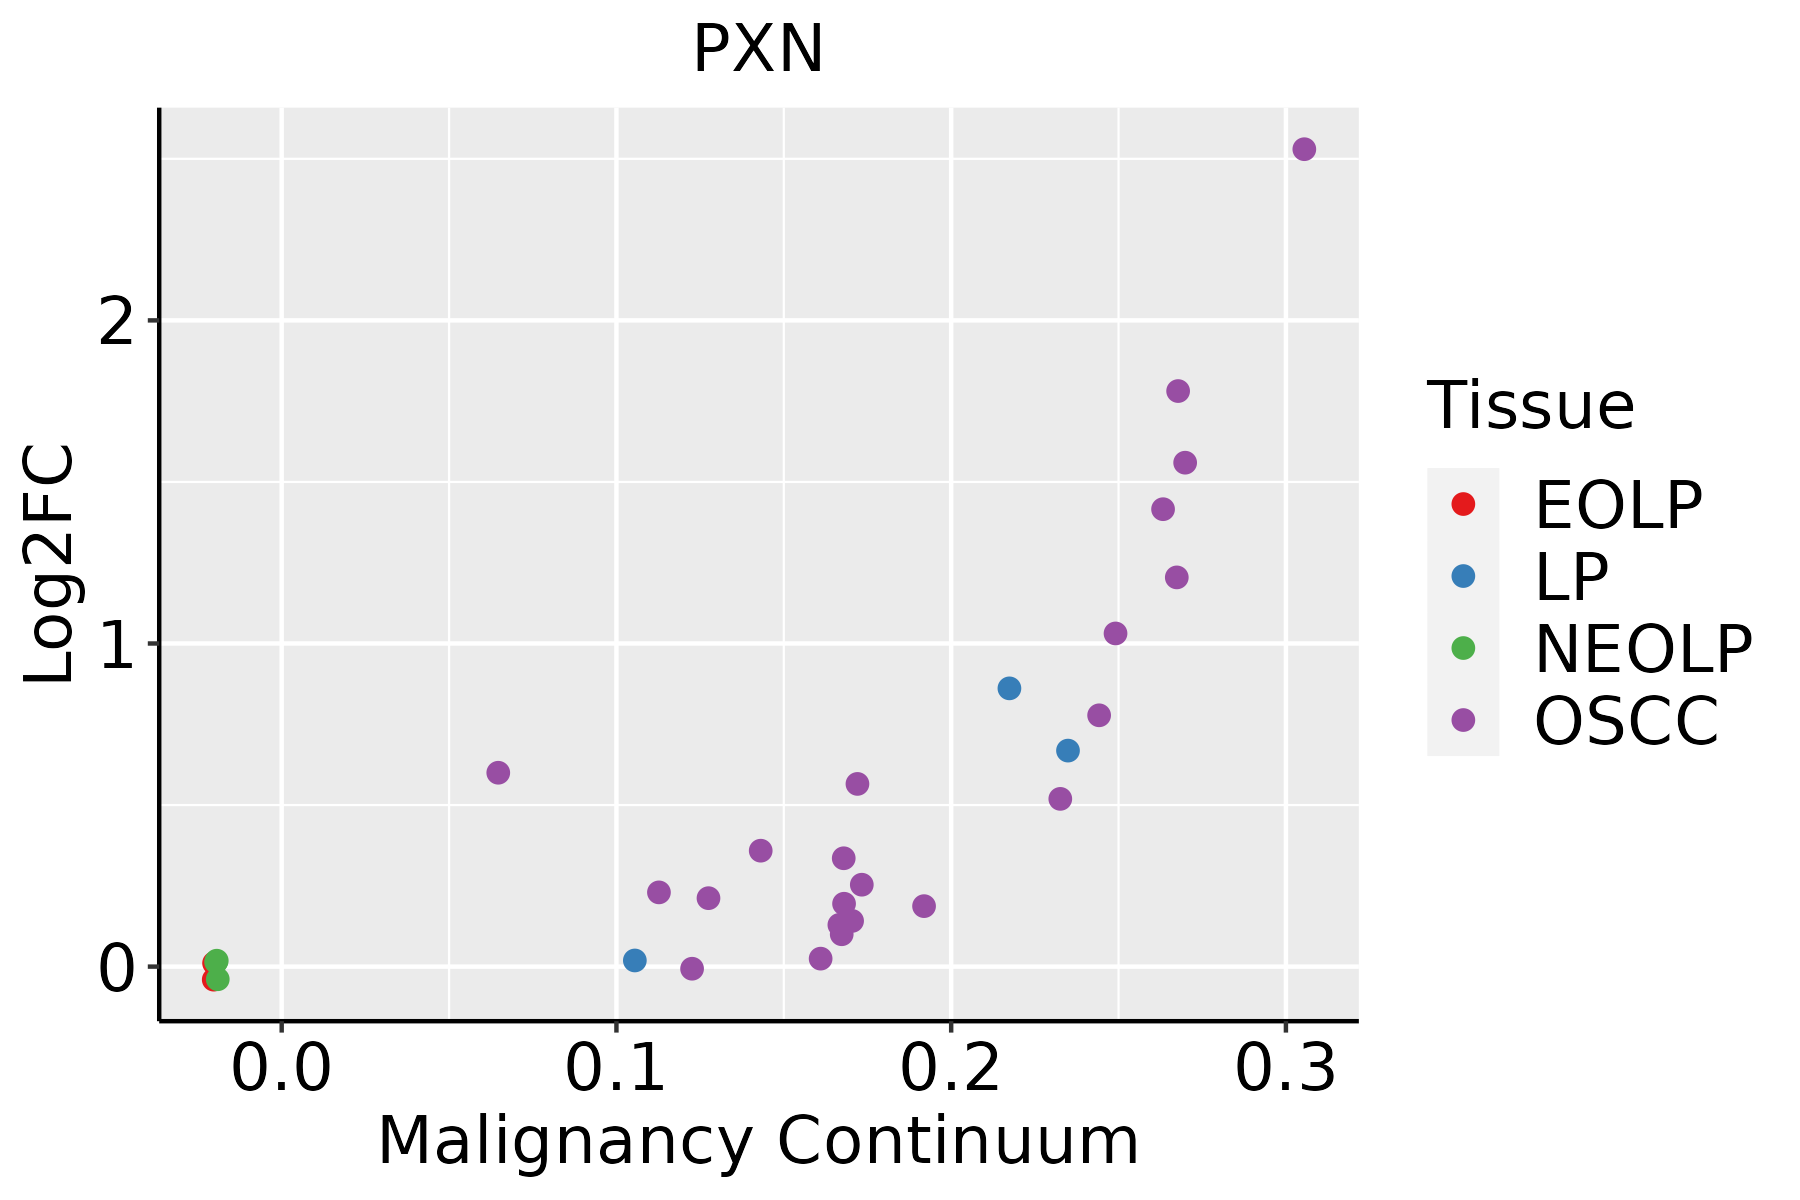 | EOLP: Erosive Oral lichen planus |
| LP: leukoplakia | ||
| NEOLP: Non-erosive oral lichen planus | ||
| OSCC: Oral squamous cell carcinoma | ||
| Skin |  | AK: Actinic keratosis |
| cSCC: Cutaneous squamous cell carcinoma | ||
| SCCIS:squamous cell carcinoma in situ | ||
| Thyroid | 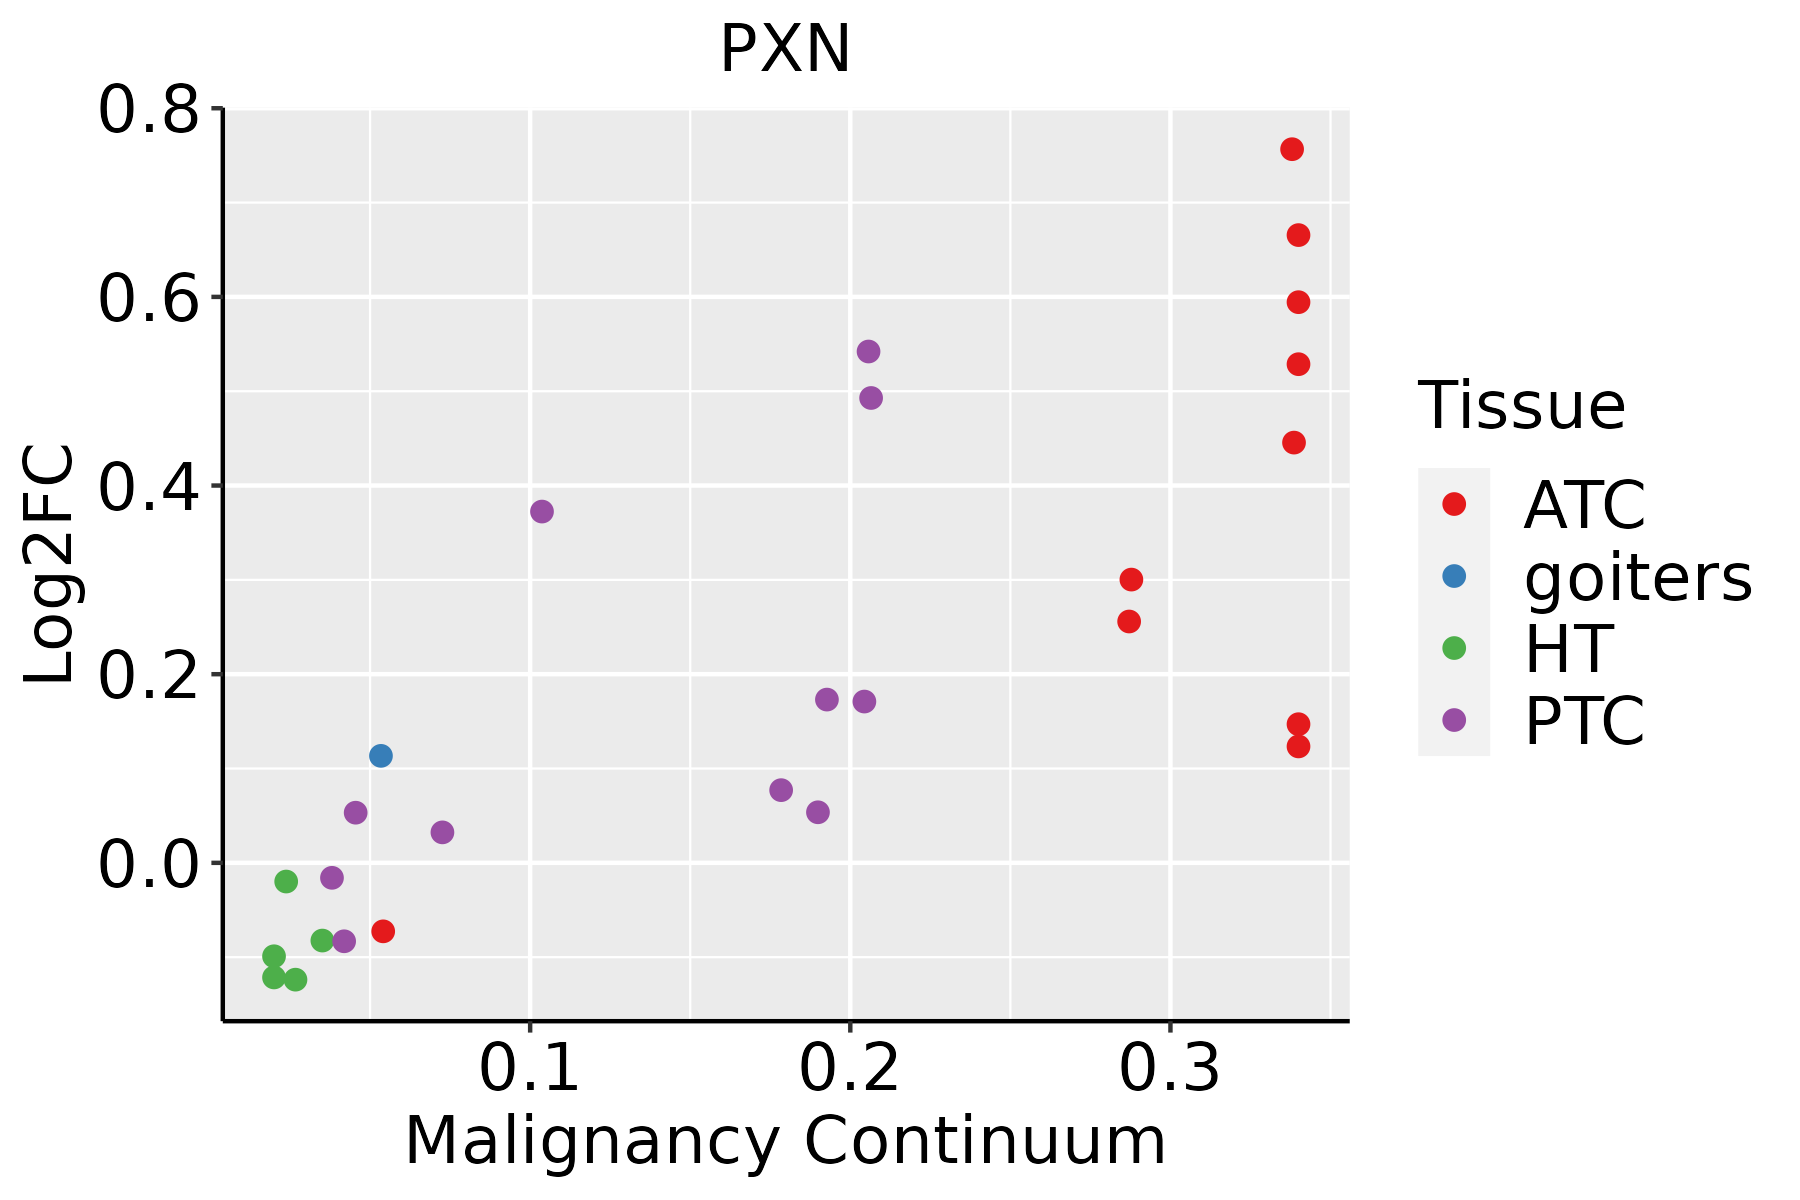 | ATC: Anaplastic thyroid cancer |
| HT: Hashimoto's thyroiditis | ||
| PTC: Papillary thyroid cancer |
| ∗log2FC in expression of this searched gene in stem-like cells from each diseased tissue sample relative to stem-like cells in normal samples in each tissue plotted against the malignancy continuum. Samples are colored based on if they are from different disease stage. |
Top |
Malignant transformation related pathway analysis |
| Find out the enriched GO biological processes and KEGG pathways involved in transition from healthy to precancer to cancer |
| Tissue | Disease Stage | Enriched GO biological Processes |
| Colorectum | AD |  |
| Colorectum | SER |  |
| Colorectum | MSS |  |
| Colorectum | MSI-H |  |
| Colorectum | FAP |  |
| ∗Top 15 enriched GO BP terms are showed in the bar plot of each disease state in each tissue. Each row represents a significant GO biological process which is colored according to the -log10(p.adjust). |
| Page: 1 2 3 4 5 6 7 8 9 |
| GO ID | Tissue | Disease Stage | Description | Gene Ratio | Bg Ratio | pvalue | p.adjust | Count |
| GO:0007015 | Colorectum | AD | actin filament organization | 167/3918 | 442/18723 | 1.65e-16 | 7.94e-14 | 167 |
| GO:1902903 | Colorectum | AD | regulation of supramolecular fiber organization | 139/3918 | 383/18723 | 2.01e-12 | 3.19e-10 | 139 |
| GO:0032970 | Colorectum | AD | regulation of actin filament-based process | 142/3918 | 397/18723 | 4.05e-12 | 5.90e-10 | 142 |
| GO:0110053 | Colorectum | AD | regulation of actin filament organization | 108/3918 | 278/18723 | 5.02e-12 | 6.98e-10 | 108 |
| GO:1902905 | Colorectum | AD | positive regulation of supramolecular fiber organization | 85/3918 | 209/18723 | 5.95e-11 | 6.33e-09 | 85 |
| GO:0032956 | Colorectum | AD | regulation of actin cytoskeleton organization | 127/3918 | 358/18723 | 1.03e-10 | 1.04e-08 | 127 |
| GO:0051495 | Colorectum | AD | positive regulation of cytoskeleton organization | 89/3918 | 226/18723 | 1.61e-10 | 1.56e-08 | 89 |
| GO:0006979 | Colorectum | AD | response to oxidative stress | 145/3918 | 446/18723 | 5.16e-09 | 3.23e-07 | 145 |
| GO:0031589 | Colorectum | AD | cell-substrate adhesion | 116/3918 | 363/18723 | 4.68e-07 | 1.76e-05 | 116 |
| GO:0062197 | Colorectum | AD | cellular response to chemical stress | 109/3918 | 337/18723 | 5.33e-07 | 1.95e-05 | 109 |
| GO:0000302 | Colorectum | AD | response to reactive oxygen species | 78/3918 | 222/18723 | 6.17e-07 | 2.21e-05 | 78 |
| GO:1901653 | Colorectum | AD | cellular response to peptide | 114/3918 | 359/18723 | 8.32e-07 | 2.88e-05 | 114 |
| GO:0061572 | Colorectum | AD | actin filament bundle organization | 60/3918 | 161/18723 | 1.33e-06 | 4.23e-05 | 60 |
| GO:0071375 | Colorectum | AD | cellular response to peptide hormone stimulus | 95/3918 | 290/18723 | 1.50e-06 | 4.66e-05 | 95 |
| GO:0034599 | Colorectum | AD | cellular response to oxidative stress | 94/3918 | 288/18723 | 2.03e-06 | 6.02e-05 | 94 |
| GO:0043434 | Colorectum | AD | response to peptide hormone | 126/3918 | 414/18723 | 2.70e-06 | 7.86e-05 | 126 |
| GO:0051017 | Colorectum | AD | actin filament bundle assembly | 58/3918 | 157/18723 | 2.74e-06 | 7.89e-05 | 58 |
| GO:0001667 | Colorectum | AD | ameboidal-type cell migration | 137/3918 | 475/18723 | 2.17e-05 | 4.33e-04 | 137 |
| GO:0007160 | Colorectum | AD | cell-matrix adhesion | 75/3918 | 233/18723 | 3.56e-05 | 6.45e-04 | 75 |
| GO:0031032 | Colorectum | AD | actomyosin structure organization | 65/3918 | 196/18723 | 4.17e-05 | 7.37e-04 | 65 |
| Page: 1 2 3 4 5 6 7 8 9 10 11 12 13 14 15 16 17 |
| Pathway ID | Tissue | Disease Stage | Description | Gene Ratio | Bg Ratio | pvalue | p.adjust | qvalue | Count |
| hsa05131 | Colorectum | AD | Shigellosis | 109/2092 | 247/8465 | 1.09e-11 | 2.44e-10 | 1.55e-10 | 109 |
| hsa05100 | Colorectum | AD | Bacterial invasion of epithelial cells | 44/2092 | 77/8465 | 1.13e-09 | 2.22e-08 | 1.42e-08 | 44 |
| hsa05135 | Colorectum | AD | Yersinia infection | 58/2092 | 137/8465 | 3.90e-06 | 4.35e-05 | 2.78e-05 | 58 |
| hsa05205 | Colorectum | AD | Proteoglycans in cancer | 70/2092 | 205/8465 | 1.37e-03 | 8.46e-03 | 5.39e-03 | 70 |
| hsa05170 | Colorectum | AD | Human immunodeficiency virus 1 infection | 72/2092 | 212/8465 | 1.40e-03 | 8.46e-03 | 5.39e-03 | 72 |
| hsa05163 | Colorectum | AD | Human cytomegalovirus infection | 75/2092 | 225/8465 | 2.00e-03 | 1.10e-02 | 7.01e-03 | 75 |
| hsa04810 | Colorectum | AD | Regulation of actin cytoskeleton | 75/2092 | 229/8465 | 3.36e-03 | 1.76e-02 | 1.12e-02 | 75 |
| hsa04510 | Colorectum | AD | Focal adhesion | 67/2092 | 203/8465 | 4.40e-03 | 2.17e-02 | 1.38e-02 | 67 |
| hsa04670 | Colorectum | AD | Leukocyte transendothelial migration | 41/2092 | 114/8465 | 4.60e-03 | 2.20e-02 | 1.40e-02 | 41 |
| hsa051311 | Colorectum | AD | Shigellosis | 109/2092 | 247/8465 | 1.09e-11 | 2.44e-10 | 1.55e-10 | 109 |
| hsa051001 | Colorectum | AD | Bacterial invasion of epithelial cells | 44/2092 | 77/8465 | 1.13e-09 | 2.22e-08 | 1.42e-08 | 44 |
| hsa051351 | Colorectum | AD | Yersinia infection | 58/2092 | 137/8465 | 3.90e-06 | 4.35e-05 | 2.78e-05 | 58 |
| hsa052051 | Colorectum | AD | Proteoglycans in cancer | 70/2092 | 205/8465 | 1.37e-03 | 8.46e-03 | 5.39e-03 | 70 |
| hsa051701 | Colorectum | AD | Human immunodeficiency virus 1 infection | 72/2092 | 212/8465 | 1.40e-03 | 8.46e-03 | 5.39e-03 | 72 |
| hsa051631 | Colorectum | AD | Human cytomegalovirus infection | 75/2092 | 225/8465 | 2.00e-03 | 1.10e-02 | 7.01e-03 | 75 |
| hsa048101 | Colorectum | AD | Regulation of actin cytoskeleton | 75/2092 | 229/8465 | 3.36e-03 | 1.76e-02 | 1.12e-02 | 75 |
| hsa045101 | Colorectum | AD | Focal adhesion | 67/2092 | 203/8465 | 4.40e-03 | 2.17e-02 | 1.38e-02 | 67 |
| hsa046701 | Colorectum | AD | Leukocyte transendothelial migration | 41/2092 | 114/8465 | 4.60e-03 | 2.20e-02 | 1.40e-02 | 41 |
| hsa051312 | Colorectum | SER | Shigellosis | 87/1580 | 247/8465 | 3.07e-10 | 7.27e-09 | 5.28e-09 | 87 |
| hsa051002 | Colorectum | SER | Bacterial invasion of epithelial cells | 36/1580 | 77/8465 | 1.56e-08 | 3.45e-07 | 2.50e-07 | 36 |
| Page: 1 2 3 4 5 6 7 8 |
Top |
Cell-cell communication analysis |
| Identification of potential cell-cell interactions between two cell types and their ligand-receptor pairs for different disease states |
| Ligand | Receptor | LRpair | Pathway | Tissue | Disease Stage |
| Page: 1 |
Top |
Single-cell gene regulatory network inference analysis |
| Find out the significant the regulons (TFs) and the target genes of each regulon across cell types for different disease states |
| TF | Cell Type | Tissue | Disease Stage | Target Gene | RSS | Regulon Activity |
| ∗The dot plots of a searched regulon are shown for all cell subpopulations in each disease state of each tissue based on the regulon specific score inferred using pySCENIC and by calculating the average expression. |
| Page: 1 |
Top |
Somatic mutation of malignant transformation related genes |
| Annotation of somatic variants for genes involved in malignant transformation |
| Hugo Symbol | Variant Class | Variant Classification | dbSNP RS | HGVSc | HGVSp | HGVSp Short | SWISSPROT | BIOTYPE | SIFT | PolyPhen | Tumor Sample Barcode | Tissue | Histology | Sex | Age | Stage | Therapy Types | Drugs | Outcome |
| PXN | insertion | Nonsense_Mutation | novel | c.1223_1224insTGTGTGAGAACTAAATGAGATAATGC | p.Asn409ValfsTer2 | p.N409Vfs*2 | P49023 | protein_coding | TCGA-AN-A0AR-01 | Breast | breast invasive carcinoma | Female | <65 | I/II | Unknown | Unknown | SD | ||
| PXN | SNV | Missense_Mutation | rs201427575 | c.1127N>G | p.Lys376Arg | p.K376R | P49023 | protein_coding | tolerated(0.07) | benign(0.022) | TCGA-EA-A3HR-01 | Cervix | cervical & endocervical cancer | Female | <65 | I/II | Unknown | Unknown | SD |
| PXN | SNV | Missense_Mutation | novel | c.1346N>T | p.Thr449Met | p.T449M | P49023 | protein_coding | deleterious(0) | probably_damaging(0.992) | TCGA-EA-A410-01 | Cervix | cervical & endocervical cancer | Female | <65 | I/II | Unknown | Unknown | SD |
| PXN | SNV | Missense_Mutation | novel | c.1185C>G | p.His395Gln | p.H395Q | P49023 | protein_coding | deleterious(0) | probably_damaging(0.994) | TCGA-VS-AA62-01 | Cervix | cervical & endocervical cancer | Female | <65 | I/II | Chemotherapy | cisplatin | PD |
| PXN | SNV | Missense_Mutation | c.1067A>G | p.Gln356Arg | p.Q356R | P49023 | protein_coding | deleterious(0.02) | probably_damaging(0.948) | TCGA-A6-3809-01 | Colorectum | colon adenocarcinoma | Female | >=65 | I/II | Unknown | Unknown | SD | |
| PXN | SNV | Missense_Mutation | c.742N>A | p.Val248Ile | p.V248I | P49023 | protein_coding | tolerated(0.35) | benign(0.236) | TCGA-A6-A565-01 | Colorectum | colon adenocarcinoma | Female | <65 | III/IV | Unspecific | 5FU | PD | |
| PXN | SNV | Missense_Mutation | rs766354430 | c.1189N>A | p.Val397Ile | p.V397I | P49023 | protein_coding | tolerated(0.07) | benign(0.428) | TCGA-AA-A00N-01 | Colorectum | colon adenocarcinoma | Male | >=65 | I/II | Unknown | Unknown | PD |
| PXN | SNV | Missense_Mutation | c.1618C>T | p.His540Tyr | p.H540Y | P49023 | protein_coding | deleterious(0) | probably_damaging(0.999) | TCGA-CK-4951-01 | Colorectum | colon adenocarcinoma | Female | >=65 | I/II | Unknown | Unknown | PD | |
| PXN | SNV | Missense_Mutation | c.1602N>T | p.Gln534His | p.Q534H | P49023 | protein_coding | deleterious(0.02) | benign(0.236) | TCGA-D5-6540-01 | Colorectum | colon adenocarcinoma | Male | >=65 | I/II | Unknown | Unknown | SD | |
| PXN | SNV | Missense_Mutation | rs748821995 | c.16N>A | p.Ala6Thr | p.A6T | P49023 | protein_coding | deleterious_low_confidence(0) | probably_damaging(0.996) | TCGA-G4-6320-01 | Colorectum | colon adenocarcinoma | Male | >=65 | III/IV | Chemotherapy | oxaliplatin | SD |
| Page: 1 2 3 4 |
Top |
Related drugs of malignant transformation related genes |
| Identification of chemicals and drugs interact with genes involved in malignant transfromation |
| (DGIdb 4.0) |
| Entrez ID | Symbol | Category | Interaction Types | Drug Claim Name | Drug Name | PMIDs |
| 5829 | PXN | NA | H2O2 | 9590268 | ||
| 5829 | PXN | NA | 1,2,4,5-BENZENETETRAAMINE TETRAHYDROCHLORIDE | CHEMBL456559 | 18989950 | |
| 5829 | PXN | NA | ANTISENSE OLIGONUCLEOTIDES | 14576084 | ||
| 5829 | PXN | NA | LOVASTATIN | LOVASTATIN | 11581207 |
| Page: 1 |

Copyright 2023-Present -The University of Texas Health Science Center at Houston |